. 2023 Jul 5;12(13):1786.
doi: 10.3390/cells12131786.

Astroglial Cell-to-Cell Interaction with Autoreactive Immune Cells in Experimental Autoimmune Encephalomyelitis Involves P2X7 Receptor, β3-Integrin, and Connexin-43

Affiliations

Astroglial Cell-to-Cell Interaction with Autoreactive Immune Cells in Experimental Autoimmune Encephalomyelitis Involves P2X7 Receptor, β3-Integrin, and Connexin-43

Katarina D Milicevic et al. Cells. .

Abstract

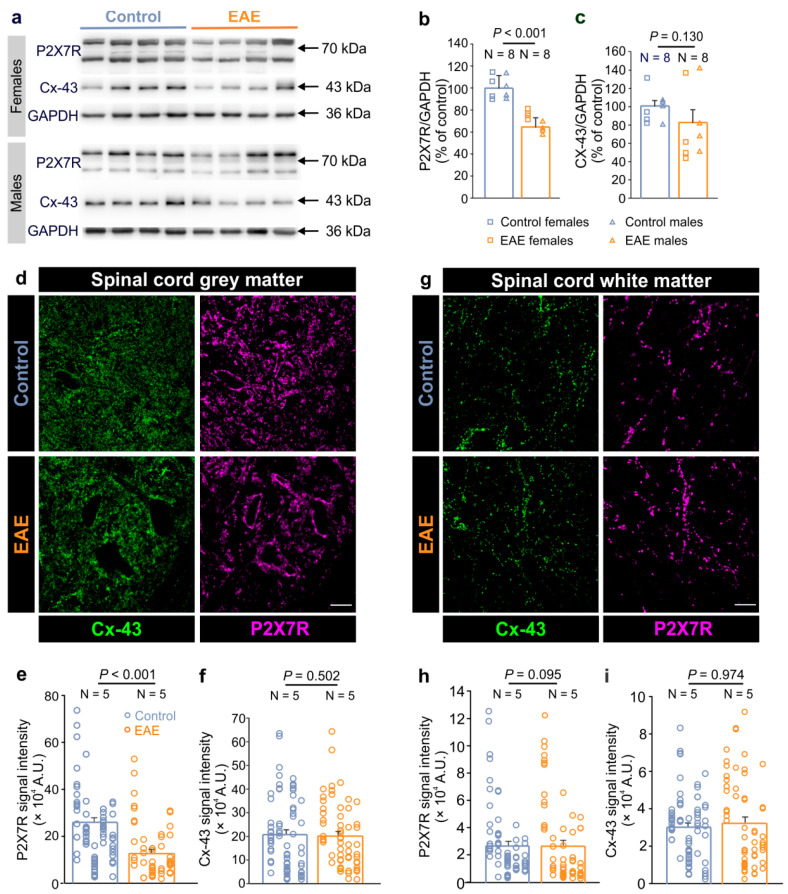
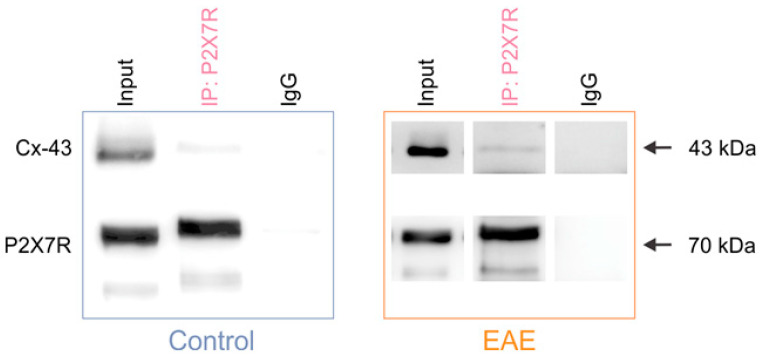
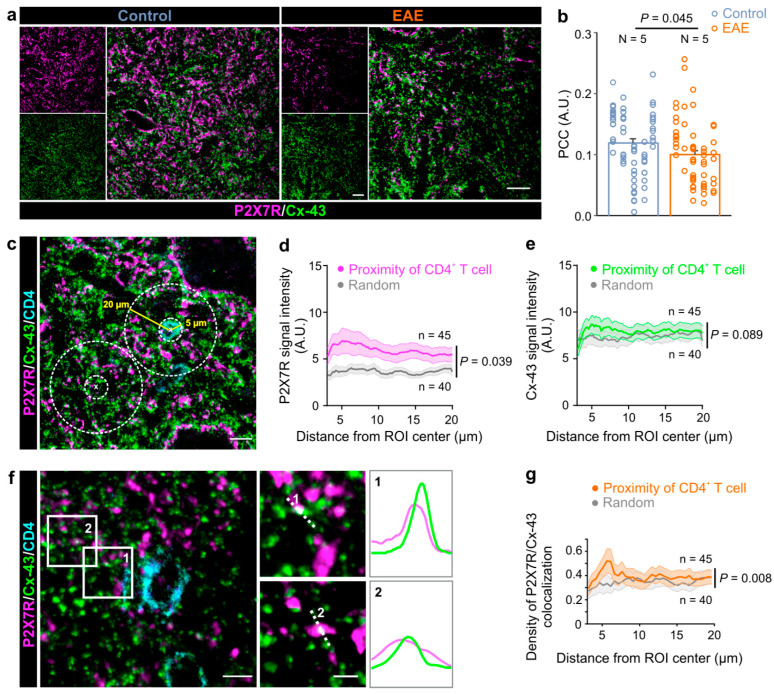
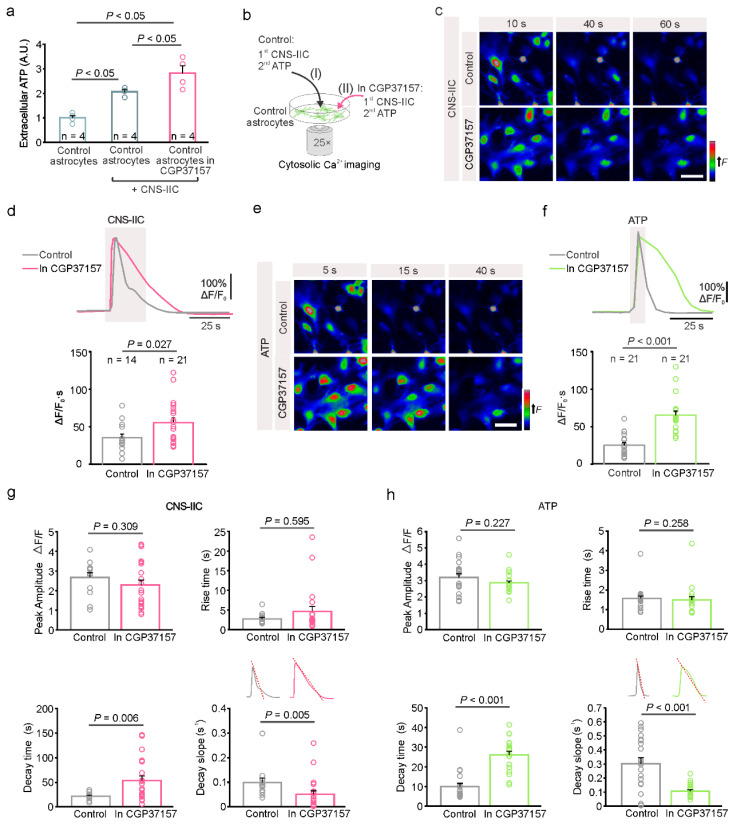
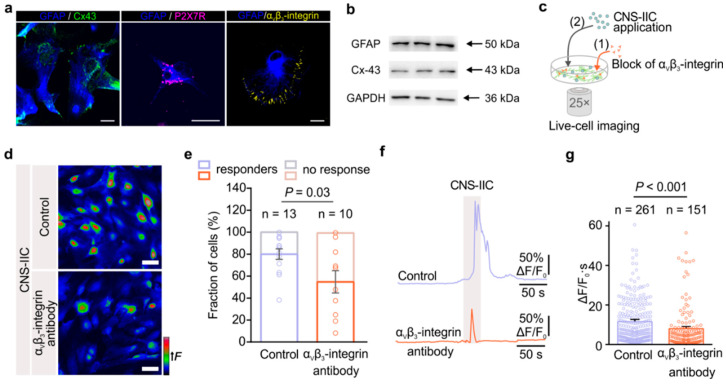
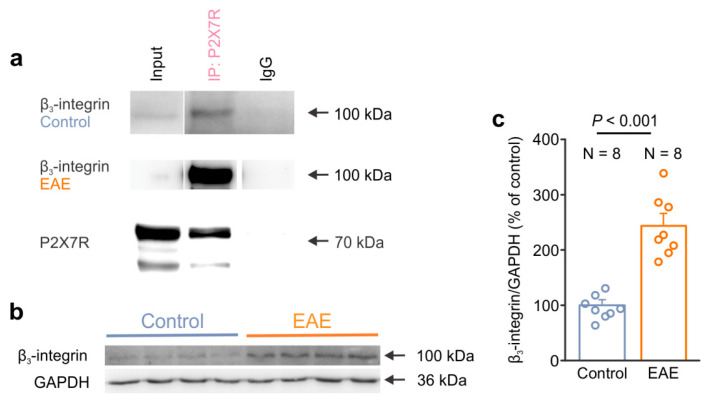
In multiple sclerosis (MS), glial cells astrocytes interact with the autoreactive immune cells that attack the central nervous system (CNS), which causes and sustains neuroinflammation. However, little is known about the direct interaction between these cells when they are in close proximity in the inflamed CNS. By using an experimental autoimmune encephalomyelitis (EAE) model of MS, we previously found that in the proximity of autoreactive CNS-infiltrated immune cells (CNS-IICs), astrocytes respond with a rapid calcium increase that is mediated by the autocrine P2X7 receptor (P2X7R) activation. We now reveal that the mechanisms regulating this direct interaction of astrocytes and CNS-IICs involve the coupling between P2X7R, connexin-43, and β3-integrin. We found that P2X7R and astroglial connexin-43 interact and concentrate in the immediate proximity of the CNS-IICs in EAE. P2X7R also interacts with β3-integrin, and the block of astroglial αvβ3-integrin reduces the P2X7R-dependent calcium response of astrocytes upon encountering CNS-IICs. This interaction was dependent on astroglial mitochondrial activity, which regulated the ATP-driven P2X7R activation and facilitated the termination of the astrocytic calcium response evoked by CNS-IICs. By further defining the interactions between the CNS and the immune system, our findings provide a novel perspective toward expanding integrin-targeting therapeutic approaches for MS treatment by controlling the cell-cell interactions between astrocytes and CNS-IICs.

Keywords: astrocytes; calcium signaling; central nervous system autoimmune disease; hemichannel; immune cell; integrin; multiple sclerosis; purinergic receptors.


Conflict of interest statement

The authors declare no conflict of interest.

Figures

Figure 1
Figure 1
Decreased P2X7 receptor and unchanged Cx-43 expression in the spinal cord of rats with EAE. (a) Representative Western blots showing the P2X7 receptor (P2X7R) and connexin-43 (Cx-43) expressions in the lumbar spinal cords of the female and male control and EAE rats. GAPDH was used as a loading control. (b,c) Graphs showing the P2X7R (b) and Cx-43 (c) protein expression in the lumbar spinal cords of EAE rats at the peak of the disease (N = 8) compared to the healthy controls (N = 8) (p < 0.001 for P2X7R and p = 0.130 for Cx-43, Mann–Whitney rank sum test). The squares represent the data obtained for individual females, and triangles for individual males. (d) The confocal images of the lumbar spinal cord gray matter that was immunostained for Cx-43 (green) and P2X7R (magenta) in the control and EAE rats. Scale bar is 20 µm. (e,f) Graphs showing the P2X7R (e) and Cx-43 (f) signal intensity in the lumbar spinal cord gray matter of EAE rats (N = 5) compared to the controls (N = 5) (Mann–Whitney rank sum test, where p < 0.001 for P2X7R, and p = 0.502 for Cx-43). (g) The confocal images of the spinal cord white matter that was immunostained for Cx-43 (green) and P2X7R (magenta) in the control and EAE rats. Scale bar is 20 µm. Images in the (d,g) are maximum intensity projections of the 10 µm z-stacks. (h,i) Graphs showing the P2X7R (h) and Cx-43 (i) signal intensity in the white matter of the lumbar spinal cords in the EAE rats (N = 5) compared to the controls (N = 5) (Mann–Whitney rank sum test, where p = 0.095 for P2X7R, and p = 0.974 for Cx-43). Each vertical dot plot corresponds to the data points obtained from the individual animal. N indicates the number of animals. Data are presented as the mean ± SEM.
Figure 2
Figure 2
The P2X7 receptor interacts with the astroglial connexin-43 in the control and EAE rats. Representative Western blots show that Cx-43 is present in the input and P2X7R immunoprecipitate complex, and is absent from the IgG immunoprecipitate in the spinal cord of the control and EAE rats. The bands corresponding to P2X7R are identified in the input and IP lanes, but not in the IgG lane.
Figure 3
Figure 3
The P2X7 receptor colocalizes with the astroglial connexin-43 in the immediate proximity of CNS-infiltrated CD4+ T cells. (a) Representative confocal images of the spinal cord gray matter that were immunostained for the connexin-43 (Cx-43, green) and P2X7 receptors (P2X7R, magenta) in the control and EAE rats. Scale bars are 20 µm. (b) Graph showing Pearson’s correlation coefficient (PCC) of the colocalization between the Cx-43 and P2X7R expression in the spinal cord gray matter in the control and EAE rats (two-tailed Student’s t test, p = 0.045). N indicates the number of used animals. Each vertical dot plot corresponds to the data points obtained from the individual animal. Data are presented as the mean ± SEM. (c) Confocal images of P2X7R (magenta), Cx43 (green), and CD4+ T cell (cyan) immunofluorescent labeling. The depicted regions of interests (ROI) were used for analysis of P2X7R, Cx-43 signal intensity, and the colocalization in the proximity of CD4+ T cells and random ROIs. The yellow and dashed white lines mark the 5 µm and 20 µm radial distances, respectively, and these were measured from the center of the ROIs. Scale bar is 10 µm. (d) Graph showing the distribution of the P2X7R signal intensity in the proximity of CD4+ T cells (magenta) and random ROIs (gray) (two-way ANOVA, p = 0.039). (e) Graph showing the distribution of the Cx-43 signal intensity in the proximity of CD4+ T cells (green) and random ROIs (gray) (two-way ANOVA, p = 0.089). (f) Confocal images of the Cx-43 and P2X7R fluorescent signals in the vicinity of the infiltrated CD4+ T cells in the gray matter of the spinal cord of rats with EAE. Scale bar is 5 µm. Numbered (1, 2) white rectangles correspond to the regions presented on the right side. Scale bars are 2 µm. The profile intensity plots of the Cx-43 and P2X7R fluorescent signals were measured along each white dotted line. (g) Graph showing the density of P2X7R/Cx-43 colocalization in the proximity of CD4+ T cells (orange) and random (gray) ROIs (two-way ANOVA, p = 0.008). Data are presented as the mean ± SEM, and n is the number of analyzed ROIs.
Figure 4
Figure 4
Interaction between the spinal cord astrocytes and CNS-infiltrated immune cells is mitochondria-dependent. (a) Summary graph of the quantitative measurement of ATP release by astrocytes when using a luciferin-luciferase bioluminescence assay. In the controls (control astrocytes) after the addition of CNS-IICs alone (control astrocytes + CNS-IICs) or in the presence of 20 µM CGP37157 (control astrocytes + CNS-IICs + CGP37157). Dots represent the individual experiments (n = 4, One-way ANOVA, p < 0.001; Student Newman-Keuls multiple comparisons test, where p < 0.05 for the controls vs. CNS-IICs, p < 0.05 for the controls vs. CGP37157 + CNS-IICs, and p < 0.05 for CNS-IICs vs. CGP37157 + CNS-IICs). The CNS-IICs were obtained from three rats with EAE. (b) Scheme illustrating the astroglial cytosolic Ca2+ imaging during the application of CNS-IICs and ATP in the control (I) and in CGP37157 (II, pretreatment with 20 µM CGP37157 for 20 min). (c) Colorcoded images of the Fluo 4-AM fluorescence in astrocytes during the application of CNS-IICs in the control and with CGP173157 at the indicated time points from the start of the CNS-IICs application. Scale bar is 50 µm. (d) Example traces and summary plot of the astrocytic Ca2+ increase induced by the CNS-IIC application in the control and in CGP37157 (n is the number of analyzed cells from three independent experiments, and the CNS-IICs were obtained from three rats with EAE as determined via the Mann-Whitney rank sum test, p = 0.027). The gray rectangle depicts the CNS-IIC application. (e) Color-coded images of the Fluo 4-AM fluorescence in astrocytes during a brief application of 200 µM ATP in the control and in CGP173157 at the indicated time points from the start of the ATP application. Scale bar is 50 µm. (f) Example traces and the summary plot of the astrocytic Ca2+ response evoked by ATP in the control and in CGP37157 (n indicates the number of cells from three independent experiments, Mann-Whitney rank sum test, p < 0.001). (g) Graphs showing the peak amplitude, rise time, decay time, and decay slope of the astrocytic Ca2+ response evoked by CNS-IICs, which was recorded in controls and in CGP37157 (Mann-Whitney rank sum test for rise p = 0.595, and decay time p = 0.006, decay slope p = 0.005, Student t-test for peak amplitude p= 0.309, number of cells as in (d)). (h) Graphs showing the peak amplitude, rise time, decay time, and decay slope of the astrocytic Ca2+ response that was induced by ATP, and recorded in the controls and in CGP37157 (Mann-Whitney rank sum test for peak amplitude p = 0.227, rise time p = 0.258, decay time p < 0.001, decay slope p < 0.001, number of cells as in (f)). The insets in (g,h) are as follows: the experimental paradigm for the cytoplasmic Ca2+ efflux rate measurement was based on the determination of the slope of the decay phase of the Ca2+ response. In (d,fh), the dots represent the analyzed astrocytes.
Figure 5
Figure 5
The αvβ3-integrin expressed in astrocytes mediates their direct interaction with CNS-IICs and a downstream increase in intracellular Ca2+. (a) An example of connexin-43 (Cx-43, green), P2X7 receptor (P2X7R, magenta), and αvβ3-integrin (yellow) immunolabeling in the control cultured astrocytes that were labeled using GFAP (blue). Scale bar is 20 µm. (b) Western blots showing the Cx-43 and GFAP expressions in the control cultured spinal cord astrocytes. GAPDH is used as a loading control. (c) Schematic depicting the imaging of astrocytic Ca2+ during the application of CNS-IICs in the control and after blocking the astrocytic αvβ3-integrin by preincubation with a primary antibody (1 µg/mL) for 2 h. (d) Color-coded images of the Fluo-4 fluorescence in astrocytes during the application of CNS-IICs in the control and after blocking astroglial αvβ3-integrin. Scale bar is 50 µm. (e) Stacked graph showing the fraction of the astrocytes that responded (responders) and that did not respond to the applied CNS-IICs (two-tailed Student’s t test, p = 0.03). Data are shown as the mean ± SEM from 13 and 10 independent experiments (depicted by dots) of the control and αvβ3-integrin antibody group, respectively. N = 5 EAE rats. (f) Example traces showing the intracellular Ca2+ increase in the astrocytes following the application of CNS-IICs from the control and blocked integrin groups. Gray rectangle depicts CNS-IICs application. (g) Summary plot comparing Ca2+ elevation in the astrocytes from the experiments shown in (d) (Mann–Whitney rank sum test, p < 0.001). n is the number of responders. Dots represent the analyzed astrocytes.
Figure 6
Figure 6
β3-integrin interacts with the P2X7 receptor and shows an increased expression in the spinal cord of EAE rats. (a) Representative Western blots showing the presence of β3-integrin in the P2X7R immunoprecipitate that was isolated from the lumbar spinal cord of the control and EAE rats. The bands corresponding to P2X7R were identified in the Input and IP lanes but not in the IgG lane. (b) Representative Western blot showing the higher expression of β3-integrin in the lumbar spinal cord of EAE rats compared to the control rats. GAPDH was used as a loading control. (c) Graph comparing the expression level of β3-integrin in the lumbar spinal cord of the healthy control (N = 8) and EAE rats (N = 8) (two-tailed Student’s t test, p < 0.001). Dots represent the data points of individual animals. Data are shown as the mean ± SEM.

Similar articles

Cited by

References

    1. Walton C., King R., Rechtman L., Kaye W., Leray E., Marrie R.A., Robertson N., La Rocca N., Uitdehaag B., van der Mei I., et al. Rising prevalence of multiple sclerosis worldwide: Insights from the Atlas of MS, third edition. Mult. Scler. J. 2020;26:1816–1821. doi: 10.1177/1352458520970841. - DOI - PMC - PubMed
    1. Dobson R., Giovannoni G. Multiple sclerosis—A review. Eur. J. Neurol. 2019;26:27–40. doi: 10.1111/ene.13819. - DOI - PubMed
    1. Dendrou C.A., Fugger L., Friese M.A. Immunopathology of multiple sclerosis. Nat. Rev. Immunol. 2015;15:545–558. doi: 10.1038/nri3871. - DOI - PubMed
    1. Sofroniew M.V. Astrocyte barriers to neurotoxic inflammation. Nat. Rev. Neurosci. 2015;16:249–263. doi: 10.1038/nrn3898. - DOI - PMC - PubMed
    1. Kim R.Y., Hoffman A.S., Itoh N., Ao Y., Spence R., Sofroniew M.V., Voskuhl R.R. Astrocyte CCL2 sustains immune cell infiltration in chronic experimental autoimmune encephalomyelitis. J. Neuroimmunol. 2014;274:53–61. doi: 10.1016/j.jneuroim.2014.06.009. - DOI - PMC - PubMed

Publication types