. 2023 Jul 6;12(13):1795.
doi: 10.3390/cells12131795.

A YAP/TAZ-ARHGAP29-RhoA Signaling Axis Regulates Podocyte Protrusions and Integrin Adhesions

Affiliations

A YAP/TAZ-ARHGAP29-RhoA Signaling Axis Regulates Podocyte Protrusions and Integrin Adhesions

Manuel Rogg et al. Cells. .

Abstract

Glomerular disease due to podocyte malfunction is a major factor in the pathogenesis of chronic kidney disease. Identification of podocyte-specific signaling pathways is therefore a prerequisite to characterizing relevant disease pathways and developing novel treatment approaches. Here, we employed loss of function studies for EPB41L5 (Yurt) as a central podocyte gene to generate a cell type-specific disease model. Loss of Yurt in fly nephrocytes caused protein uptake and slit diaphragm defects. Transcriptomic and proteomic analysis of human EPB41L5 knockout podocytes demonstrated impaired mechanotransduction via the YAP/TAZ signaling pathway. Further analysis of specific inhibition of the YAP/TAZ-TEAD transcription factor complex by TEADi led to the identification of ARGHAP29 as an EPB41L5 and YAP/TAZ-dependently expressed podocyte RhoGAP. Knockdown of ARHGAP29 caused increased RhoA activation, defective lamellipodia formation, and increased maturation of integrin adhesion complexes, explaining similar phenotypes caused by loss of EPB41L5 and TEADi expression in podocytes. Detection of increased levels of ARHGAP29 in early disease stages of human glomerular disease implies a novel negative feedback loop for mechanotransductive RhoA-YAP/TAZ signaling in podocyte physiology and disease.

Keywords: ARHGAP29; EPB41L5; YAP/TAZ; Yurt; glomerular kidney disease; mechanotransduction; podocyte.


Conflict of interest statement

The authors declare no conflict of interest.

Figures

Figure 1
Figure 1
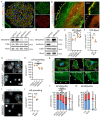
Transcriptome and proteome analysis of EPB41L5 knockout podocytes reveals impaired YAP/TAZ signaling. (a) Schematic depicting transcriptome and proteome analysis of CRISPR/Cas9 generated EPB41L5 knockout (KO) and wildtype (WT) podocytes. (b) Volcano plot of RNA sequencing (transcriptome) analysis of two WT and KO cell lines indicate significant regulation of 595 gene transcripts (red dots). Significance (red dots) was defined as log2 fold change (FC) > 1 or <−1 and adjusted p-value < 0.05. Two replicates per cell line were analyzed. (c) Scatter plot of SILAC based quantitative LC-MS (proteome) analysis of whole cell lysates of EPB41L5 WT and KO podocytes indicates significant regulation of 84 proteins (red dots). Significance was defined as log2 fold change (FC) > 1 or <−1 in both SILAC pairs of WT and KO cells (KO-1 to WT-1 and KO-2 to WT-2). (d) Enrichment analysis of transcription factors (TF) for significantly downregulated transcripts in KO podocytes. Red dots indicate enrichment of gene transcripts regulated by YAP/TAZ-TEAD (TEAD1 and TEAD4) mediated transcription signaling. (e) Transcriptome and proteome analysis of EPB41L5 KO podocytes shows reduced expression levels of YAP target genes (secretome—data derived from a previously published proteome analysis of secreted proteins [22]). (f,g) Immunofluorescence analysis of nuclear localization of YAP confirms reduced YAP levels in EPB41L5 KO podocytes. Scatter plot dots indicate mean nuclear fluorescence intensity (MFI) of 4 experiments as used for statistical analysis (white dots indicate WT and grey dots KO cells); error bars indicate mean and S.E.M.; * p < 0.01; **** p < 0.0001; n.s.—not significant; n.d.—not detected.
Figure 2
Figure 2
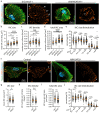
Inhibition of YAP/TAZ-TEAD mediated transcription alters cytoskeletal function of podocytes. (a) Schematic depicting the specific inhibition of YAP/TAZ-TEAD complex formation by expression of the YAP/TAZ binding domain of TEAD transcription factors (TEADi system) [34]. (b,c) Cell spreading analysis of control vector and TEADi podocytes shows impaired initial cell spreading (after 30 min) by TEADi expression on collagen IV. Cells were stained with Phalloidin (F-Actin) and Hoechst (cell nucleus). Scatter plot dots indicate the mean cell size of 3 individual experiments used for statistical analysis (white dots indicate Ctrl. and grey dots TEADi cells). (d,e) Immunofluorescence analysis of full spread cells (24 h) shows increased numbers of cells with atypical (fragmented pseudopod-like) or minimally formed lamellipodia (white asterisks) as a result of TEADi induction. Percentage of cells exhibiting regular formed lamellipodia (usual type) was used for statistical comparison (percentages of 3 experiments were used for statistical analysis). (e) Immunofluorescence staining of the integrin adhesion complex (IAC) component Paxillin (PXN), F-Actin (Phalloidin) and of cell nuclei (Hoechst) was performed. Lamellipodia (white asterisks) of TEADi cells appeared less coherent. Moreover, an increased number of large IACs was observed (white arrowheads). (fi) Quantitative analysis of IAC morphology confirms increased IAC size and increased appearance of larger IACs. Scatter plot dots indicate mean values of individual cells used for statistical analysis; 3 independent experiments with 25 cells per experiment and genotype (total of 75 cells per genotype) were analyzed. Percentages indicate relative change to control for respective IAC size classes. Error bars indicate mean and S.E.M.; * p < 0.05; *** p < 0.001; **** p < 0.0001.
Figure 3
Figure 3
The YAP/TAZ-TEAD complex controls expression of podocyte specific genes like ARHGAP29. (a) Schematic illustrating the transcriptome analysis of TEADi and control (EGFP) expressing podocytes. (b) Transcription factor (TF) enrichment analysis for significant regulated genes transcripts confirms enrichment of TEAD1 and TEAD4 target genes as a consequence of expression of TEADi. (c) Principal component analysis (PCA) demonstrates clear transcriptional separation of control and TEADi podocytes. (d) Volcano plot shows significant alteration of 1274 gene transcripts (red dots). Significance for this plot was defined as log2 fold change (FC) > 0.5 or <−0.5 and adjusted p-value < 0.05. (e) Venn diagram depicts overlap of 217 podocyte genes transcripts that are significantly regulated by TEADi expression (p-value < 0.0001) and that are highly podocyte specific enriched in vivo [8]. (f) Volcano plot of these genes reveals strongly TEAD TF dependent expression of many genes with essential functions in podocytes (only genes with reduced expression followed by TEADi expression are shown, red dots indicate genes with a log2 fold change <−1). (g) Venn diagram depicts overlap of 271 podocyte gene transcripts that are significantly regulated by TEADi expression (p-value < 0.0001) and by loss of EPB41L5 (p-value < 0.0001) and that are expressed in podocytes in vitro. [8] (h) Volcano plot shows 118 of these 271 genes that are less expressed in consequence of TEADi expression and loss of EPB41L5 (red dots indicate gene transcripts with highly significant adjusted p-values). (in) Western blot confirms reduced expression of ARHGAP29 in EPB41L5 KO cells, TEADi expressing cells and as a result of confluent (dense) cell culture conditions (3 or 4 independent replicates per experiment were used for statistical analysis as indicated by scatter plot dots; white and gray dots indicate experimental conditions). Alpha-Tubulin (TUBA) was used as loading control and quantification is presented relative to mean expression of control cells. Error bars indicate mean and S.E.M.; ** p < 0.01; **** p < 0.0001.
Figure 4
Figure 4
ARHGAP29 is required for generation of lamellipodia in podocytes. (a) Immunofluorescence analysis of human glomeruli confirms podocyte specific enrichment of ARHGAP29 (green). NPHS1 (red) was used to label the podocyte compartment and Hoechst to stain cell nuclei (blue). (b) Immunofluorescence analysis of cultured human podocytes reveals subcellular localization of ARHGAP29 to the leading edge of lamellipodia (white asterisks) and diffuse positivity of the cytosol but not of F-Actin (white arrowheads). F-Actin (Phalloidin) staining was applied to label actin fibers and lamellipodia. (c,d) Western blot analysis of ARHGAP29 demonstrates successful generation of shRNA mediated ARHGAP29 (AG29) KD or ARHGAP29 overexpressing podocytes. Non-targeting shRNAs or Luciferase were expressed as negative controls. Alpha-Tubulin (TUBA) was used as loading control. No marked alteration of RhoA was detected. (e,f) Active GTP-bound RhoA analysis confirms RhoGAP function of ARHGAP29 for RhoA in podocytes. Scatter plot dots indicate independent replicates used for statistical analysis. shCtrl.−1 & −2 were pooled for statistical analysis (white dots indicate Ctrl. and grey dots KD or overexpression cells). (gj) Knockdown and overexpression of ARHGAP29 impairs initial cell spreading (30 min) on collagen IV. Cells were stained by Phalloidin (F-Actin) and Hoechst (cell nucleus). Scatter plot dots indicate mean cell size of 3 (h) or 4 (j) experiments used for statistical analysis. (km) Immunofluorescence analysis of full spread cells (24 h) reveals increased numbers of cells with atypical (fragmented pseudopod-like) or minimally formed lamellipodia as a result of ARHGAP29 KD. Representative images show representative cells for different classes of lamellipodia (white arrowheads). Percentage of cells exhibiting regular formed lamellipodia (usual type) was used for statistical comparison (3 experiments were analyzed and percentages per experiment and condition were used for statistical analysis). Immunofluorescence staining of the IAC component Paxillin (PXN), F-Actin (Phalloidin) and of cell nuclei (Hoechst) was performed. Error bars indicate mean and S.E.M.; * p < 0.05; ** p < 0.01; *** p < 0.001; **** p < 0.0001.
Figure 5
Figure 5
ARHGAP29 influence size and distribution of integrin adhesion complexes. (a) Immunofluorescence staining of the IAC component Paxillin (PXN), F-Actin (Phalloidin) and of cell nuclei (Hoechst) was performed. IACs of ARHGAP29 KD cells appeared larger and more confluent (white arrowheads). Small (nascent) IACs (white arrows) appeared reduced in ARHGAP29 KD cells. (be) Analysis of IAC morphology confirm increased IAC size and increased appearance of large IACs in ARHGAP29 KD podocytes. Scatter plot dots indicate mean values of individual cells analyzed (white dots indicate Ctrl. and grey dots KD cells); 3 independent experiments with 25 cells per experiment and genotype (total of 75 cells per genotype) were used for statistical analysis. Percentages indicate relative changes to control for respective IAC size classes. (f) Immunofluorescence staining of ARHGAP29 overexpressing cells show slightly reduced number of large (mature) IACs. (gj) Analysis of IAC morphology reveal reduced IAC size and decreased appearance of large IACs. Scatter plot dots indicate mean values of individual cells used for statistical analysis (white dots indicate Ctrl. and grey dots overexpression cells); 4 independent experiments with 25 cells per experiment and genotype (total of 100 cells per genotype) were analyzed. Percentages indicate relative change to control for respective IAC size classes. Error bars indicate mean and S.E.M.; * p < 0.05; ** p < 0.01; **** p < 0.0001; n.s.—not significant.
Figure 6
Figure 6
Podocyte damage leads to increased expression of ARHGAP29 counterbalancing RhoA signaling. (a) ARHGAP29 immunofluorescence analysis of glomeruli. The slit diaphragm (SD) component NPHS1 was used to label the basolateral podocyte compartment and to indicate glomeruli with damages SD architecture (early and sensitive marker for podocyte damage). Cell nuclei were stained by Hoechst. Representative images show different types of glomerular/podocyte damage within the same kidney sample. Glomeruli were classified as not/very mild damaged (control group), moderate damaged (damaged group) or sclerosed based on the structural integrity of SD (NPHS1) architecture and of overall glomerular structure (evaluated by WGA, NPHS1 and Hoechst staining). Glomerular sclerosis and concomitant podocyte loss causes an overall reduction and loss of ARHGAP29 expression. In contrast, ARHGAP29 expression appears increased in glomeruli with moderate podocyte SD damage. (b) Quantification of ARHGAP29 expression (mean fluorescence intensity—MFI) within the podocyte compartment of control (Ctrl.) and moderate damaged (Dmg.) glomeruli (n = 5; scatter plot dots indicate mean IF intensity per class and patient used for statistical analysis. Glomerular damage classes were matched per sample for statistical analysis to adjust for global differences in IF signal intensity between individual samples. Orange lines indicate matching classes from one patient; ** p < 0.01). (c) Isolated murine glomeruli were treated (ex vivo) with Doxorubicin (Doxo) and analyzed for altered gene expression of Arhgap29, Epb41l5 and common YAP target genes. Dotted line indicate adjusted p-value (q-value) of 0.05. (d) Analysis of mRNA expression levels in glomeruli damaged by different glomerular disease using the Nephroseq database. Heatmap indicates log2 fold changes (FC) for selected genes in hypertensive nephropathy (HTN), diabetic nephropathy (DN), minimal change disease (MCD), focal segmental glomerulosclerosis (FSGS) and collapsing FSGS (cFSGS). ARHGAP29 appears enriched in glomerular diseases with mild damage (HTN, MCD) and reduced in destructive diseases (DN, FSGS, cFSGS). (e) Schematic depicting a model for a regulatory function of ARHGAP29 in podocyte disease where increased ARHGAP29 expression counteracts increased mechanosignaling via inhibition of RhoA signaling.

References

    1. Romagnani P., Remuzzi G., Glassock R., Levin A., Jager K.J., Tonelli M., Massy Z., Wanner C., Anders H.J. Chronic kidney disease. Nat. Rev. Dis. Primers. 2017;3:17088. doi: 10.1038/nrdp.2017.88. - DOI - PubMed
    1. Kopp J.B., Anders H.J., Susztak K., Podesta M.A., Remuzzi G., Hildebrandt F., Romagnani P. Podocytopathies. Nat. Rev. Dis. Primers. 2020;6:68. doi: 10.1038/s41572-020-0196-7. - DOI - PMC - PubMed
    1. Collaboration G.B.D.C.K.D. Global, regional, and national burden of chronic kidney disease, 1990–2017: A systematic analysis for the global burden of disease study 2017. Lancet. 2020;395:709–733. - PMC - PubMed
    1. Benzing T., Salant D. Insights into glomerular filtration and albuminuria. N. Engl. J. Med. 2021;384:1437–1446. doi: 10.1056/NEJMra1808786. - DOI - PubMed
    1. Sachs N., Sonnenberg A. Cell-matrix adhesion of podocytes in physiology and disease. Nat. Rev. Nephrol. 2013;9:200–210. doi: 10.1038/nrneph.2012.291. - DOI - PubMed

Publication types

MeSH terms