. 2023 Jul 7;12(13):1809.
doi: 10.3390/cells12131809.

Tissue Inhibitor of Metalloproteinases-1 Overexpression Mediates Chemoresistance in Triple-Negative Breast Cancer Cells

Affiliations

Tissue Inhibitor of Metalloproteinases-1 Overexpression Mediates Chemoresistance in Triple-Negative Breast Cancer Cells

Lisa Agnello et al. Cells. .

Abstract

Triple-negative breast cancer (TNBC) is among the most aggressive breast cancer subtypes. Despite being initially responsive to chemotherapy, patients develop drug-resistant and metastatic tumors. Tissue inhibitor of metalloproteinases-1 (TIMP-1) is a secreted protein with a tumor suppressor function due to its anti-proteolytic activity. Nevertheless, evidence indicates that TIMP-1 binds to the CD63 receptor and activates noncanonical oncogenic signaling in several cancers, but its role in mediating TNBC chemoresistance is still largely unexplored. Here, we show that mesenchymal-like TNBC cells express TIMP-1, whose levels are further increased in cells generated to be resistant to cisplatin (Cis-Pt-R) and doxorubicin (Dox-R). Moreover, public dataset analyses indicate that high TIMP-1 levels are associated with a worse prognosis in TNBC subjected to chemotherapy. Knock-down of TIMP-1 in both Cis-Pt-R and Dox-R cells reverses their resistance by inhibiting AKT activation. Consistently, TNBC cells exposed to recombinant TIMP-1 or TIMP-1-enriched media from chemoresistant cells, acquire resistance to both cisplatin and doxorubicin. Importantly, released TIMP-1 reassociates with plasma membrane by binding to CD63 and, in the absence of CD63 expression, TIMP-1-mediated chemoresistance is blocked. Thus, our results identify TIMP-1 as a new biomarker of TNBC chemoresistance and lay the groundwork for evaluating whether blockade of TIMP-1 signal is a viable treatment strategy.

Keywords: CD63 cell receptor; chemoresistance; tissue inhibitor of metalloproteinases-1; triple-negative breast cancer; tumor microenvironment.


Conflict of interest statement

The authors declare no conflict of interest.

Figures
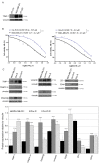
Figure 1
Figure 1
TIMP-1 expression is upregulated in chemoresistant TNBC cell lines. (A) Lysates from TNBC MDA-MB-231 and BT-549 cells and TPBC BT-474 cells were immunoblotted with anti-TIMP-1 antibody. Equal loading was confirmed by immunoblot with anti-vinculin antibody. (B) Cis-Pt-R and Dox-R cells exhibit increased fold changes in EC50 with respect to parental MDA-MB-231 cells. Following 48 h of Dox or Cis-Pt treatment, cell viability was determined and expressed as percentage of viable treated cells with respect to untreated controls. EC50 was estimated on the basis of three independent experiments. ** p < 0.01, *** p < 0.001; unpaired t-test. (C) Lysates from parental and chemoresistant cell lines were immunoblotted with anti-TIMP-1, anti-integrin αv, anti-PDGFRβ, anti-vimentin, anti-CD99, anti-CD44 and anti-ZO-1 antibodies, as indicated, by using anti-vinculin antibody as loading control; the histogram indicates the signal intensity of the bands, normalized to the respective anti-vinculin signal. Bars depict means ± SD of three independent experiments. ** p < 0.01, **** p < 0.0001 relative to MDA-MB-231; unpaired t-test. In (A,C), molecular weights of indicated proteins are reported.
Figure 2
Figure 2
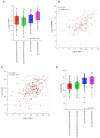
TIMP-1 is enriched in MES TNBC and associated with a worse prognosis in high-grade and chemotreated TNBC patients. (AD) Gene expression analysis in a public data set of TNBC (GSE76124) through the R2 Genomic Analysis and Visualization platform (http://r2.amc.nl). (A) Box plot comparing TIMP-1 gene expression in different TNBC subtypes. The number of tumors for each subtype are reported in brackets. The data were analyzed by one-way ANOVA through the R2 web platform. (B,C) XY-dotplots showing the correlation between TIMP-1 (X-axis) and either PDGFRβ or CD99 (Y-axis) gene expression. (D) Box plot comparing CD99 gene expression in different TNBC subtypes. (E,F) Analysis of the prognostic value of TIMP-1 level in TNBC patients by Event free survival (EFS) Kaplan–Meier curves using a TCGA gene chip mRNA gene array dataset through the KMplot platform (www.kmplot.com). (E) Relationship between TIMP-1 expression levels and EFS in 186 TNBC chemotreated patients of high grade; the expression cut-off was set to 9066 in a range from 509 to 29,697, auto-selecting the best cut-off. (F) Meta-data analysis of TIMP-1 showed no relationship with EFS in 48 treated TPBC patients of any grade. The expression cut-off was set to 5614. The data were statistically analyzed by one-way analysis of variance (ANOVA) in (A,D); Pearson’s r coefficient in (B,C); and log-rank test in (E,F).
Figure 2
Figure 2
TIMP-1 is enriched in MES TNBC and associated with a worse prognosis in high-grade and chemotreated TNBC patients. (AD) Gene expression analysis in a public data set of TNBC (GSE76124) through the R2 Genomic Analysis and Visualization platform (http://r2.amc.nl). (A) Box plot comparing TIMP-1 gene expression in different TNBC subtypes. The number of tumors for each subtype are reported in brackets. The data were analyzed by one-way ANOVA through the R2 web platform. (B,C) XY-dotplots showing the correlation between TIMP-1 (X-axis) and either PDGFRβ or CD99 (Y-axis) gene expression. (D) Box plot comparing CD99 gene expression in different TNBC subtypes. (E,F) Analysis of the prognostic value of TIMP-1 level in TNBC patients by Event free survival (EFS) Kaplan–Meier curves using a TCGA gene chip mRNA gene array dataset through the KMplot platform (www.kmplot.com). (E) Relationship between TIMP-1 expression levels and EFS in 186 TNBC chemotreated patients of high grade; the expression cut-off was set to 9066 in a range from 509 to 29,697, auto-selecting the best cut-off. (F) Meta-data analysis of TIMP-1 showed no relationship with EFS in 48 treated TPBC patients of any grade. The expression cut-off was set to 5614. The data were statistically analyzed by one-way analysis of variance (ANOVA) in (A,D); Pearson’s r coefficient in (B,C); and log-rank test in (E,F).
Figure 3
Figure 3
TIMP-1 expression correlates with chemoresistance. Cis-Pt-R (A) and Dox-R (B) cells were transfected with si-TIMP-1 or siRNA ctrl. Left: at 24 h post-transfection, cells were harvested, and cell lysates prepared and immunoblotted with anti-TIMP-1 antibody. Anti-vinculin antibody was used as a loading control. Molecular weights of indicated proteins are reported. Middle: the histograms indicate the TIMP-1/vinculin ratio of the densitometric signals. Values are shown relative to siRNA ctrl, arbitrarily set to 1. Bars depict means ± SD of three independent experiments. ** p < 0.01, *** p < 0.001 relative to siRNA ctrl; unpaired t-test. Right: cell viability of transfected cells, incubated with increasing concentrations of Cis-Pt (A) or Dox (B) for 48 h, was determined and expressed as percentage of viable treated cells with respect to untreated controls. EC50 values were determined as reported in the legend to Figure 1B. ** p < 0.01, **** p < 0.0001; unpaired t-test.
Figure 4
Figure 4
Silencing TIMP-1 expression induces death of chemoresistant TNBC cells. Cell death of Dox-R (A) and Cis-Pt-R (B) transfected with si-TIMP-1 or siRNA ctrl for 24 h was measured by Annexin-V/PI staining and flow cytometric analysis. Percentage of apoptotic plus necrotic cells is shown on the histogram. (C,D) Lysates from Dox-R (C) and Cis-Pt-R (D) cells following 24 h transfection with si-TIMP-1 or siRNA ctrl were immunoblotted with anti-pAKT, anti-pErk1/2 and anti-vinculin antibodies as indicated. Molecular weights of indicated proteins are reported. The histograms indicate the pAKT/vinculin and pErk1/2/vinculin, reported as relative to siRNA ctrl, arbitrarily set to 1. (AD) Bars depict means ± SD of three independent experiments. * p < 0.05, ** p < 0.01, **** p < 0.0001 relative to siRNA ctrl; ns, not significant; unpaired t-test.
Figure 4
Figure 4
Silencing TIMP-1 expression induces death of chemoresistant TNBC cells. Cell death of Dox-R (A) and Cis-Pt-R (B) transfected with si-TIMP-1 or siRNA ctrl for 24 h was measured by Annexin-V/PI staining and flow cytometric analysis. Percentage of apoptotic plus necrotic cells is shown on the histogram. (C,D) Lysates from Dox-R (C) and Cis-Pt-R (D) cells following 24 h transfection with si-TIMP-1 or siRNA ctrl were immunoblotted with anti-pAKT, anti-pErk1/2 and anti-vinculin antibodies as indicated. Molecular weights of indicated proteins are reported. The histograms indicate the pAKT/vinculin and pErk1/2/vinculin, reported as relative to siRNA ctrl, arbitrarily set to 1. (AD) Bars depict means ± SD of three independent experiments. * p < 0.05, ** p < 0.01, **** p < 0.0001 relative to siRNA ctrl; ns, not significant; unpaired t-test.
Figure 5
Figure 5
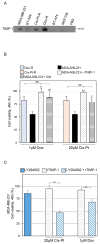
Exogenous TIMP-1 confers chemoresistance to MDA-MB-231 cells. (A) The conditioned medium obtained from MDA-MB-231, BT-549, Cis-Pt-R, Dox-R, BT-474 and MCF10A cells was analyzed by immunoblotting using anti-TIMP-1 antibody. FBS was used to exclude the presence of TIMP-1 in the serum supplementing the culture medium. (B) MDA-MB-231 cells were left untreated or treated for 48 h with 1 µM Dox or 20 µM Cis-Pt alone or in combination with either recombinant TIMP-1 (rTIMP-1) or TIMP-1-enriched CM obtained from Dox-R cells. Cis-Pt-R and Dox-R cells left untreated or treated with 20 µM Cis-Pt or 1 µM Dox, respectively, were used as chemoresistant reference cells. (C) MDA-MB-231 cells were treated for 48 h with rTIMP-1 plus 1 µM Dox or 20 µM Cis-Pt, in the presence or in the absence of 10 µM LY294002. In (B,C), cell viability was analyzed and expressed as percent of viable treated cells with respect to untreated cells. Bars depict means ± SD of three independent experiments. * p < 0.05; ** p < 0.01, relative to treated MDA-MB-231 cells; ns, not significant; °° p < 0.01, one-way ANOVA followed by Tukey’s multiple comparison test.
Figure 6
Figure 6
TIMP-1 binds to CD63 cell surface receptor. (A) Cell membrane and cytosolic fractions from the indicated cell lines were analyzed by immunoblotting using anti-TIMP-1 antibody. The cell-membrane receptor ITPRIPL1 and the cytosolic protein NF-kB-p65 were used as controls for the extraction procedure. (B) Confocal microscopic analysis of Cis-Pt-R cells co-stained with anti-TIMP-1 (green) and anti-CD63 (red) antibodies. Nuclei are visualized in blue. Magnification 63×, 1.0× digital zoom, scale bar = 10 μm. The merged image shows the overlay (yellow) of the two channels; white arrows indicate some points of colocalization between CD63 and TIMP-1. The representative section indicated by the dashed line was used for fluorescence intensity profiling analysis. Intensity peaks representing the red (CD63) and green (TIMP-1) emission wavelengths indicate areas of colocalization (black arrows). (C) MDA-MB-231 cells were transfected with si-CD63 or siRNA ctrl. Left: at 24 h post-transfection, cells were harvested, and cell lysates prepared and immunoblotted with anti-CD63 antibody. Anti-vinculin antibody was used as a loading control. Molecular weights of indicated proteins are reported. Middle: the histogram indicates the CD63/vinculin ratio of the densitometric signals. Values are shown relative to siRNA ctrl, arbitrarily set to 1. Bars depict means ± SD of three independent experiments. ** p < 0.01 relative to siRNA ctrl; unpaired t-test. Right: at 24 h post-transfection, cells were treated with 20 µM Cis-Pt alone or in combination with rTIMP-1. Cell viability was analyzed and expressed as percentage of viable treated cells compared to untreated cells. Bars depict means ± SD of three independent experiments. **** p < 0.0001, ### p < 0.001; ns, not significant; one-way ANOVA followed by Tukey’s multiple comparison test.
Figure 6
Figure 6
TIMP-1 binds to CD63 cell surface receptor. (A) Cell membrane and cytosolic fractions from the indicated cell lines were analyzed by immunoblotting using anti-TIMP-1 antibody. The cell-membrane receptor ITPRIPL1 and the cytosolic protein NF-kB-p65 were used as controls for the extraction procedure. (B) Confocal microscopic analysis of Cis-Pt-R cells co-stained with anti-TIMP-1 (green) and anti-CD63 (red) antibodies. Nuclei are visualized in blue. Magnification 63×, 1.0× digital zoom, scale bar = 10 μm. The merged image shows the overlay (yellow) of the two channels; white arrows indicate some points of colocalization between CD63 and TIMP-1. The representative section indicated by the dashed line was used for fluorescence intensity profiling analysis. Intensity peaks representing the red (CD63) and green (TIMP-1) emission wavelengths indicate areas of colocalization (black arrows). (C) MDA-MB-231 cells were transfected with si-CD63 or siRNA ctrl. Left: at 24 h post-transfection, cells were harvested, and cell lysates prepared and immunoblotted with anti-CD63 antibody. Anti-vinculin antibody was used as a loading control. Molecular weights of indicated proteins are reported. Middle: the histogram indicates the CD63/vinculin ratio of the densitometric signals. Values are shown relative to siRNA ctrl, arbitrarily set to 1. Bars depict means ± SD of three independent experiments. ** p < 0.01 relative to siRNA ctrl; unpaired t-test. Right: at 24 h post-transfection, cells were treated with 20 µM Cis-Pt alone or in combination with rTIMP-1. Cell viability was analyzed and expressed as percentage of viable treated cells compared to untreated cells. Bars depict means ± SD of three independent experiments. **** p < 0.0001, ### p < 0.001; ns, not significant; one-way ANOVA followed by Tukey’s multiple comparison test.

References

    1. Foulkes W.D., Smith I.E., Reis-Filho J.S. Triple-negative breast cancer. N. Engl. J. Med. 2010;363:1938–1948. doi: 10.1056/NEJMra1001389. - DOI - PubMed
    1. Derakhshan F., Reis-Filho J.S. Pathogenesis of Triple-Negative Breast Cancer. Annu. Rev. Pathol. 2022;17:181–204. doi: 10.1146/annurev-pathol-042420-093238. - DOI - PMC - PubMed
    1. Yin L., Duan J.J., Bian X.W., Yu S.C. Triple-negative breast cancer molecular subtyping and treatment progress. Breast Cancer Res. 2020;22:61. doi: 10.1186/s13058-020-01296-5. - DOI - PMC - PubMed
    1. Dent R., Trudeau M., Pritchard K.I., Hanna W.M., Kahn H.K., Sawka C.A., Lickley L.A., Rawlinson E., Sun P., Narod S.A. Triple-negative breast cancer: Clinical features and patterns of recurrence. Clin. Cancer Res. 2007;13:4429–4434. doi: 10.1158/1078-0432.CCR-06-3045. - DOI - PubMed
    1. Bianchini G., De Angelis C., Licata L., Gianni L. Treatment landscape of triple-negative breast cancer—Expanded options, evolving needs. Nat. Rev. Clin. Oncol. 2022;19:91–113. doi: 10.1038/s41571-021-00565-2. - DOI - PubMed

Publication types

MeSH terms