

Generalized Linear Models to Forecast Malaria Incidence in Three Endemic Regions of Senegal
- PMID: 37444150
- PMCID: PMC10341430
- DOI: 10.3390/ijerph20136303
Generalized Linear Models to Forecast Malaria Incidence in Three Endemic Regions of Senegal
Abstract
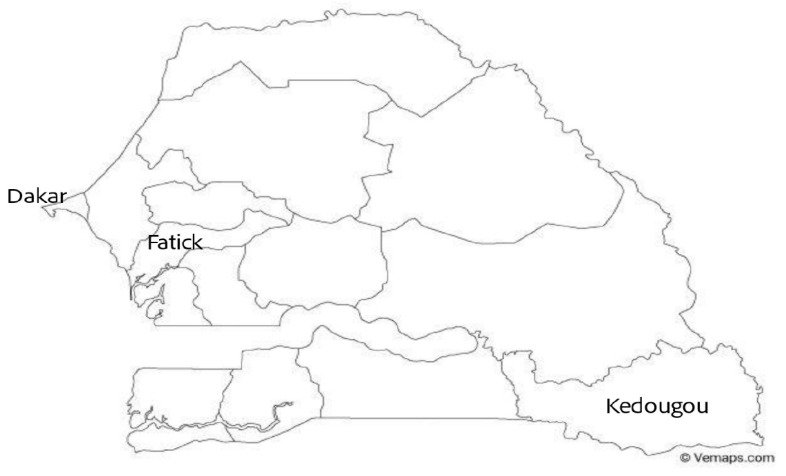
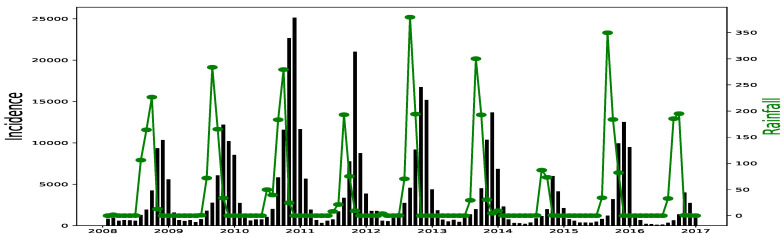
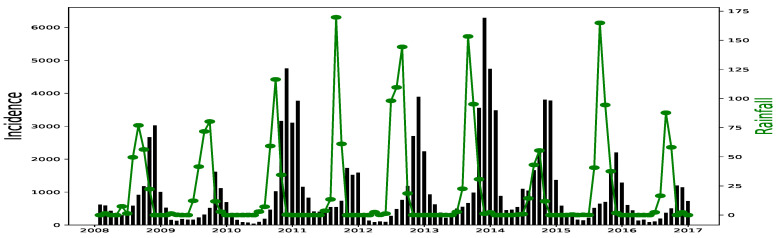
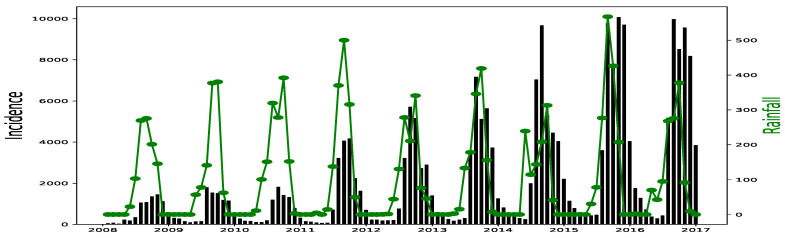
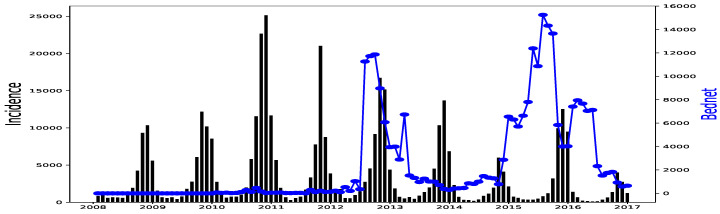
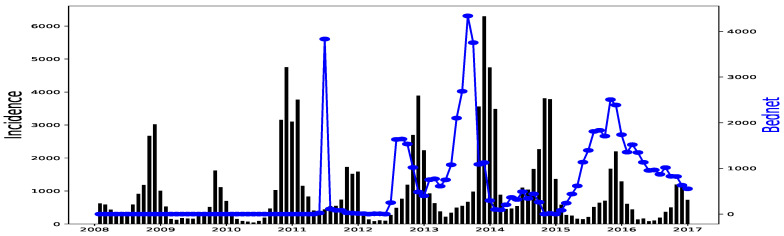
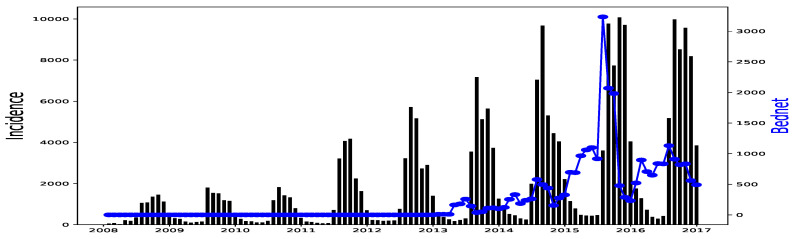
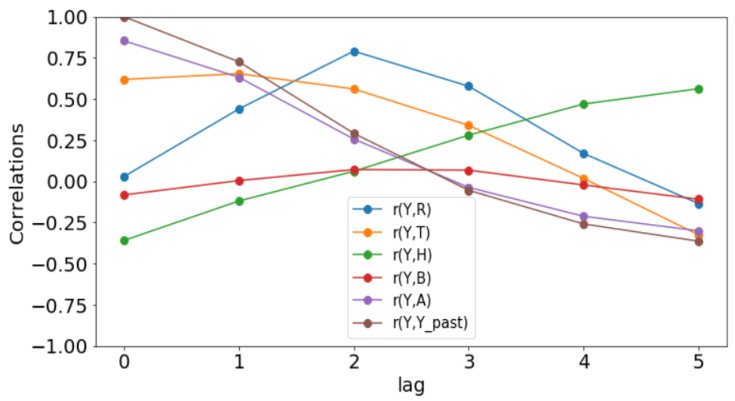
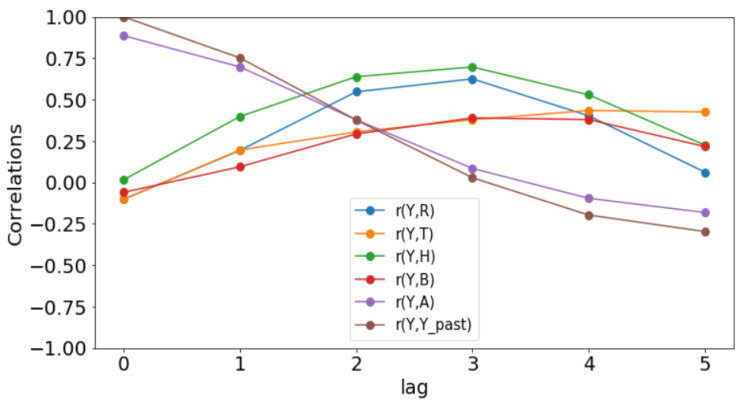
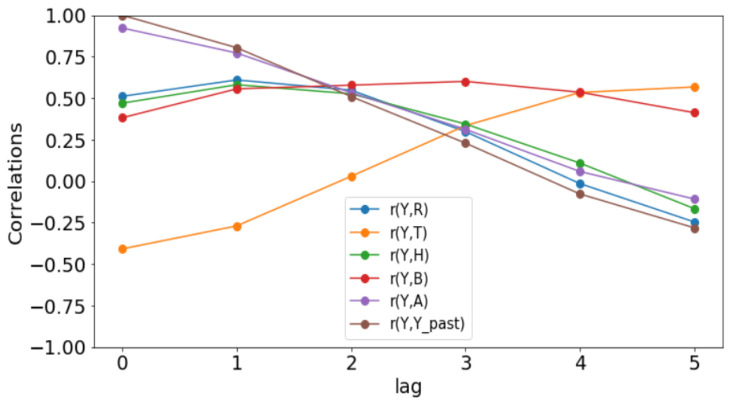
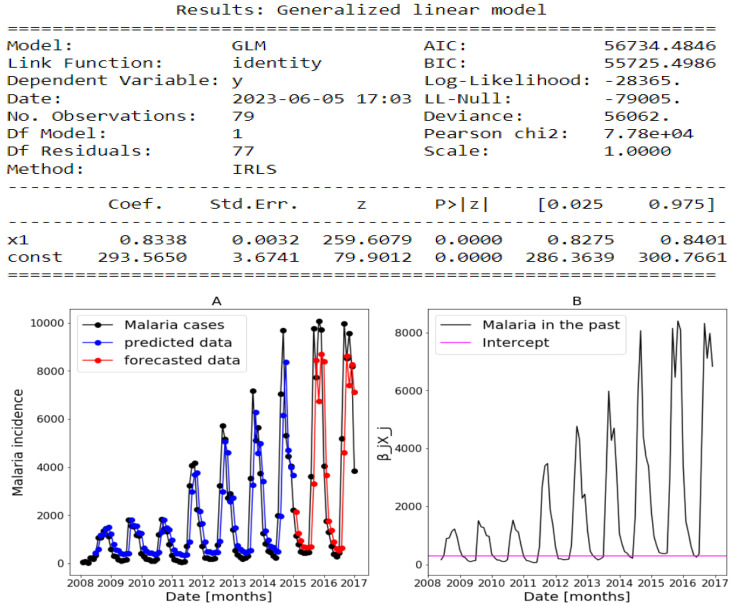
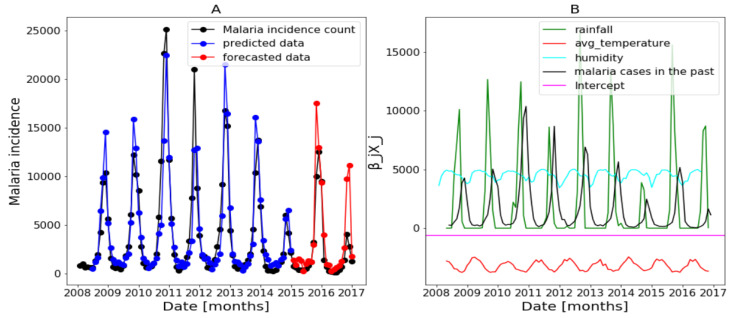
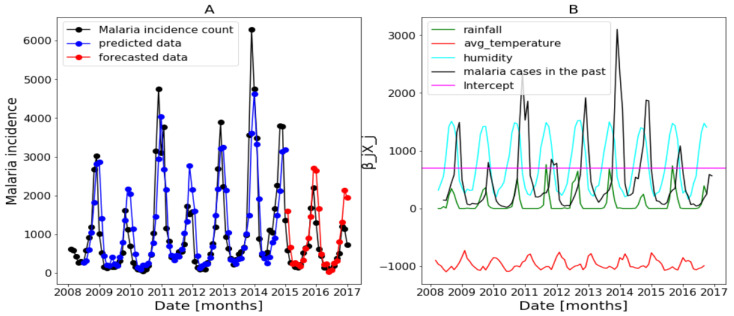
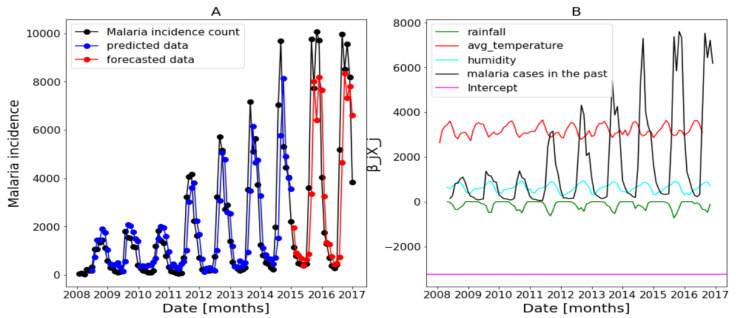
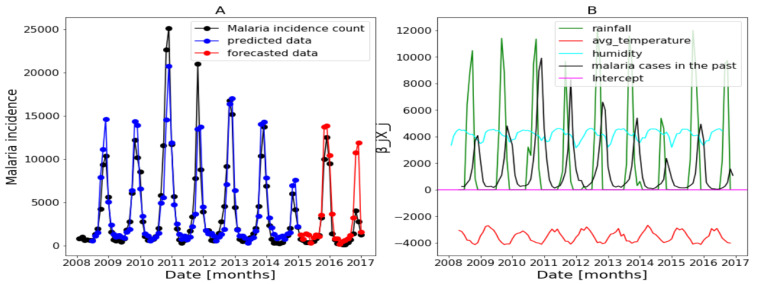
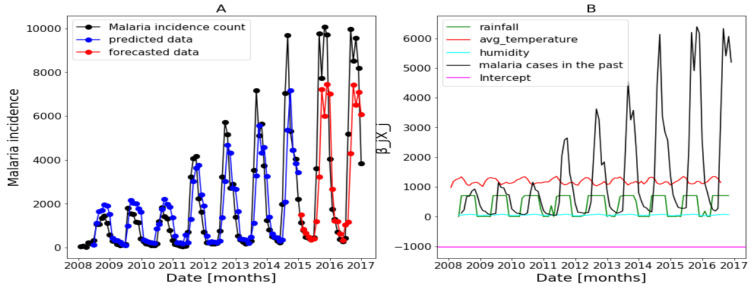
Affecting millions of individuals yearly, malaria is one of the most dangerous and deadly tropical diseases. It is a major global public health problem, with an alarming spread of parasite transmitted by mosquito (Anophele). Various studies have emerged that construct a mathematical and statistical model for malaria incidence forecasting. In this study, we formulate a generalized linear model based on Poisson and negative binomial regression models for forecasting malaria incidence, taking into account climatic variables (such as the monthly rainfall, average temperature, relative humidity), other predictor variables (the insecticide-treated bed-nets (ITNs) distribution and Artemisinin-based combination therapy (ACT)) and the history of malaria incidence in Dakar, Fatick and Kedougou, three different endemic regions of Senegal. A forecasting algorithm is developed by taking the meteorological explanatory variable Xj at time t-𝓁j, where t is the observation time and 𝓁j is the lag in Xj that maximizes its correlation with the malaria incidence. We saturated the rainfall in order to reduce over-forecasting. The results of this study show that the Poisson regression model is more adequate than the negative binomial regression model to forecast accurately the malaria incidence taking into account some explanatory variables. The application of the saturation where the over-forecasting was observed noticeably increases the quality of the forecasts.
Keywords: epidemiological data; forecasting; generalized linear models; meteorological data; parameters estimation.
Conflict of interest statement
The authors declare no conflict of interest. The funders had no role in the design of the study; in the collection, analyses, or interpretation of data; in the writing of the manuscript; or in the decision to publish the results.
Figures
Similar articles
-
Temporal correlation analysis between malaria and meteorological factors in Motuo County, Tibet.Malar J. 2011 Mar 4;10:54. doi: 10.1186/1475-2875-10-54. Malar J. 2011. PMID: 21375751 Free PMC article.
-
Impact of Climate Variability and Interventions on Malaria Incidence and Forecasting in Burkina Faso.Int J Environ Res Public Health. 2024 Nov 8;21(11):1487. doi: 10.3390/ijerph21111487. Int J Environ Res Public Health. 2024. PMID: 39595754 Free PMC article.
-
Development of temporal modelling for forecasting and prediction of malaria infections using time-series and ARIMAX analyses: a case study in endemic districts of Bhutan.Malar J. 2010 Sep 3;9:251. doi: 10.1186/1475-2875-9-251. Malar J. 2010. PMID: 20813066 Free PMC article.
-
[Time-series analysis on the malaria morbidity affected by meteorological factors in Guangdong province].Zhonghua Yu Fang Yi Xue Za Zhi. 2012 Oct;46(10):892-7. Zhonghua Yu Fang Yi Xue Za Zhi. 2012. PMID: 23363862 Chinese.
-
A scoping review of malaria forecasting: past work and future directions.BMJ Open. 2012 Nov 24;2(6):e001992. doi: 10.1136/bmjopen-2012-001992. Print 2012. BMJ Open. 2012. PMID: 23180505 Free PMC article.
Cited by
-
Spatio-temporal modelling and prediction of malaria incidence in Mozambique using climatic indicators from 2001 to 2018.Sci Rep. 2025 Apr 8;15(1):11971. doi: 10.1038/s41598-025-97072-6. Sci Rep. 2025. PMID: 40200072 Free PMC article.
-
Predicting malaria outbreak in The Gambia using machine learning techniques.PLoS One. 2024 May 16;19(5):e0299386. doi: 10.1371/journal.pone.0299386. eCollection 2024. PLoS One. 2024. PMID: 38753678 Free PMC article.
References
-
- Putri R.G., Jaharuddin., Bakhtiar T. SIRS-SI Model of Malaria Disease with Application of Vaccines, Anti-Malarial Drugs, and Spraying. IOSR J. Math. 2014;10:66–72. doi: 10.9790/5728-10526672. - DOI
-
- Cameron A.C., Trivedi P.K. Regression Analysis of Count Data-Second Edition. 2nd ed. Econometric Society Monographs, Cambridge University Press; Cambridge, UK: 2013. - DOI
-
- Lindsey J.K. Applying Generalized Linear Models. Springer; New York, NY, USA: 1997. Generalized Linear Modelling; pp. 1–26. - DOI
-
- McCullagh P., Nelder J.A. Generalized Linear Models. Routledge; London, UK: 1983.
-
- Lee S.C. Delta Boosting Implementation of Negative Binomial Regression in Actuarial Pricing. Risks. 2020;8:19. doi: 10.3390/risks8010019. - DOI
Publication types
MeSH terms
LinkOut - more resources
Full Text Sources
Medical
