

Shotgun Metagenomic Sequencing Revealed the Prebiotic Potential of a Fruit Juice Drink with Fermentable Fibres in Healthy Humans
- PMID: 37444219
- PMCID: PMC10340277
- DOI: 10.3390/foods12132480
Shotgun Metagenomic Sequencing Revealed the Prebiotic Potential of a Fruit Juice Drink with Fermentable Fibres in Healthy Humans
Abstract
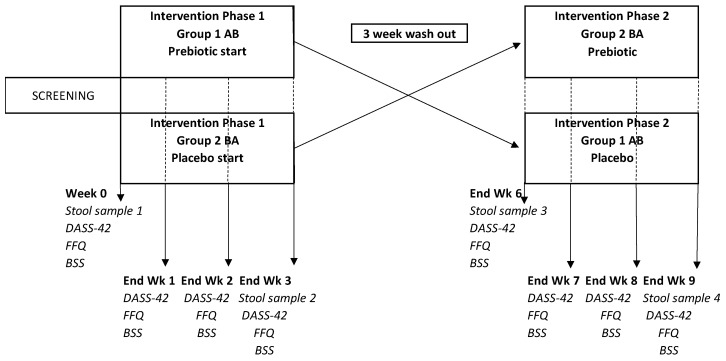
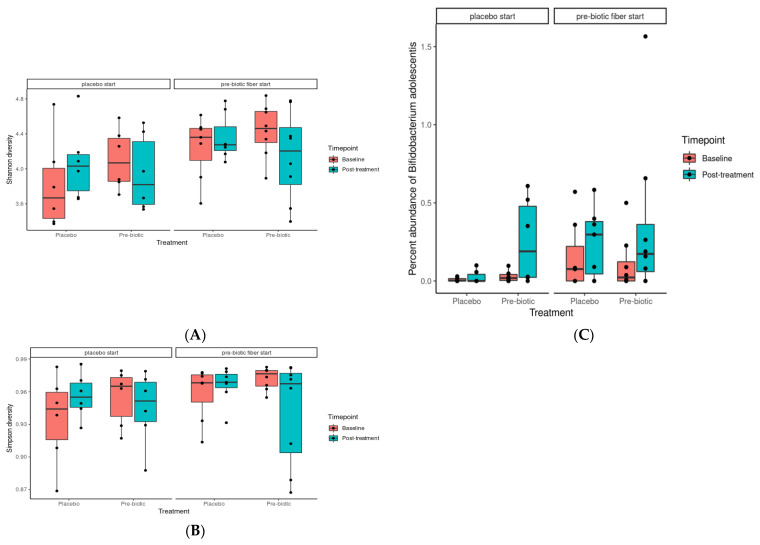
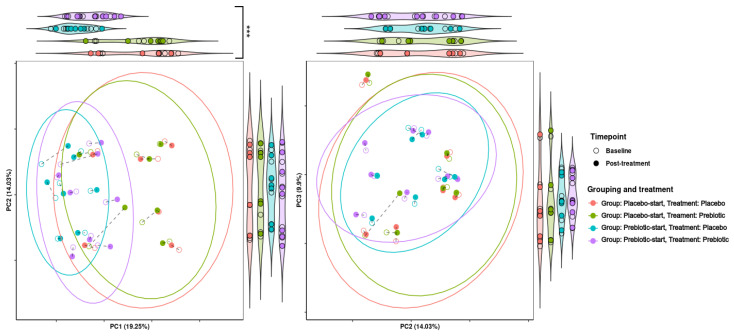
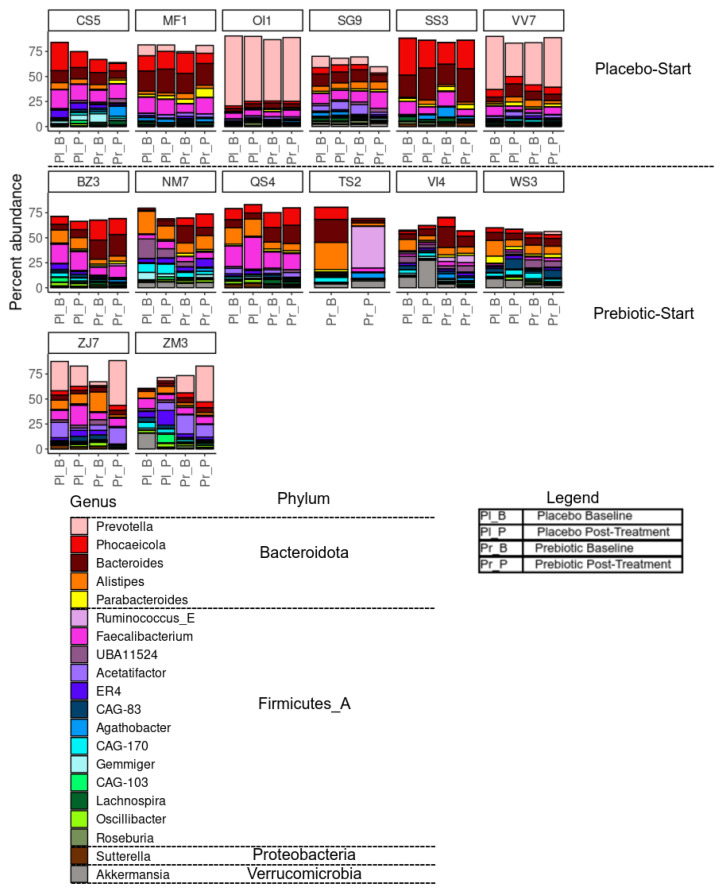
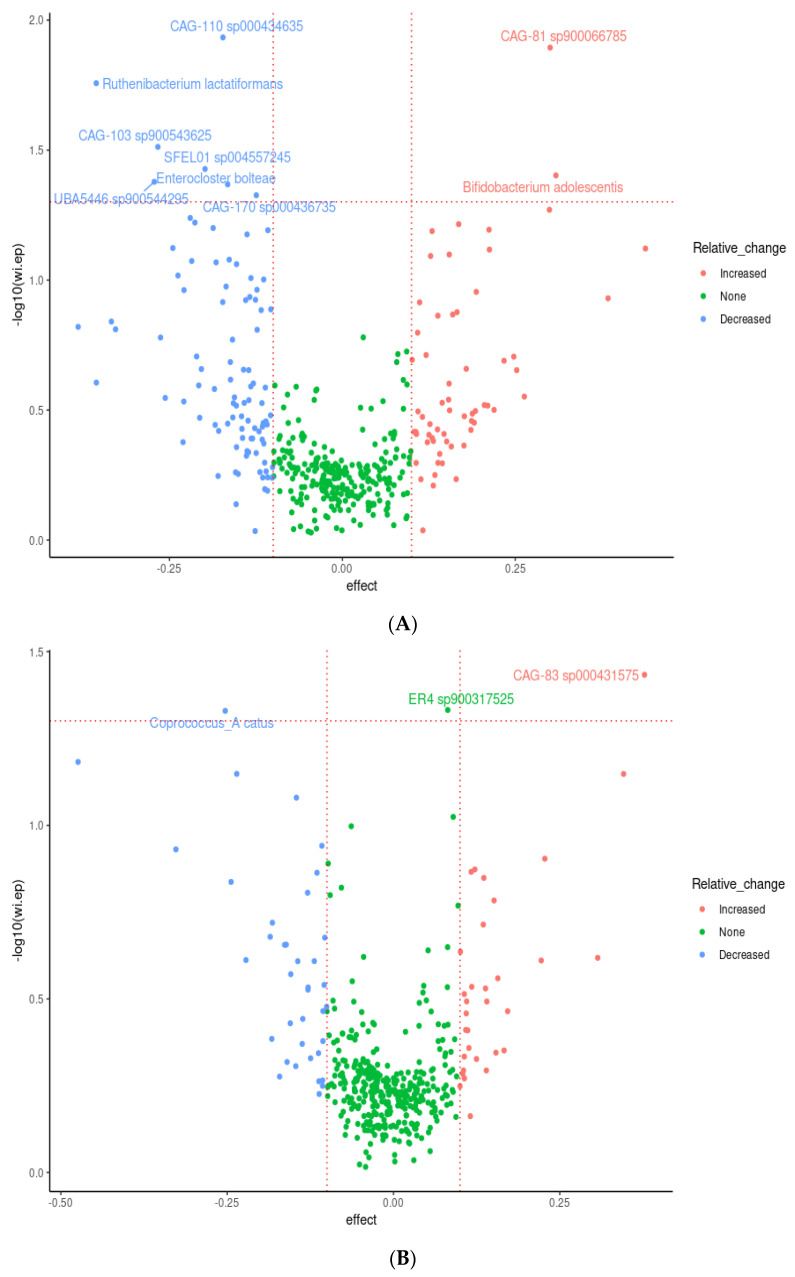
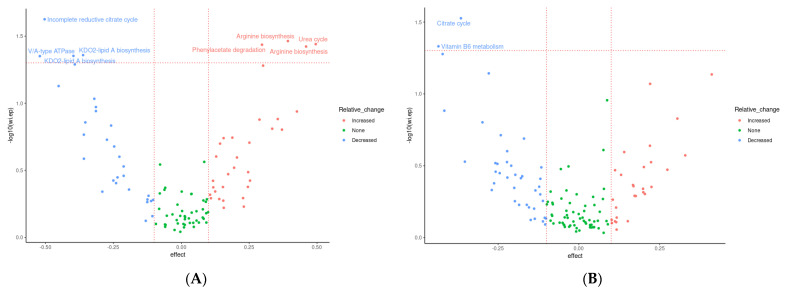
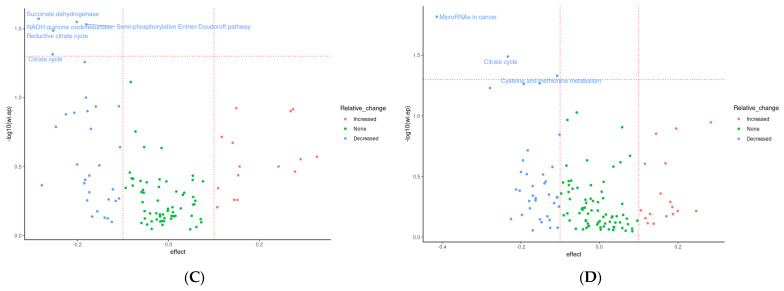
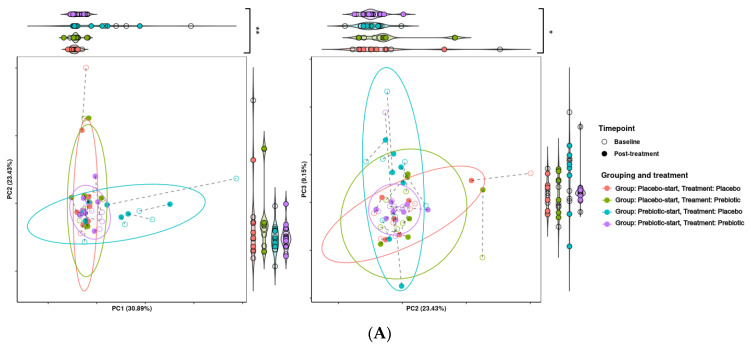
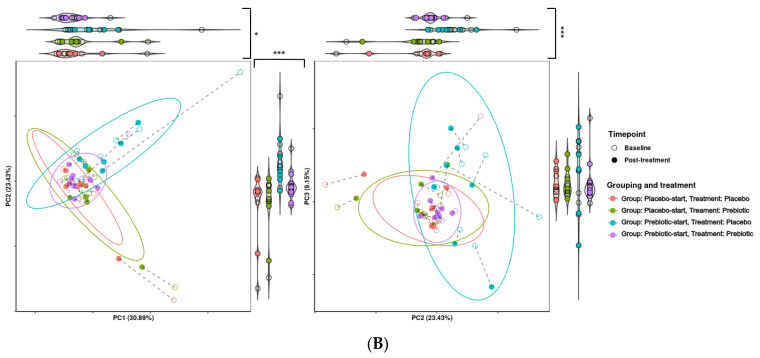
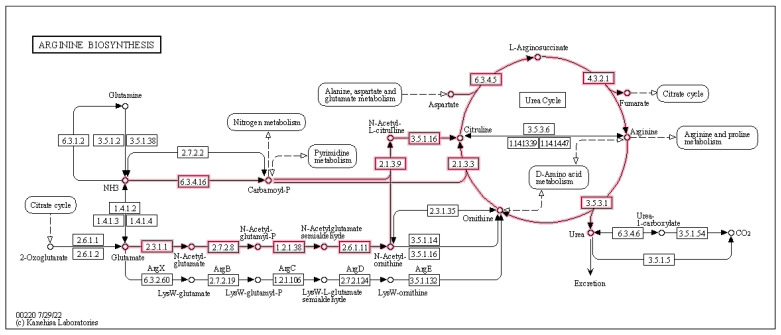
Fibre-based dietary interventions are at the forefront of gut microbiome modulation research, with a wealth of 16S rRNA information to demonstrate the prebiotic effects of isolated fibres. However, there is a distinct lack of data relating to the effect of a combination of soluble and insoluble fibres in a convenient-to-consume fruit juice food matrix on gut microbiota structure, diversity, and function. Here, we aimed to determine the impact of the MOJU Prebiotic Shot, an apple, lemon, ginger, and raspberry fruit juice drink blend containing chicory inulin, baobab, golden kiwi, and green banana powders, on gut microbiota structure and function. Healthy adults (n = 20) were included in a randomised, double-blind, placebo-controlled, cross-over study, receiving 60 mL MOJU Prebiotic Shot or placebo (without the fibre mix) for 3 weeks with a 3-week washout period between interventions. Shotgun metagenomics revealed significant between-group differences in alpha and beta diversity. In addition, the relative abundance of the phyla Actinobacteria and Desulfobacteria was significantly increased as a result of the prebiotic intervention. Nine species were observed to be differentially abundant (uncorrected p-value of <0.05) as a result of the prebiotic treatment. Of these, Bifidobacterium adolescentis and CAG-81 sp900066785 (Lachnospiraceae) were present at increased abundance relative to baseline. Additionally, KEGG analysis showed an increased abundance in pathways associated with arginine biosynthesis and phenylacetate degradation during the prebiotic treatment. Our results show the effects of the daily consumption of 60 mL MOJU Prebiotic Shot for 3 weeks and provide insight into the functional potential of B. adolescentis.
Keywords: Bifidobacterium adolescentis; Lachnospiraceae; arginine; fibre; gut microbiota; prebiotics; shotgun metagenomics.
Conflict of interest statement
A.B. and C.C. are employees of LAFIC, London South Bank University, which funded and managed the trial. P.D.C., M.O., and S.D. are employees of SeqBiome, Ireland, which was contracted by the LAFIC to carry out the gut microbiota shotgun metagenome analyses. We confirm that MOJU Ltd. had no role in the design of the study; in the collection, analyses, or interpretation of the data; in the writing of the manuscript; or in the decision to publish the results.
Figures
Similar articles
-
Habitual dietary fibre intake influences gut microbiota response to an inulin-type fructan prebiotic: a randomised, double-blind, placebo-controlled, cross-over, human intervention study.Br J Nutr. 2018 Jan;119(2):176-189. doi: 10.1017/S0007114517003440. Epub 2018 Jan 8. Br J Nutr. 2018. PMID: 29307330 Clinical Trial.
-
Prebiotic supplementation over a cold season and during antibiotic treatment specifically modulates the gut microbiota composition of 3-6 year-old children.Benef Microbes. 2019 Apr 19;10(3):253-263. doi: 10.3920/BM2018.0116. Epub 2019 Feb 19. Benef Microbes. 2019. PMID: 30776899 Clinical Trial.
-
Influence of habitual dietary fibre intake on the responsiveness of the gut microbiota to a prebiotic: protocol for a randomised, double-blind, placebo-controlled, cross-over, single-centre study.BMJ Open. 2016 Sep 2;6(9):e012504. doi: 10.1136/bmjopen-2016-012504. BMJ Open. 2016. PMID: 27591024 Free PMC article. Clinical Trial.
-
Effect of fructans, prebiotics and fibres on the human gut microbiome assessed by 16S rRNA-based approaches: a review.Benef Microbes. 2020 Mar 27;11(2):101-129. doi: 10.3920/BM2019.0082. Epub 2020 Feb 19. Benef Microbes. 2020. PMID: 32073295 Review.
-
Effect of resistant starch types as a prebiotic.Appl Microbiol Biotechnol. 2023 Feb;107(2-3):491-515. doi: 10.1007/s00253-022-12325-y. Epub 2022 Dec 13. Appl Microbiol Biotechnol. 2023. PMID: 36512032 Review.
Cited by
-
In Silico Predicting the Presence of the S100B Motif in Edible Plants and Detecting Its Immunoreactive Materials: Perspectives for Functional Foods, Dietary Supplements and Phytotherapies.Int J Mol Sci. 2024 Sep 11;25(18):9813. doi: 10.3390/ijms25189813. Int J Mol Sci. 2024. PMID: 39337302 Free PMC article.
-
Metagenomic analysis and proteins prediction of emerging pathogens in artisanal cheese.Mol Divers. 2025 Feb 6. doi: 10.1007/s11030-025-11116-7. Online ahead of print. Mol Divers. 2025. PMID: 39915364
-
Antibiotic Resistance Genes and Microbiota in Brassica oleracea var. acephala Cultivated in South Korea: Potential for Resistance Transmission.J Agric Food Chem. 2025 Jan 22;73(3):2156-2166. doi: 10.1021/acs.jafc.4c11161. Epub 2025 Jan 8. J Agric Food Chem. 2025. PMID: 39772525 Free PMC article.
-
Dietary Fiber and Cancer Management: A Twenty-Five-Year Bibliometric Review of Research Trends and Directions.Biomed Res Int. 2025 Apr 29;2025:5086946. doi: 10.1155/bmri/5086946. eCollection 2025. Biomed Res Int. 2025. PMID: 40330094 Free PMC article. Review.
References
Grants and funding
LinkOut - more resources
Full Text Sources
