. 2023 Jun 27;15(13):3369.
doi: 10.3390/cancers15133369.

AI-Based Glioma Grading for a Trustworthy Diagnosis: An Analytical Pipeline for Improved Reliability

Affiliations

AI-Based Glioma Grading for a Trustworthy Diagnosis: An Analytical Pipeline for Improved Reliability

Carla Pitarch et al. Cancers (Basel). .

Abstract

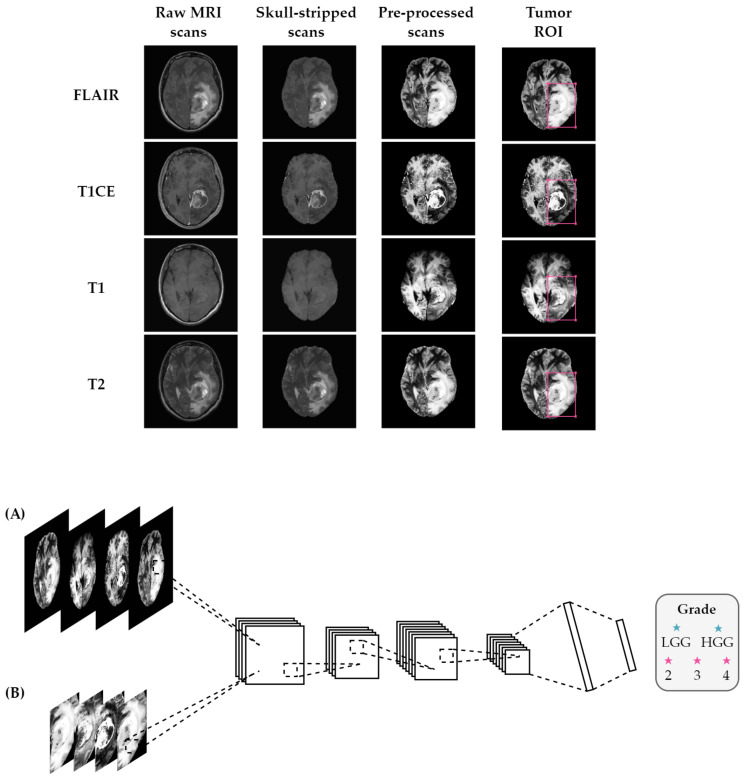
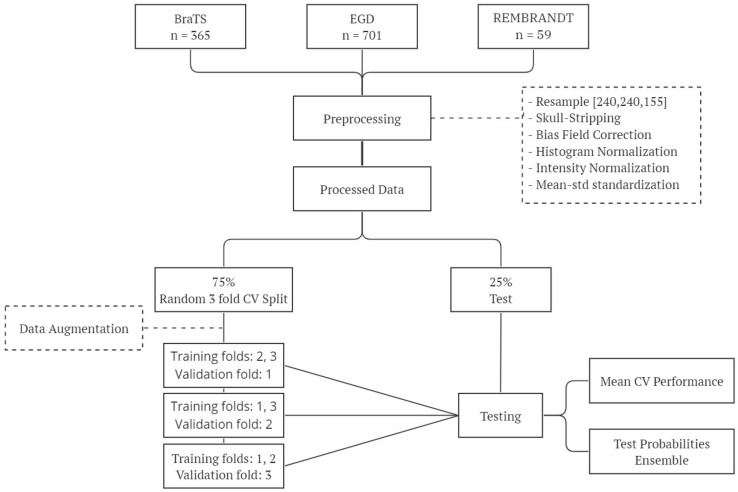
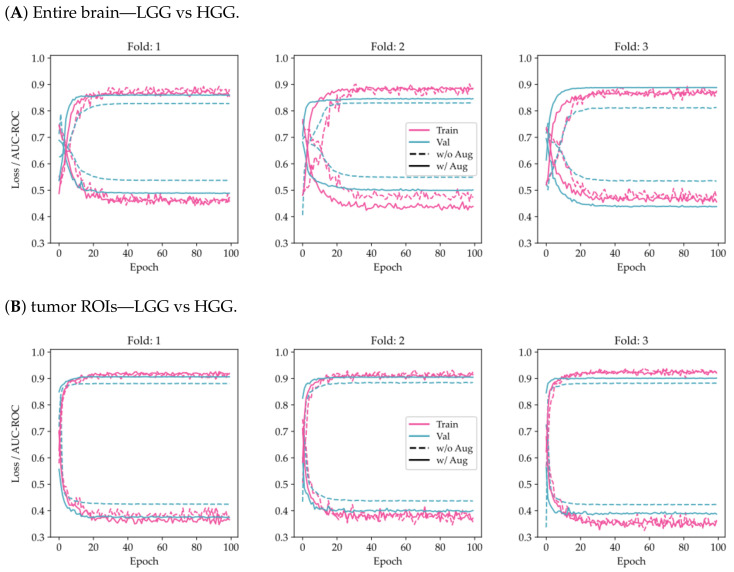
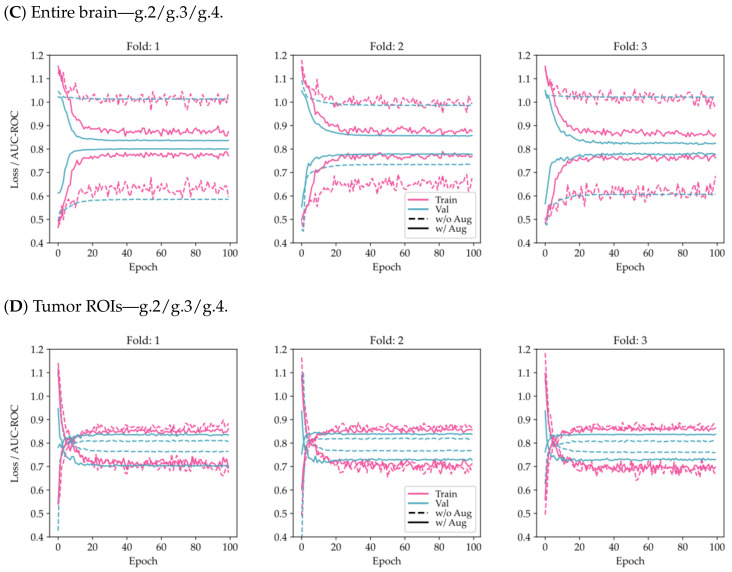
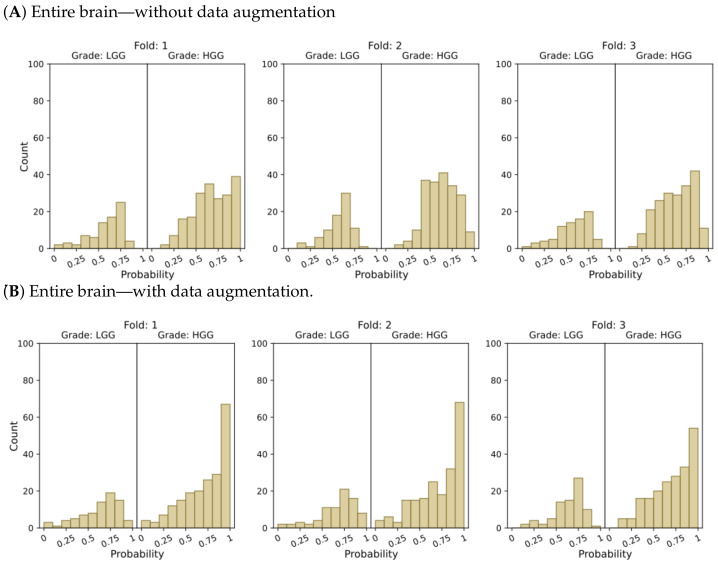
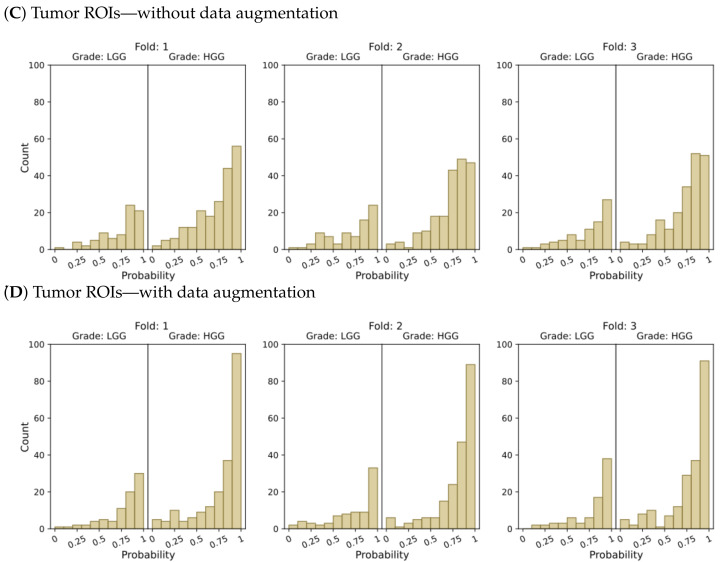
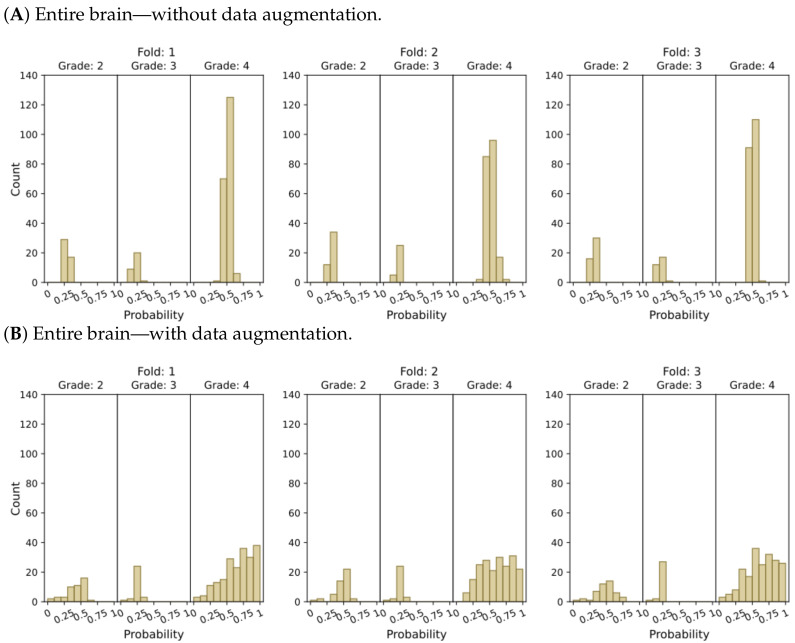
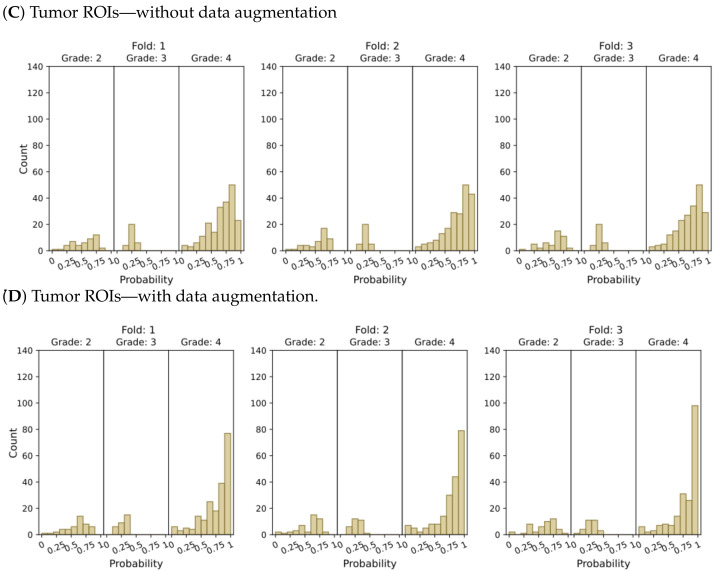
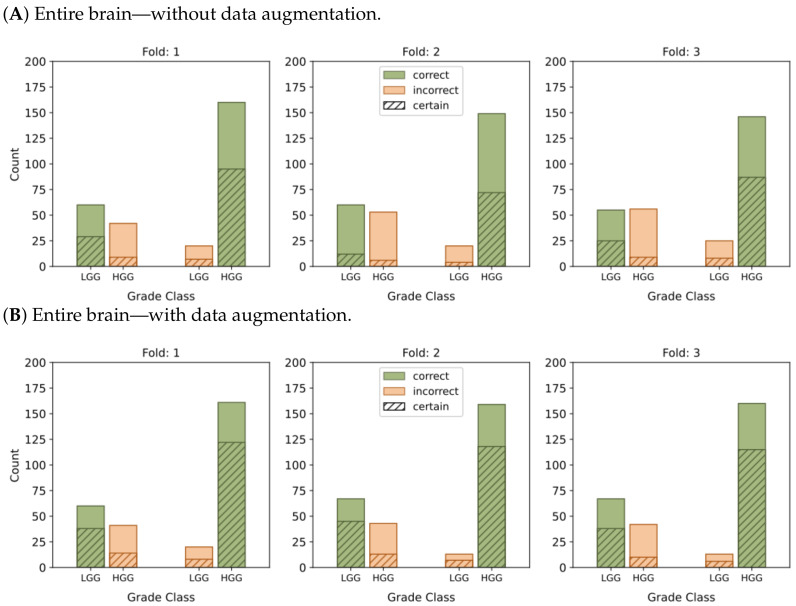
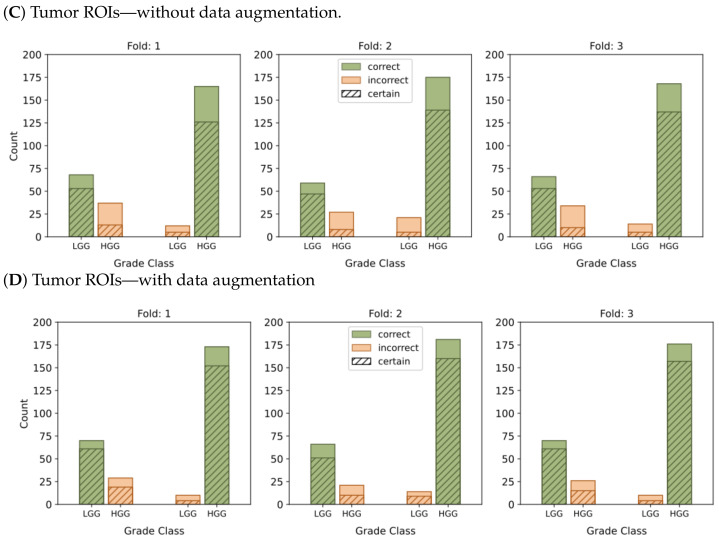
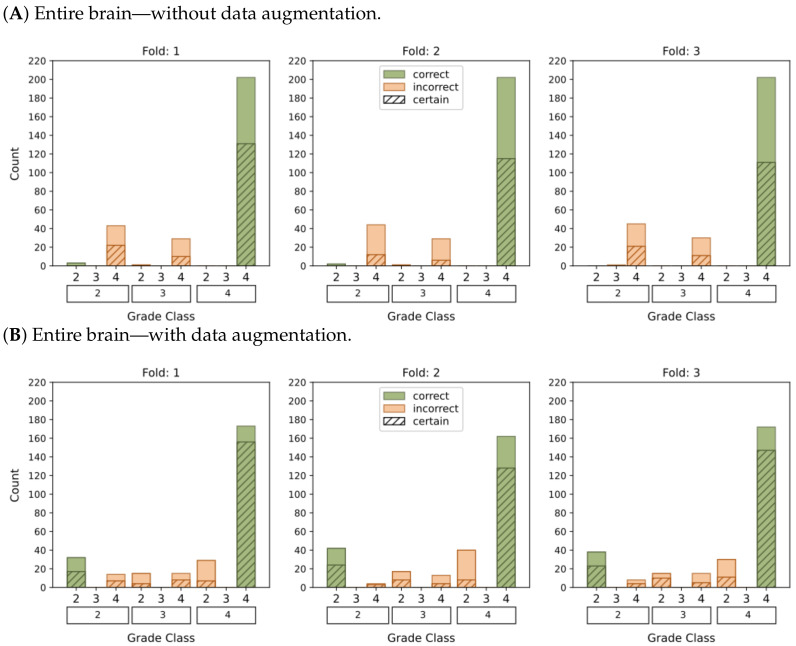
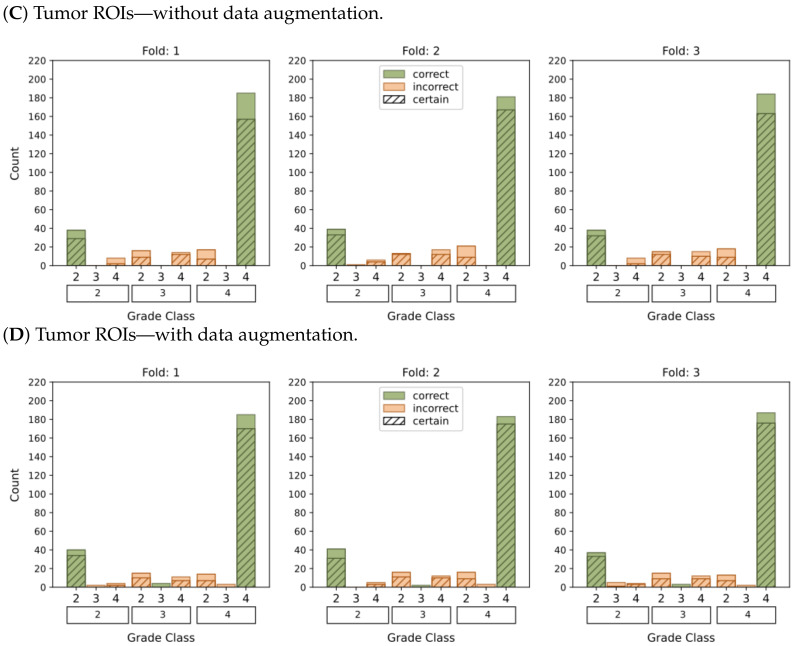
Glioma is the most common type of tumor in humans originating in the brain. According to the World Health Organization, gliomas can be graded on a four-stage scale, ranging from the most benign to the most malignant. The grading of these tumors from image information is a far from trivial task for radiologists and one in which they could be assisted by machine-learning-based decision support. However, the machine learning analytical pipeline is also fraught with perils stemming from different sources, such as inadvertent data leakage, adequacy of 2D image sampling, or classifier assessment biases. In this paper, we analyze a glioma database sourced from multiple datasets using a simple classifier, aiming to obtain a reliable tumor grading and, on the way, we provide a few guidelines to ensure such reliability. Our results reveal that by focusing on the tumor region of interest and using data augmentation techniques we significantly enhanced the accuracy and confidence in tumor classifications. Evaluation on an independent test set resulted in an AUC-ROC of 0.932 in the discrimination of low-grade gliomas from high-grade gliomas, and an AUC-ROC of 0.893 in the classification of grades 2, 3, and 4. The study also highlights the importance of providing, beyond generic classification performance, measures of how reliable and trustworthy the model's output is, thus assessing the model's certainty and robustness.

Keywords: decision support; glioma; machine learning; model certainty; model robustness; neuro-oncology; radiology; reliability; trustworthiness; tumor grading.


Conflict of interest statement

The authors declare no conflict of interest.

Figures

Figure 1
Figure 1
Overview of the proposed method using (A) entire brain images and (B) tumor ROI. Before feeding the MRI scans into the classifier, the pipeline consisted of several pre-processing steps, including registration to a common atlas, skull-stripping, bias field correction, and normalization. The classifier takes FLAIR, T1 with contrast-enhancement, T1, and T2 scans stacked as input channels for the classification task.
Figure 2
Figure 2
Overview of the experimental workflow: this diagram outlines the key steps involved in our experimental methodology, including data preparation, training, and testing.
Figure 3
Figure 3
Comparison of training and validation loss and AUC-ROC history using the proposed model on a 3-fold CV for the two-class problem (LGG/HGG) and the multi-class problem (g.2/g.3/g.4). The results are shown for two different scenarios: (A,C) considering the entire brain, and (B,D) considering tumor ROIs.
Figure 3
Figure 3
Comparison of training and validation loss and AUC-ROC history using the proposed model on a 3-fold CV for the two-class problem (LGG/HGG) and the multi-class problem (g.2/g.3/g.4). The results are shown for two different scenarios: (A,C) considering the entire brain, and (B,D) considering tumor ROIs.
Figure 4
Figure 4
Probability distributions of model predictions for LGG and HGG classification, using (A) the entire brain without data augmentation, (B) the entire brain with data augmentation, (C) tumor ROIs without data augmentation, and (D) tumor ROIs with data augmentation.
Figure 4
Figure 4
Probability distributions of model predictions for LGG and HGG classification, using (A) the entire brain without data augmentation, (B) the entire brain with data augmentation, (C) tumor ROIs without data augmentation, and (D) tumor ROIs with data augmentation.
Figure 5
Figure 5
Model’s output probability distributions for WHO glioma grade classification (g.2, g.3, g.4), using (A) the entire brain without data augmentation, (B) the entire brain with data augmentation, (C) tumor ROIs without data augmentation, and (D) tumor ROIs with data augmentation.
Figure 5
Figure 5
Model’s output probability distributions for WHO glioma grade classification (g.2, g.3, g.4), using (A) the entire brain without data augmentation, (B) the entire brain with data augmentation, (C) tumor ROIs without data augmentation, and (D) tumor ROIs with data augmentation.
Figure 6
Figure 6
This graphic represents the categorization of model predictions into certain (probability ≥ 0.7) and uncertain (probability < 0.7), as well as the accuracy of each of the four models, namely (AD), in classifying LGG and HGG samples. Correct classifications are shown in green while incorrect classifications are shown in orange.
Figure 6
Figure 6
This graphic represents the categorization of model predictions into certain (probability ≥ 0.7) and uncertain (probability < 0.7), as well as the accuracy of each of the four models, namely (AD), in classifying LGG and HGG samples. Correct classifications are shown in green while incorrect classifications are shown in orange.
Figure 7
Figure 7
This graphic represents the categorization of model predictions into certain (probability ≥ 0.5) and uncertain (probability < 0.5), as well as the accuracy of each of the four models (AD) in classifying glioma grades in WHO categories (g.2, g.3, g.4). Correct classifications are shown in green whereas incorrect classifications are shown in orange.
Figure 7
Figure 7
This graphic represents the categorization of model predictions into certain (probability ≥ 0.5) and uncertain (probability < 0.5), as well as the accuracy of each of the four models (AD) in classifying glioma grades in WHO categories (g.2, g.3, g.4). Correct classifications are shown in green whereas incorrect classifications are shown in orange.

References

    1. Salehiniya H., Farmanfarma K.K. Brain cancer in the world: An epidemiological review. World Cancer Res. J. 2019;6:e1356. doi: 10.32113/wcrj_20197_1356. - DOI
    1. Global Cancer Observatory. [(accessed on 18 April 2023)]. Available online: https://gco.iarc.fr/
    1. Brain Tumours|Cancer Research, UK. [(accessed on 18 April 2023)]. Available online: https://www.cancerresearchuk.org/about-cancer/brain-tumours.
    1. Risk Factors for Brain and Spinal Cord Tumors. [(accessed on 18 April 2023)]. Available online: https://www.cancer.org/cancer/brain-spinal-cord-tumors-adults/causes-ris....
    1. Louis D.N., Perry A., Reifenberger G., von Deimling A., Figarella-Branger D., Cavenee W.K., Ohgaki H., Wiestler O.D., Kleihues P., Ellison D.W. The 2016 World Health Organization Classification of Tumors of the Central Nervous System: A summary. Acta Neuropathol. 2016;131:803–820. doi: 10.1007/s00401-016-1545-1. - DOI - PubMed

LinkOut - more resources