. 2023 Jun 27;15(13):3370.
doi: 10.3390/cancers15133370.

CTHRC1 Induces Pancreatic Stellate Cells (PSCs) into Myofibroblast-like Cancer-Associated Fibroblasts (myCAFs)

Affiliations

CTHRC1 Induces Pancreatic Stellate Cells (PSCs) into Myofibroblast-like Cancer-Associated Fibroblasts (myCAFs)

Min Kyung Kang et al. Cancers (Basel). .

Abstract

[BACKGROUND] Collagen triple helix repeat containing-1 (CTHRC1) is a secreted protein that contributes to the progression of various cancers, including pancreatic cancer. The higher expression of CTHRC1 in tumor tissues is associated with poorer survival outcomes. However, its specific roles in tumor extracellular matrix (ECM) remodeling remain unclear. Our study aims to investigate the influences of CTHRC1 on pancreatic stellate cells (PSCs), a main source of ECM production in pancreatic cancer. [METHODS AND RESULTS] The analyses of the publicly available pancreatic cancer patient data revealed that CTHRC1 is mainly expressed in cancer stroma and highly correlated with ECM-related genes. An in vitro study showed that more than 40% of these genes can be upregulated by CTHRC1. CTHRC1 specifically activated PSC into myofibroblast-like cancer-associated fibroblasts (myCAFs), which are characterized by a significantly upregulated POSTN gene expression. Periostin (coded by the POSTN gene) has a central role in the CTHRC1-PSCs-cancer metastasis axis. Furthermore, CTHRC1 promoted pancreatic cancer cell proliferation through PSC activation to a greater extent than via direct stimulation. Proof-of-concept experiments showed that the long-term (4-week) inhibition of CTHRC1 led to significant tumor suppression and ECM reduction, and also resulted in an unexpected shift in the CAF subtype from myCAFs to inflammatory CAFs (iCAFs). [CONCLUSION] PSC activation was demonstrated to be the key molecular mechanism responsible for the tumor-promoting effects of CTHRC1, and CTHRC1 has a critical role in CAF subtype differentiation and tumor microenvironment (TME) remodeling. The inhibition of CTHRC1 as a therapeutic strategy for the treatment of pancreatic cancer warrants further investigation.

Keywords: CTHRC1; cancer-associated fibroblast; cell differentiation; extracellular matrix; microenvironment myofibroblast; neoplasm metastasis; pancreatic cancer; pancreatic stellate cell; periostin.


Conflict of interest statement

S.S.K. and M.K.K. are among the patent inventors of the anti-CTHRC1 antibody used in this study. The other authors declare no conflicts of interest. The funder had no role in the design of the study; in the collection, analyses, or interpretation of data; in the writing of the manuscript; or in the decision to publish the result.

Figures

Figure 1
Figure 1
CTHRC1 is mainly expressed in pancreatic tumor stroma and a higher expression predicts poorer survival. CTHRC1 expression comparison based on datasets retrieved from the Gene Expression Omnibus (GEO) (A) in pancreatic tumor vs. paired adjacent normal tissue, and (B) in tumor stroma vs. cancer (epithelium) cells. (C) Expression of CTHRC1 in cancer cell lines and PSCs. Data were obtained from the current study, which measured CTHRC1 concentration, as well as from the CCLE database, which reported CTHRC1 mRNA expression levels. (D) CTHRC1 gene expression in different subsets of cells isolated from treatment-naïve pancreatic tumor tissue, determined by single-nucleus RNA-seq, retrieved from the Single-Cell Portal. (E) Survival analyses based on the CTHRC1 gene expression of tumor samples in pancreatic cancer patients from the TCGA (n = 177) and CPTAC (n = 91) programs. The low and high expression of CTHRC1 were divided when the highest statistical difference was reached. p-values: ** and **** indicate p < 0.05 and 0.0001, respectively.
Figure 2
Figure 2
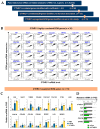
CTHRC1 regulated a considerable portion of extracellular matrix (ECM) genes. (A) The process of identification of ECM genes upregulated by CTHRC1. Based on the mRNA expression of pancreatic cancer tissue samples (n = 183) obtained from the TCGA PanCancer Atlas, 20,530 genes were screened for correlation with CTHRC1, and 58 genes showed a high correlation with CTHRC1 (r > 0.8). Among these 58 genes, (B) 35 were ECM-related genes. (C) In vitro, pancreatic stellate cells (PSCs; in this study, it refers to immortalized PSC hPSC21-S/T) were treated with PBS, TGF-β (2.1 nM), or CTHRC1 (1.7 nM) for 24 h, and 15 of the 35 ECM-related genes showed significant upregulation by the CTHRC1 treatment. (D) Relative mRNA expression of five of the most CTHRC1-upregulated genes in PSCs after inhibition by siCTHRC1 vs. siCon (control). p-values: *, **, *** and **** indicate p < 0.05, 0.01, 0.001 and 0.0001, respectively.
Figure 3
Figure 3
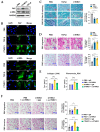
CTHRC1 activated pancreatic stellate cells (PSCs) in vitro. Activation of PSC after treatment with PBS, CTHRC1 (1.7 nM), or TGF-β (2.1 nM) for 24 h demonstrated by the protein expression of FAP and α-SMA in PSCs using (A) Western blot and (B) immunofluorescence (IF) assay, by (C) quantification of lipid droplets in PSC cytoplasm using Oil Red O staining (decreased optical density (O.D.) of lipid droplets indicates PSC activation), and by (D) metastatic capacity of PSCs using migration/invasion assays. To confirm the activating effects of CTHRC1 on PSCs, PSCs were treated with PBS, CTHRC1 (1.7 nM), and/or α-CTHRC1 (anti-CTHRC1 mAb, 69.4 nM) for 24 h, (E) concentrations of collagen I and fibronectin were measured using indirect ELISA, and (F) metastatic capacity of PSCs was determined using migration/invasion assays. p-values: *, **, *** and **** indicate p < 0.05, 0.01, 0.001 and 0.0001, respectively.
Figure 4
Figure 4
CTHRC1 differentiated pancreatic stellate cells (PSCs) into myofibroblast-like cancer-associated fibroblasts (myCAFs) in vitro. (A) Clustering of the mRNA expression of marker genes of myCAFs (ACTA2, TAGLN, THY1, and POSTN), inflammatory iCAFs (CLEC3B, COL14A1, and IL6), and antigen-presenting apCAFs (CD74 and SLPI) in pancreatic cancer tissue samples (n = 183) obtained from the TCGA PanCancer Atlas. Relative mRNA expression of CAF marker genes in PSCs (B) after treatment with PBS or CTHRC1 (1.7 nM) and (C) after treatment with CTHRC1 + IgG or CTHRC1 + α-CTHRC1 (anti-CTHRC1 mAb, 69.4 nM). (D) Relative mRNA expression of growth factors and cytokines in PSCs after treatment with PBS or CTHRC1. p-values: *, **, *** and **** indicate p < 0.05, 0.01, 0.001 and 0.0001, respectively.
Figure 5
Figure 5
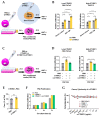
CTHRC1 promoted pancreatic cancer proliferation via pancreatic stellate cell (PSC) activation more than via direct stimulation. Design of the 1st cancer proliferation experiment shown in (A) cancer cells treated directly by PBS or CTHRC1 (1.7 nM) for 48 h, or by conditioned media (CM) harvested from the supernatant of PSCs cultured with PBS or CTHRC1 (1.7 nM) for 48 h, and (B) cancer proliferation measured in CTHRC1-low-expressing MIA PaCa-2 vs. CTHRC1-high-expressing BxPC-3 cells after PSC CM treatment vs. direct culture. Design of 2nd cancer proliferation experiment shown in (C) cancer cells treated with CM harvested from the supernatant of PSC cultured with PBS, or CTHRC1 (1.7 nM) with or without α-CTHRC1 (anti-CTHRC1 mAb, 69.4 nM) for 48 h. (D) Cancer proliferation measured in CTHRC1-low-expressing MIA PaCa-2 vs. CTHRC1-high-expressing BxPC-3 cells, following treatment with CTHRC1 PSC CM. (E) CTHRC1 concentrations measured in PSC supernatant harvested with or without treatment with CTHRC1 (1.7 nM) for 24 h. (F) The influence of CTHRC1 and CTHRC1 + α-CTHRC1 on 24 and 72 h PSC proliferation. (G) Cytotoxicity of CTHRC1 (0–20 μg/mL) in pancreatic cancer cell lines. p-values: *, **, *** and **** indicate p < 0.05, 0.01, 0.001 and 0.0001, respectively.
Figure 6
Figure 6
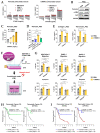
Periostin (coded by the POSTN gene), a molecule that interacts with CTHRC1 specifically via pancreatic stellate cells (PSCs), not pancreatic cancer cells, had an essential role in the CTHRC1–PSC–cancer metastasis axis. (A) Concentrations of periostin and CTHRC1 in the pancreatic cancer cell supernatant after treatment with CTHRC1 and periostin (0, 10, 100, and 1000 ng/mL), respectively, for 24 h. (B) Protein expression of periostin in PSCs after treatment with PBS or CTHRC1 (1.7 nM) for 24 h. Concentration of periostin in PSCs (C) after treatment with 0, 10, 100, and 1000 ng/mL of CTHRC1, and (D) after treatment with PBS/CTHRC1 (1.7 nM) + IgG vs. PBS/CTHRC1 + α-CTHRC1 (anti-CTHRC1 mAb, 69.4 nM). (E) Concentrations of collagen I and fibronectin in PSCs with POSTN-knockout (PSC_POSTNKO) after treatment with PBS or CTHRC1 (1.7 nM) for 24 h. (F) Diagrams of experiments designed to investigate the influences of the POSTN-knockout of PSCs (PSC-POSTNKO) on pancreatic cancer migration/invasion. (G) Migration and invasion of pancreatic cancer cells compared 24 h after adding conditioned media (CM), harvested from CTHRC1-MB (magnetic beads)-treated or BSA-MB-treated PSC_sgNTC or PSC_POSTNKO. CTHRC1 removed from CM using a magnetic stand to exclude CTHRC1 interference. In pancreatic cancer patients from the TCGA (n = 177) and CPTAC (n = 91) programs, the overall survival (OS) data were compared between the (H) low and high tumor mRNA expression of POSTN, and the (I) low and high mRNA expression of POSTN2 × CTHRC1. The low and high expression groups of POSTN and CTHRC1 were divided when the highest statistical difference was reached. p-values: *, **, *** and **** indicate p < 0.05, 0.01, 0.001 and 0.0001, respectively.
Figure 7
Figure 7
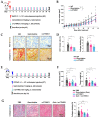
Anti-CTHRC1 antibody inhibited tumor growth and extracellular matrix (ECM) formation in vivo. (A) Diagram of experiment design in BxPC-3 subcutaneous model. (B) Tumor volume measured from day 0 to 45 in each animal group treated with PBS, gemcitabine, or α-CTHRC1 (anti-CTHRC1 mAb). (C) Representative images of the immunohistochemical staining of Ki67 and Sirius red staining of collagen in BxPC-3 tumor tissue and (D) quantification of Ki67-positive tumor cells and collagen staining. (E) Diagram of experiment design in CFPAC-1 orthotopic model. (F) Tumor volume and tumor weight of harvested CFPAC-1 tumors. (G) Representative images and quantification of Masson’s Trichrome staining of collagen in CFPAC-1 tumor tissues. p-values: *, **, *** and **** indicate p < 0.05, 0.01, 0.001 and 0.0001, respectively.
Figure 8
Figure 8
Long-term (4-week) anti-CTHRC1 treatment differentiated myofibroblast-like cancer-associated fibroblasts (myCAFs) into inflammatory iCAFs in the CFPAC-1 orthotopic mouse model. (A) Relative mRNA level of CAF marker genes in tumor tissue samples harvested from CFPAC-1 orthotopic mouse model, and (B) mRNA levels of pro-tumoral factors in CFPAC-1 tumor tissue detected using both human and mouse primers, compared between PBS vs. α-CTHRC1 (anti-CTHRC1 monoclonal antibody) treatment groups. p-values: *, *** and **** indicate p < 0.05, 0.001 and 0.0001, respectively. Solid circles●: PBS treatment, solid triangle▲: α-CTHRC1 treatment.

References

    1. Wood L.D., Canto M.I., Jaffee E.M., Simeone D.M. Pancreatic Cancer: Pathogenesis, Screening, Diagnosis, and Treatment. Gastroenterology. 2022;163:386–402.e1. doi: 10.1053/j.gastro.2022.03.056. - DOI - PMC - PubMed
    1. Apte M.V., Park S., Phillips P.A., Santucci N., Goldstein D., Kumar R.K., Ramm G.A., Buchler M., Friess H., McCarroll J.A., et al. Desmoplastic reaction in pancreatic cancer: Role of pancreatic stellate cells. Pancreas. 2004;29:179–187. doi: 10.1097/00006676-200410000-00002. - DOI - PubMed
    1. Miyai Y., Esaki N., Takahashi M., Enomoto A. Cancer-associated fibroblasts that restrain cancer progression: Hypotheses and perspectives. Cancer Sci. 2020;111:1047–1057. doi: 10.1111/cas.14346. - DOI - PMC - PubMed
    1. Zhang Z., Zhang H., Liu T., Chen T., Wang D., Tang D. Heterogeneous Pancreatic Stellate Cells Are Powerful Contributors to the Malignant Progression of Pancreatic Cancer. Front. Cell Dev. Biol. 2021;9:783617. doi: 10.3389/fcell.2021.783617. - DOI - PMC - PubMed
    1. Pyagay P., Heroult M., Wang Q., Lehnert W., Belden J., Liaw L., Friesel R.E., Lindner V. Collagen triple helix repeat containing 1, a novel secreted protein in injured and diseased arteries, inhibits collagen expression and promotes cell migration. Circ. Res. 2005;96:261–268. doi: 10.1161/01.RES.0000154262.07264.12. - DOI - PubMed

LinkOut - more resources