. 2023 Jun 27;15(13):3379.
doi: 10.3390/cancers15133379.

The Tumor Suppressor DAB2IP Is Regulated by Cell Contact and Contributes to YAP/TAZ Inhibition in Confluent Cells

Affiliations

The Tumor Suppressor DAB2IP Is Regulated by Cell Contact and Contributes to YAP/TAZ Inhibition in Confluent Cells

Mattia Apollonio et al. Cancers (Basel). .

Abstract

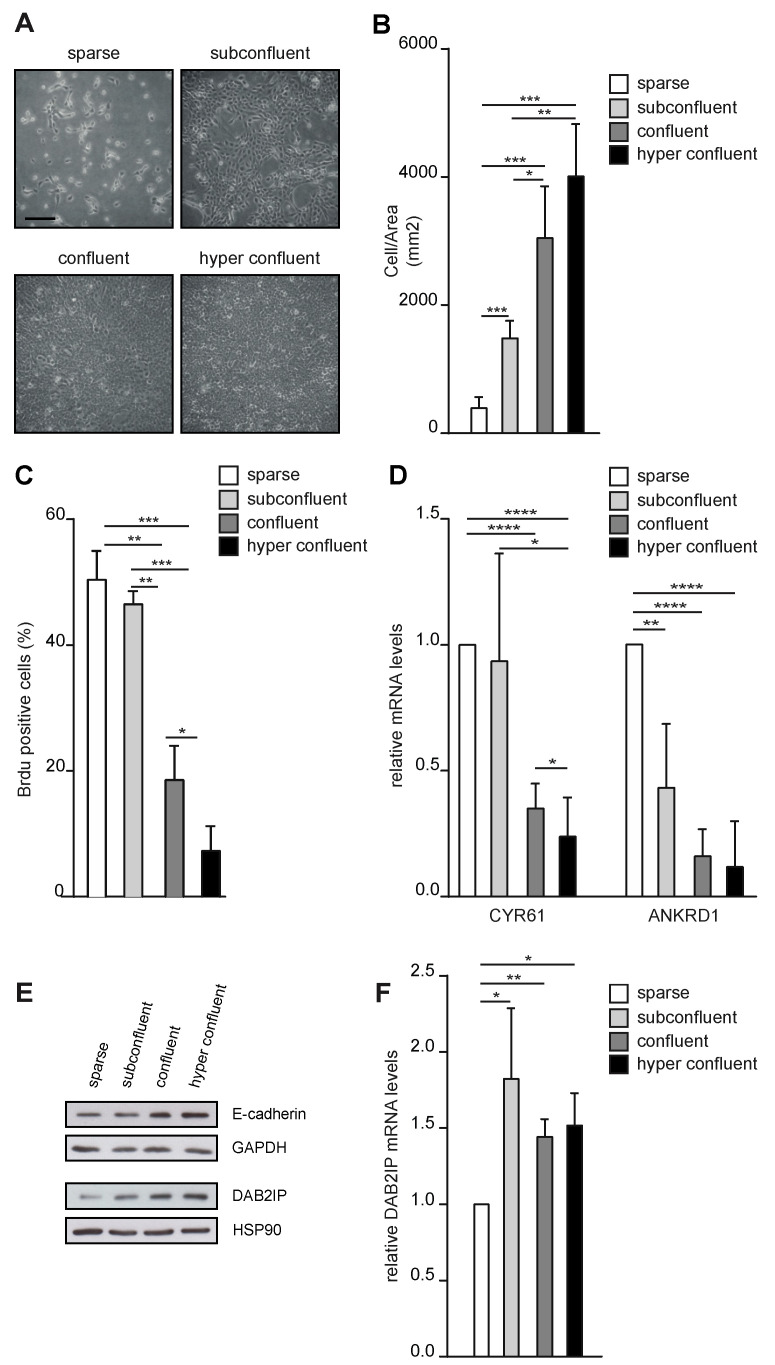
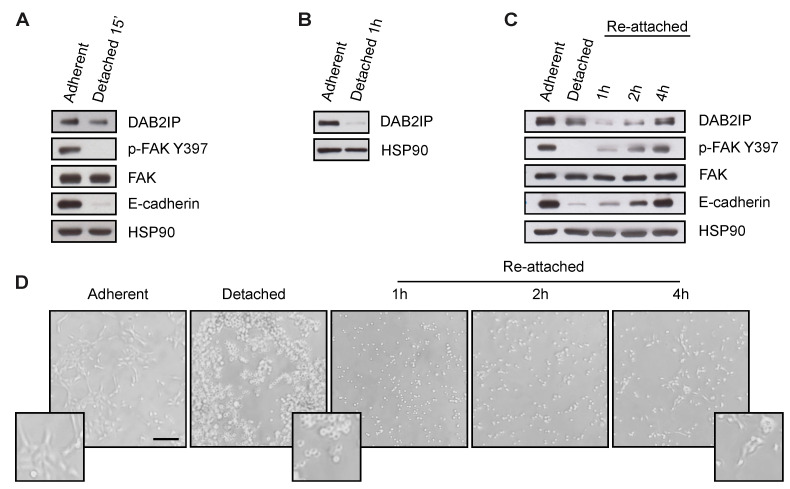
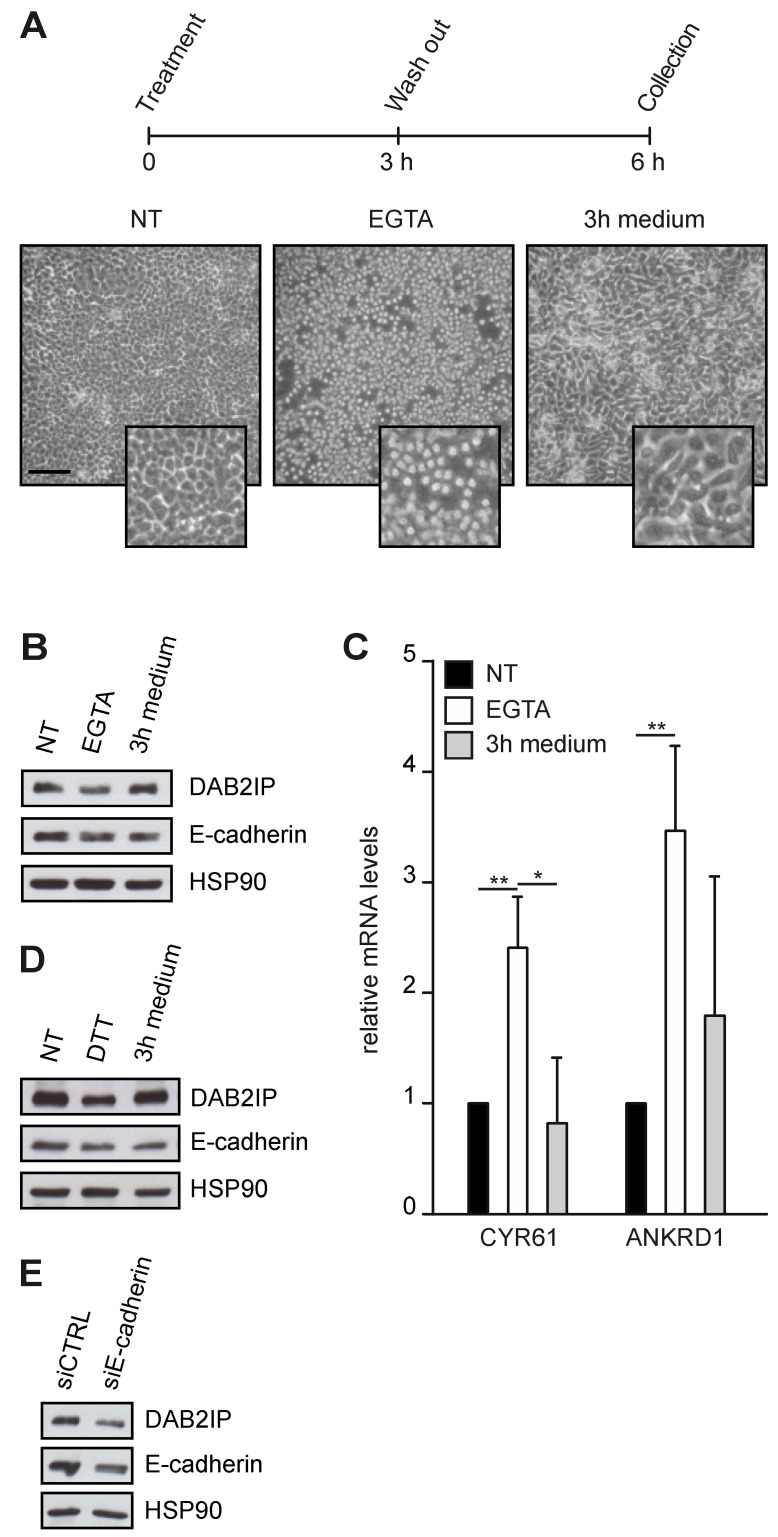
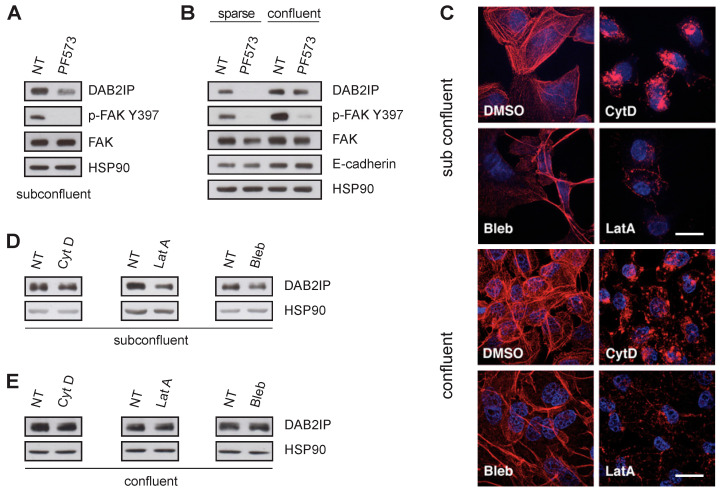
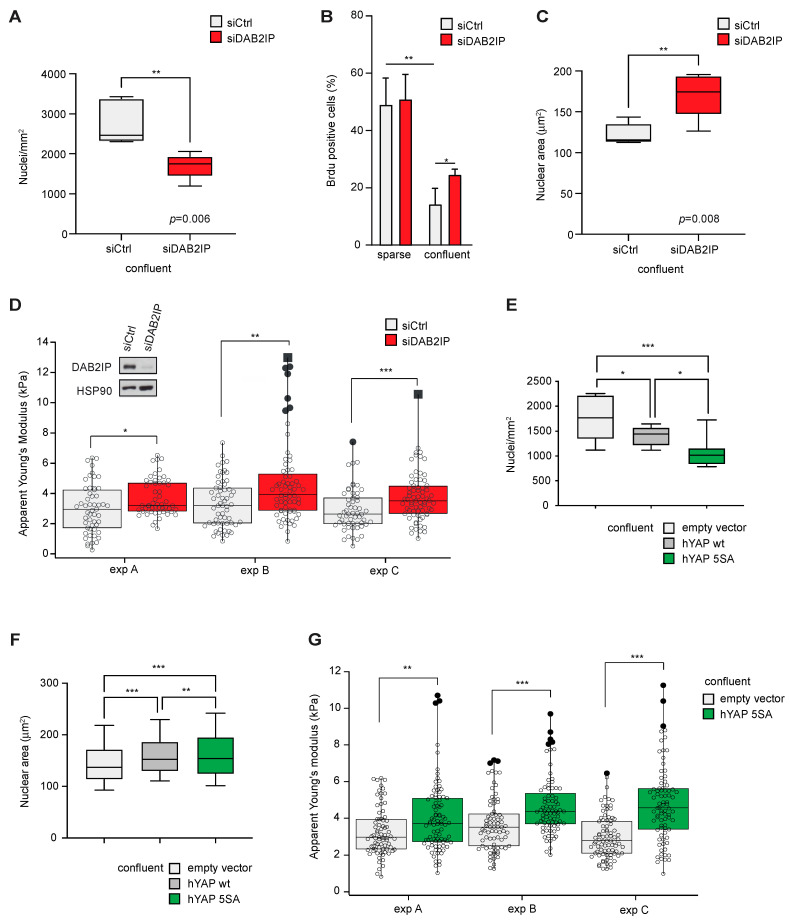
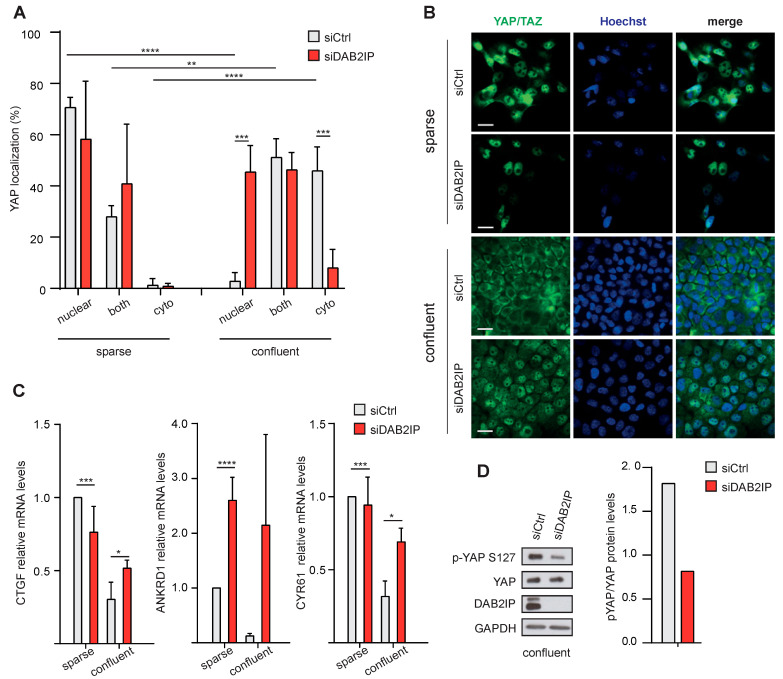
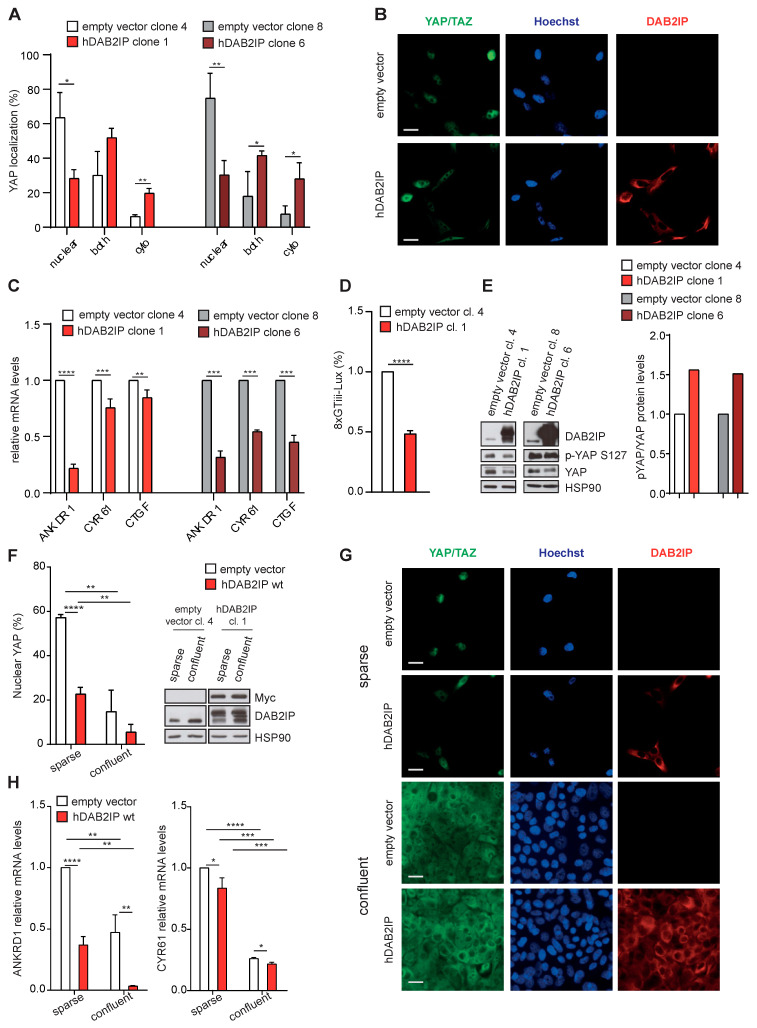
External and internal mechanical forces modulate cell morphology, movement, proliferation and metabolism, and represent crucial inputs for tissue homeostasis. The transcriptional regulators YAP and TAZ are important effectors of mechanical signaling and are frequently activated in solid tumors, correlating with metastasis, chemoresistance, and shorter patient survival. YAP/TAZ activity is controlled by various pathways that sense cell shape, polarity, contacts, and mechanical tension. In tumors, aberrant YAP/TAZ activation may result from cancer-related alterations of such regulatory networks. The tumor suppressor DAB2IP is a Ras-GAP and scaffold protein that negatively modulates multiple oncogenic pathways and is frequently downregulated or inactivated in solid tumors. Here, we provide evidence that DAB2IP expression is sustained by cell confluency. We also find that DAB2IP depletion in confluent cells alters their morphology, reducing cell packing while increasing cell stiffness. Finally, we find that DAB2IP depletion in confluent cells favors YAP/TAZ nuclear localization and transcriptional activity, while its ectopic expression in subconfluent cells increases YAP/TAZ retention in the cytoplasm. Together, these data suggest that DAB2IP may function as a sensor of cell interactions, contributing to dampening cellular responses to oncogenic inputs in confluent cells and that DAB2IP loss-of-function would facilitate YAP/TAZ activation in intact epithelia, accelerating oncogenic transformation.

Keywords: AIP1; Hippo pathway; Ras-GAP; cell stiffness; cell-to-cell contact; contact inhibition; mechanotransduction.


Conflict of interest statement

The authors declare no conflict of interest.

Figures

Figure 1
Figure 1
DAB2IP protein levels change with cell density in monolayer cultures. (A) Representative images of MCF10A cells seeded at different concentrations (sparse = 2500 cells/cm2; subconfluent = 7000 cells/cm2; confluent = 60,000 cells/cm2; hyperconfluent = 90,000 cells/cm2) and photographed after 48 h. Scale bar = 200 µm. (BF) Increasing cell density correlates with reduced cell proliferation, reduced YAP/TAZ transcriptional activity, increased E-cadherin levels, and DAB2IP protein levels. MCF10A cells were cultured as described in (A) before subsequent analyses. (B) Cells were fixed, and nuclei were labeled with Hoechst and counted. Graph indicates the number of nuclei in a square area of 1 mm2 (mean ± SD; n = 4; * p <0.05, ** p < 0.01, *** p < 0.001). (C) Cells were labeled with BrdU for 2 h before fixation and immunostaining with an anti-BrdU antibody; nuclei were counterstained with Hoechst. Graphs summarize the percentage of BrdU positive nuclei (mean ± SD; n = 3; * p < 0.05, ** p < 0.01, *** p < 0.001). (D) Total RNA was extracted and expression of CYR61 and ANKRD1 was measured by RT-qPCR. Data were normalized on histone H3 (mean ± SD; n = 4; * p <0.05, ** p < 0.01, **** p < 0.0001). (E) Total cell lysate was analyzed by Western blot to detect E-cadherin and DAB2IP. GADPH and HSP90 were blotted as loading controls. (F) Expression of DAB2IP was measured by RT-qPCR as in D (mean ± SD; n = 3; * p < 0.05, ** p < 0.01).
Figure 2
Figure 2
Cell adhesion to the substrate sustains DAB2IP protein levels. (A) Cell detachment decreases DAB2IP protein levels. MCF10A cells seeded on plastic (7000 cells/cm2) were cultured for 48 h before being detached by Trypsin/EDTA treatment. After 15 min, adherent and detached cells were collected and lysed. DAB2IP, p-FAK Y397, total FAK and E-cadherin were detected by immunoblotting, with HSP90 as loading control. (B) Lack of attachment decreases DAB2IP protein levels. Cells were seeded at high density (60,000 cells/cm2) and cultured for 48 h until confluence, before being detached by Trypsin/EDTA treatment. Detached cells were kept in suspension for 1 h, then adherent and detached cells were collected and lysed. DAB2IP was detected by immunoblotting, with HSP90 as a loading control. (C,D) Cell attachment increases DAB2IP protein levels. MCF10A cells were cultured and detached by Trypsin/EDTA, as in (A). After 15 min, cells were seeded in Petri dishes and kept in culture for the indicated times. (C) Adherent, detached and re-attached cells were collected and lysed. DAB2IP, p-FAK Y397, total FAK and E-cadherin were detected by immunoblotting, with HSP90 as loading control. (D) Representative pictures of adherent, detached and re-attached cells photographed before lysis (scale bar = 200 µm).
Figure 3
Figure 3
Cell–cell interactions sustain DAB2IP protein levels. (AC) DAB2IP protein levels and YAP/TAZ activity are reversibly affected by EGTA treatment. MCF10A cells were seeded at high density (60,000 cells/cm2) and cultured for 48 h until confluence. Cells were treated with 10 mM EGTA for 3 h, then fresh medium was added for an additional 3 h. (A) Schematic protocol and representative pictures of cells at the indicated time points (scale bar = 200 µm). (B) DAB2IP and E-cadherin levels were detected by immunoblotting, with HSP90 as a loading control. (C) Expression of CYR61 and ANKRD1 was measured by RT-qPCR. Data are normalized on histone H3 (mean ± SD; n = 3; * p < 0.05, ** p < 0.01). (D) DAB2IP protein levels are reversibly affected by DTT treatment. MCF10A cells were cultured and treated exactly as in A, using 10 mM DTT instead of EGTA. DAB2IP and E-cadherin levels were detected by immunoblotting, with HSP90 as a loading control. (E) E-cadherin depletion reduces DAB2IP protein in confluent cells. MCF10A were transfected with the indicated siRNAs, then seeded (60,000 cells/cm2) and cultured for an additional 48 h to confluent condition. DAB2IP and E-cadherin levels were detected by immunoblotting, with HSP90 as a loading control.
Figure 4
Figure 4
Mechanical tension of the actin cytoskeleton is not necessary to sustain DAB2IP protein levels in confluent cells. (A,B) FAK inhibition reduces DAB2IP protein levels in subconfluent cells, but not in confluent monolayers. MCF10A were seeded and cultured for 48 h to a subconfluent, sparse or confluent condition, as in Figure 1, and then treated with 10 µM PF573228 (PF573) for 6 h before lysis. DAB2IP, p-FAK Y397, total FAK and E-cadherin were detected by immunoblotting, with HSP90 as loading control. (CE) Disruption of actin cytoskeleton reduces DAB2IP protein levels in subconfluent cells, but not in confluent monolayers. MCF10A were seeded and cultured to subconfluent or confluent conditions, and then were exposed to Cytochalasin D (Cyt D, 10 µM for 4 h), Latrunculin A (LatA, 0.5 µM for 4 h), or Blebbistatin (Bleb, 50 µM for 24 h); then, cells were processed for immunofluorescence or Western blot. (C) Representative images of treated and control cells. F-actin was visualized with rhodamine phalloidin (red). Nuclei were labeled with Hoechst (blue). Scale bar = 20 µm. (D,E) DAB2IP was analyzed by immunoblotting after cells were treated with the indicated drugs in subconfluent conditions (D) or as a confluent monolayer (E). HSP90 was blotted as a loading control.
Figure 5
Figure 5
DAB2IP depletion affects the morphology, proliferation and stiffness of confluent cells. (A) DAB2IP depletion reduces maximal cell density in a confluent monolayer. MCF10A cells were transfected with the indicated siRNAs (40 nM) for 24 h, then seeded at high density (60,000 cells/cm2) and cultured for an additional 48 h to full confluency. Cells were fixed and nuclei were labeled with Hoechst. Graph summarizes the average number of nuclei per area in at least 4 microscope fields (mean ± SD; n = 5; ** p < 0.01). (B) DAB2IP depletion increases cell proliferation in high-density cultures. MCF10A cells were silenced as in (A), and seeded at low or high density. After 48 h, cells were labeled with BrdU for 2 h before fixation and immunostaining with an anti-BrdU antibody; nuclei were counterstained with Hoechst. Graphs summarize the percentage of BrdU positive nuclei (mean ± SD; n = 3; * p < 0.05, ** p < 0.01). (C) DAB2IP depletion increases the nuclear size of confluent cells. MCF10A cells were cultured and labeled exactly as in (A). Graph indicates the average nuclear area of at least 1100 cells in 4 microscope fields (mean ± SD; n = 5 ** p < 0.01). (D) DAB2IP depletion increases the stiffness of confluent cells. MCF10A cells were cultured and labeled exactly as in A. Cell rigidity was measured using atomic force microscopy (AFM) as detailed in the methods. At least 50 cells were measured per sample; black dots indicate outliers, and black squares are far outliers. Data refer to three independent experiments (* p < 0.05, ** p < 0.01, *** p < 0.001). (EG) Constitutive YAP overexpression in MCF10A recapitulates the phenotypes observed after DAB2IP knockdown. MCF10A stably overexpressing hYAP wt, hYAP 5SA, or an empty vector were cultured to maximal confluency and labeled as in (A). (E) Graph indicates the number of nuclei per area in at least 4 microscope fields (mean ± SD; n = 3; * p < 0.05, *** p < 0.001). (F) Graph indicates the average nuclear area of at least 800 cells in 4 microscope fields (mean ± SD; n = 3; ** p < 0.01, *** p < 0.001). (G) Cell rigidity was measured using atomic force microscopy (AFM) as in (D). At least 50 cells were measured per sample; black dots indicate outliers. Data refer to three independent experiments (** p < 0.01, *** p < 0.001).
Figure 6
Figure 6
DAB2IP depletion allows YAP/TAZ activation in confluent cells. (A,B) DAB2IP depletion increases YAP/TAZ nuclear localization in confluent cells. MCF10A cells were transfected and seeded as described in Figure 5. The cellular distribution of YAP was analyzed by immunofluorescence. (A) Graph summarizes the percentage of cells with YAP staining in the nucleus, cytoplasm, or both compartments (mean ± SD; n = 4; ** p < 0.01, *** p < 0.001, **** p < 0.0001). (B) Representative images of YAP/TAZ (green) localization by immunofluorescence. Scale bar = 20 µm. (C) DAB2IP depletion increases the expression of YAP/TAZ target genes in confluent cells. MCF10A cells were treated as in A. Expression of CTGF, ANKRD1 and CYR61 was measured by RT-qPCR. Data were normalized on histone H3 (mean ± SD; n = 3; * p < 0.05, *** p < 0.001, **** p < 0.0001). (D) DAB2IP depletion reduces YAP Ser127 phosphorylation in confluent cells. MCF10A cells were cultured as in A. DAB2IP, phosphorylated (p-S127) and total YAP were detected by immunoblotting, with GAPDH as loading control. Protein bands were quantified and normalized to GAPDH by densitometry of autoradiography film (histogram on the right).
Figure 7
Figure 7
DAB2IP overexpression inhibits YAP/TAZ activity. (A,B) Expression of hDAB2IP induces YAP cytoplasmic retention. MCF10A cells stably expressing Myc-tagged hDAB2IP or a control empty vector (two different clones each), were seeded (7000 cells/cm2) and cultured for 48 h until subconfluent. YAP/TAZ localization was detected by immunofluorescence. (A) Graph summarizes the percentage of cells with YAP staining in the nucleus, cytoplasm, or both compartments (mean ± SD; n = 3; * p <0.05, ** p < 0.01). (B) Representative images of cells stained with antibodies against DAB2IP (red) and YAP/TAZ (green). Nuclei were stained with Hoechst (blue). Scale bar = 20 µm. (C,D) Stable expression of hDAB2IP inhibits YAP/TAZ transcriptional activity. MCF10A clones were cultured as in (A). (C) Expression of endogenous ANKDR1, CYR61 and CTGF was measured by RT-qPCR. Data were normalized on histone H3 (mean ± SD; n = 3; ** p < 0.01, *** p < 0.001, **** p < 0.0001). (D) The indicated cells were transfected with the 8xGTIIC-Lux reporter for 24 h, and YAP/TAZ activity was measured by Dual-luciferase assay (mean ± SD; n = 3; **** p < 0.0001). (E) Stable expression of hDAB2IP increases YAP Ser127 phosphorylation. MCF10A clones were cultured as in A. DAB2IP, phosphorylated (p-S127) and total YAP were detected by immunoblotting, with HSP90 as loading control. Protein bands were quantified and normalized to HSP90 by densitometry of autoradiography film (histogram on the right). (FH) Stable expression of hDAB2IP inhibits YAP/TAZ nuclear translocation and transcriptional activity both in sparse and confluent cells. MCF10A clones were cultured for 48 h after seeding at low or high density (2500 cells/cm2 and 60,000 cells/cm2, respectively). (F,G) YAP/TAZ localization was analyzed by immunofluorescence as in (A). (F) Graph on the left indicates the percentage of cells with YAP/TAZ staining in the nucleus (mean ± SD; n = 3; * p < 0.05, ** p < 0.01, **** p < 0.0001). Expression of Myc-hDAB2IP and endogenous DAB2IP was checked by Western blot, with HSP90 as a loading control (right panel). (G) Representative images of cells stained with antibodies against DAB2IP (red) and YAP/TAZ (green). Nuclei were stained with Hoechst (blue). Scale bar = 20 µm. (H) Expression of ANKDR1 and CYR61 was measured by RT-qPCR. Data were normalized on histone H3 (mean ± SD; n = 3; * p < 0.05, ** p < 0.01, *** p < 0.001, **** p < 0.0001).

Similar articles

Cited by

References

    1. Northey J.J., Przybyla L., Weaver V.M. Tissue Force Programs Cell Fate and Tumor Aggression. Cancer Discov. 2017;7:1224–1237. doi: 10.1158/2159-8290.CD-16-0733. - DOI - PMC - PubMed
    1. Shmelev M.E., Titov S.I., Belousov A.S., Farniev V.M., Zhmenia V.M., Lanskikh D.V., Penkova A.O., Kumeiko V.V. Cell and Tissue Nanomechanics: From Early Development to Carcinogenesis. Biomedicines. 2022;10:345. doi: 10.3390/biomedicines10020345. - DOI - PMC - PubMed
    1. Le Bras G.F., Taubenslag K.J., Andl C.D. The regulation of cell-cell adhesion during epithelial-mesenchymal transition, motility and tumor progression. Cell Adh. Migr. 2012;6:365–373. doi: 10.4161/cam.21326. - DOI - PMC - PubMed
    1. Pocaterra A., Romani P., Dupont S. YAP/TAZ functions and their regulation at a glance. J. Cell Sci. 2020;133:jcs230425. doi: 10.1242/jcs.230425. - DOI - PubMed
    1. Battilana G., Zanconato F., Piccolo S. Mechanisms of YAP/TAZ transcriptional control. Cell Stress. 2021;5:167–172. doi: 10.15698/cst2021.11.258. - DOI - PMC - PubMed

LinkOut - more resources