. 2023 Jun 29;15(13):3419.
doi: 10.3390/cancers15133419.

Efficacy of a HER2-Targeted Thorium-227 Conjugate in a HER2-Positive Breast Cancer Bone Metastasis Model

Affiliations

Efficacy of a HER2-Targeted Thorium-227 Conjugate in a HER2-Positive Breast Cancer Bone Metastasis Model

Jenny Karlsson et al. Cancers (Basel). .

Abstract

Human epidermal growth factor receptor 2 (HER2) is overexpressed in 15-30% of breast cancers but has low expression in normal tissue, making it attractive for targeted alpha therapy (TAT). HER2-positive breast cancer typically metastasizes to bone, resulting in incurable disease and significant morbidity and mortality. Therefore, new strategies for HER2-targeting therapy are needed. Here, we present the preclinical in vitro and in vivo characterization of the HER2-targeted thorium-227 conjugate (HER2-TTC) TAT in various HER2-positive cancer models. In vitro, HER2-TTC showed potent cytotoxicity in various HER2-expressing cancer cell lines and increased DNA double strand break formation and the induction of cell cycle arrest in BT-474 cells. In vivo, HER2-TTC demonstrated dose-dependent antitumor efficacy in subcutaneous xenograft models. Notably, HER2-TTC also inhibited intratibial tumor growth and tumor-induced abnormal bone formation in an intratibial BT-474 mouse model that mimics breast cancer metastasized to bone. Furthermore, a match in HER2 expression levels between primary breast tumor and matched bone metastases samples from breast cancer patients was observed. These results demonstrate proof-of-concept for TAT in the treatment of patients with HER2-positive breast cancer, including cases where the tumor has metastasized to bone.

Keywords: HER2-positive breast cancer; HER2-targeted therapy; bone metastasis; intratibial mouse model; targeted alpha therapy; targeted radiotherapy; targeted thorium conjugate; thorium-227.


Conflict of interest statement

All authors are current or former employees of Bayer. Christoph Schatz and Alan Cuthbertson are stockholders of Bayer AG. Jenny Karlsson and Alan Cuthbertson hold patents connected to this work. No potential conflicts of interest were disclosed by the other authors.

Figures
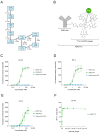
Figure 1
Figure 1
Structure, binding, and stability of HER2-TTC. (A) Decay chain of thorium-227. Thorium-227 decays via its alpha- and beta-emitting daughters to stable non-radioactive lead-207 (modified from [18]). (B) Structure of HER2-TTC consisting of the HER2 mAb covalently attached to the 3,2-HOPO chelator enabling efficient radiolabeling with thorium-227 (modified from [29]). (CE) Binding of HER2 mAb, HER2-ACC, and non-radiolabeled isotype control in HER2-expressing (C) BT-474 and (D) KPL-4 human breast cancer cells and (E) Calu-3 human lung cancer cells, as determined via flow cytometry (n = 2–4). (F) Immunoreactive fraction (IRF) curve showing efficient binding of HER2-TTC to HER2 receptors in BT-474 cells (n = 1–3).
Figure 2
Figure 2
In vitro characterization and the mode of action of HER2-TTC. (AC) Viability of (A) BT-474 breast cancer, (B) KPL-4 breast cancer, and (C) Calu-3 lung cancer cells after treatment with HER2-TTC or radiolabeled isotype control at 20 kBq/μg (BT-474, KPL-4) or 40 kBq/μg (Calu-3) (n = 3). (D) Induction of DNA double strand breaks (DSBs) in BT-474 cells exposed to 0.07–50 kBq/mL HER2-TTC or radiolabeled isotype control for 24, 48, or 72 h, as determined by means of detection of H2AX protein phosphorylation (γ-H2AX; n = 3). (E) Representative fluorescent microscopy images of γ-H2AX staining in BT-474 cells treated with medium, HER2-TTC, or radiolabeled isotype control for 72 h. The scale bar indicates 100 μm and is representative for all images. (F) Analysis of cell cycle arrest in BT-474 cells after treatment with 40 kBq/μg HER2-TTC or radiolabeled isotype control for 24, 48, or 72 h (n = 2–4). Statistical analysis was performed using an unpaired t-test. * p < 0.05 vs. vehicle.
Figure 3
Figure 3
In vivo efficacy of HER2-TTC in the subcutaneous KPL-4 breast and Calu-3 lung cancer xenograft models. (A) Growth curves of KPL-4 tumors in female athymic nude mice (n = 10) treated with a single i.v. injection of vehicle, radiolabeled isotype control (250 kBq/kg), or HER2-TTC (100, 250, or 500 kBq/kg, at a total antibody dose of 0.14 mg/kg) on day 14 after tumor inoculation (treatment day indicated with a black arrow). (B) Tumor volumes of individual KPL-4 tumors shown in (A) on day 31. (C) Growth curves of Calu-3 tumors in female NMRI nude mice (n = 10) treated with a single i.v. injection of vehicle, radiolabeled isotype control (250 kBq/kg), or HER2-TTC (125, 250, or 500 kBq/kg, at a total antibody dose of 0.14 mg/kg) on day 8 after tumor inoculation (treatment day indicated with a black arrow). (D) Tumor volumes of individual Calu-3 tumors shown in (C) on day 44. (E) HER2 expression and γ-H2AX levels in Calu-3 tumors treated with vehicle, radiolabeled isotype control (250 kBq/kg), or HER2-TTC (250 kBq/kg) (n = 3). IHC analysis was performed at the end of the study, on day 37 after treatment. γ-H2AX staining indicative of DNA damage is indicated with red arrows. Magnification 20x; scale bars indicate 20 μm. (F) Quantification of the γ-H2AX staining shown in (E) (n = 3). Statistical analyses were performed using one-way ANOVA followed by Tukey’s test. ** p < 0.01; *** p < 0.001 vs. vehicle. # p < 0.05 vs. radiolabeled isotype control.
Figure 4
Figure 4
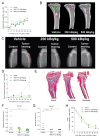
In vivo efficacy of HER2-TTC in the intratibial BT-474 mouse model mimicking breast cancer-induced metastatic bone disease. Mice were treated with a single i.v. injection of vehicle or HER2-TTC (250 or 500 kBq/kg, at a total antibody dose of 0.14 mg/kg) on day 6 after tumor inoculation. (A) Relative body weights of BT-474 tumor-bearing mice treated with vehicle or HER2-TTC (n = 9–12/group). Values are shown as percentages of initial body weights on day 5 after tumor inoculation. The dashed line indicates the day of treatment as a single injection. (B) Representative micro-CT images of tumor-bearing tibias of each treatment group at sacrifice on study day 42. One representative tibia is shown from each treatment group. Tumor-induced abnormal bone changes in the vehicle group are indicated with a red circle. No such foci were observed in HER2-TTC-treated mice. (C) Representative X-ray images of control or BT-474 tumor-bearing tibias of each treatment group at sacrifice on study day 42. Tibias of one animal per each group are shown. Red line delineates the area of tumor-induced changes in bone. (D) Tumor-induced abnormal bone changes determined in the tumor-bearing tibia of vehicle or HER2-TTC-treated mice using X-ray imaging and image analysis software. * p < 0.05; *** p < 0.001 vs. vehicle. (E) Representative histological images from hematoxylin and eosin (H&E)- and Orange G-stained sections of BT-474-inoculated tibias at sacrifice on study day 42. One tibia is shown per each treatment group. Scale bar represents 1000 μm. B, bone; T, tumor; BM, bone marrow. (F) Trabecular bone area including areas of tumor-induced bone growth measured in histological sections on study day 42 (n = 9/group). Horizontal lines indicate median values. ** p < 0.01 vs. vehicle. (G) Total tumor area measured in histological sections of BT-474-inoculated tibias on study day 42 (n = 9/group). Horizontal lines indicate median values. ** p < 0.01 vs. vehicle. (H) Serum bone formation marker PINP relative to baseline values in BT-474 tumor-bearing mice (n = 9/group). *** p < 0.001 vs. vehicle. All statistical analyses were performed using mixed models and model contrasts.
Figure 5
Figure 5
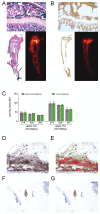
HER2-TTC accumulation to bone and HER2 expression in the intratibial BT-474 mouse model. (A) Trichrome Masson-Goldner staining of BT-474 tumor-bearing tibias collected 14 days after treatment with 500 kBq/kg HER2-TTC at 20× (upper panel, scale bar indicates 200 μm) and 2.5× (lower left panel, scale bar represents 1 mm) magnification and the corresponding alpha camera image (lower right panel). (B) Von Kossa staining of BT-474 tumor-bearing tibias collected 14 days after treatment with 500 kBq/kg HER2-TTC at 20× (upper panel, scale bar represents 200 μm) and 2.5× (lower left panel, scale bar indicates 1 mm) magnification and the corresponding alpha camera image (lower right panel). (C) Incorporated radioactivity relative to tibia weight (cpm/mg) in non-tumor-bearing and BT-474 tumor-bearing tibias upon treatment with 250 or 500 kBq/kg HER2-TTC. Tibias were collected 14, 28, or 42 days (d) after tumor inoculation and measured via gamma counting. (D) A representative image of HER2 expression in a bone tissue sample from a vehicle-treated mouse on day 42 after tumor inoculation (score 3+). (E) HER2 staining analysis of the sample described in panel D using the ImmunoMembrane web application. Red color indicates complete and strong HER2 staining, whereas green color indicates incomplete or weak HER2 staining. (F) HER2 expression scored as 2+/3+ in a bone tissue sample from a HER2-TTC-treated (500 kBq/kg) mouse on day 28 after tumor inoculation (the only sample in which tumor growth was detected on day 28 [n = 3] or 42 [n = 9] after tumor inoculation). (G) HER2 staining analysis of the sample described in panel F using the ImmunoMembrane web application. The scale bar in panel G indicates 100 μm and is representative for panels DF. HER2 expression in BT-474 tumors was visualized using the SP3 rabbit monoclonal antibody. The HER2 status of the tumors was evaluated based on the membrane staining completeness and intensity according to the ASCO CAP 2018 guidelines [46] and analyzed using the ImmunoMembrane web application (https://biii.eu/immunomembrane, accessed on 4 August 2016). Classification/score for HER2 expression: 0/1+ = negative, 2+ = equivocal, 3+ = positive.
Figure 6
Figure 6
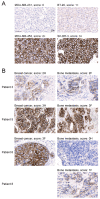
HER2 expression in matched primary breast cancer and bone metastasis samples from HER2-positive breast cancer patients. (A) HER2 expression in MDA-MB-231 (score 0), BT-20 (score 1+), MDA-MB-453 (score 2+), and SK-BR-3 (score 3+) breast cancer cells. HER2-positive breast cancer cells were stained as reference. (B) Representative images of HER2 IHC analyses in breast cancer tissue and matching bone metastasis samples from four patients with HER2-positive primary breast cancer. Brown color indicates HER2 expression. A magnification level of 20× was used. The scale bar indicates 50 μm and applies to all images.

References

    1. Allen B.J., Huang C.Y., Clarke R.A. Targeted alpha anticancer therapies: Update and future prospects. Biologics. 2014;8:255–267. doi: 10.2147/BTT.S29947. - DOI - PMC - PubMed
    1. Hagemann U.B., Wickstroem K., Wang E., Shea A.O., Sponheim K., Karlsson J., Bjerke R.M., Ryan O.B., Cuthbertson A.S. In Vitro and In Vivo Efficacy of a Novel CD33-Targeted Thorium-227 Conjugate for the Treatment of Acute Myeloid Leukemia. Mol. Cancer Ther. 2016;15:2422–2431. doi: 10.1158/1535-7163.MCT-16-0251. - DOI - PubMed
    1. Suominen M.I., Rissanen J.P., Kakonen R., Fagerlund K.M., Alhoniemi E., Mumberg D., Ziegelbauer K., Halleen J.M., Kakonen S.M., Scholz A. Survival benefit with radium-223 dichloride in a mouse model of breast cancer bone metastasis. J. Natl. Cancer Inst. 2013;105:908–916. doi: 10.1093/jnci/djt116. - DOI - PubMed
    1. Supiot S., Faivre-Chauvet A., Couturier O., Heymann M.F., Robillard N., Kraeber-Bodere F., Morandeau L., Mahe M.A., Cherel M. Comparison of the biologic effects of MA5 and B-B4 monoclonal antibody labeled with iodine-131 and bismuth-213 on multiple myeloma. Cancer. 2002;94:1202–1209. doi: 10.1002/cncr.10286. - DOI - PubMed
    1. Latif Z., Watters A.D., Dunn I., Grigor K.M., Underwood M.A., Bartlett J.M. HER2/neu overexpression in the development of muscle-invasive transitional cell carcinoma of the bladder. Br. J. Cancer. 2003;89:1305–1309. doi: 10.1038/sj.bjc.6601245. - DOI - PMC - PubMed