. 2023 Jun 25;16(13):4589.
doi: 10.3390/ma16134589.

New Plastic Crack-Tip Opening Displacement Tool Based on Digital Image Correlation for Estimating the Fatigue-Crack-Growth Law on 316L Stainless Steel

Affiliations

New Plastic Crack-Tip Opening Displacement Tool Based on Digital Image Correlation for Estimating the Fatigue-Crack-Growth Law on 316L Stainless Steel

Muhammad Ajmal et al. Materials (Basel). .

Abstract

This work presents a new approach for studying crack growth resulting from fatigue, which utilizes the plastic contribution of crack-tip opening displacement (CTODp). CTODp is used to predict austenitic stainless-steel crack propagation. Unlike linear elastic fracture mechanics analysis, the method presented here is also helpful for tasks other than small-scale yielding. The approach was based on correlating full-field displacement information with post-processing digital images. This work describes a detailed post-processing protocol that can be used to calculate CTODp. The results for steel compact-tension specimens were especially promising. Of note, there was a linear relationship between the propagation rate of fatigue cracks and the CTODp range.

Keywords: crack-tip opening displacement; digital image correlation; fatigue crack propagation.


Conflict of interest statement

The authors declare no conflict of interest.

Figures

Figure 1
Figure 1
Schematic of the compact-tension (CT) geometry.
Figure 2
Figure 2
The experimental configuration employed in this work [64].
Figure 3
Figure 3
Photograph of the propagating crack on the compact-tension geometry specimen. The displacement field is shown as red directional arrows superimposed onto the image. The fatigue crack runs horizontally, growing from the left to right side.
Figure 4
Figure 4
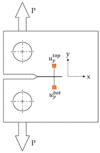
Description of data sets collected above the crack plane, uytop, and those collected below the crack plane, uybot, used to compute displacement of the crack-tip opening.
Figure 5
Figure 5
Crack-tip opening displacement versus load curve represented as a schematic, with the identification of characteristic points [83].
Figure 6
Figure 6
Parameters for fatigue-crack-growth analysis [83].
Figure 7
Figure 7
(a) Changes in the data near the crack-opening and crack-closing positions shown through selected plots of loading and unloading; (b) a graphic representation showing the procedure used to extrapolate the loads at which the crack opened and closed [83].
Figure 8
Figure 8
(a) Graphic representation demonstrating the application of rolling regression to maximize the point of correlation on the unloading curve. (b) Magnification of the curve in the maximum load. The numbers 1, 2, 3 are showing progressive steps (windows) taken by the rolling regression.
Figure 9
Figure 9
(a) The loading and unloading curves of crack-tip opening displacement (CTOD) plotted against load; (b) the plastic contribution of CTOD (CTODp) plotted against load.
Figure 9
Figure 9
(a) The loading and unloading curves of crack-tip opening displacement (CTOD) plotted against load; (b) the plastic contribution of CTOD (CTODp) plotted against load.
Figure 10
Figure 10
(a) Evolution of CTOD versus load at 230,792 cycles, together with the linear fitting for both portions of the cycle (loading and unloading); (b) the plastic contribution of the CTOD based on the information extracted from (a).
Figure 10
Figure 10
(a) Evolution of CTOD versus load at 230,792 cycles, together with the linear fitting for both portions of the cycle (loading and unloading); (b) the plastic contribution of the CTOD based on the information extracted from (a).
Figure 11
Figure 11
(a) Evolution of CTOD versus load at 250,786 cycles, together with the linear fitting for both portions of the cycle (loading and unloading); (b) the plastic contribution of the CTOD based on the information extracted from (a).
Figure 11
Figure 11
(a) Evolution of CTOD versus load at 250,786 cycles, together with the linear fitting for both portions of the cycle (loading and unloading); (b) the plastic contribution of the CTOD based on the information extracted from (a).
Figure 12
Figure 12
(a) Evolution of CTOD versus load at 290,838 cycles, together with the linear fitting for both portions of the cycle (loading and unloading); (b) the plastic contribution of the CTOD based on the information extracted from (a).
Figure 12
Figure 12
(a) Evolution of CTOD versus load at 290,838 cycles, together with the linear fitting for both portions of the cycle (loading and unloading); (b) the plastic contribution of the CTOD based on the information extracted from (a).
Figure 13
Figure 13
(a) Evolution of CTOD versus load at 331,273 cycles, together with the linear fitting for both portions of the cycle (loading and unloading); (b) the plastic contribution of the CTOD based on the information extracted from (a).
Figure 13
Figure 13
(a) Evolution of CTOD versus load at 331,273 cycles, together with the linear fitting for both portions of the cycle (loading and unloading); (b) the plastic contribution of the CTOD based on the information extracted from (a).
Figure 14
Figure 14
A graphic plot of da/dN versus change in plastic contribution of crack-tip opening displacement (∆CTODp) for the data shown in Table 1. The blue dots represent the experimental points obtained with the new methodology.

References

    1. Nishida S. Failure analysis in engineering applications. Mater. Des. 1992;13:121.
    1. Burstow M.C., Howard I.C. Damage mechanics models of ductile crack growth in welded specimens. Fatigue Fract. Eng. Mater. Struct. 2000;23:691–708. doi: 10.1046/j.1460-2695.2000.00317.x. - DOI
    1. Findlay S.J., Harrison N.D. Why aircraft fail. Mater. Today. 2002;5:18–25. doi: 10.1016/S1369-7021(02)01138-0. - DOI
    1. Schütz W. A history of fatigue. Eng. Fract. Mech. 1996;54:263–300. doi: 10.1016/0013-7944(95)00178-6. - DOI
    1. Newman J.C., Phillips E.P., Swain M.H. Fatigue-life prediction methodology using small-crack theory. Int. J. Fatigue. 1999;21:109–119. doi: 10.1016/S0142-1123(98)00058-9. - DOI

LinkOut - more resources