

Association between Body Composition Contents and Hepatic Fibrosis in Sarcopenic Obesity
- PMID: 37445314
- PMCID: PMC10342967
- DOI: 10.3390/jcm12134279
Association between Body Composition Contents and Hepatic Fibrosis in Sarcopenic Obesity
Abstract
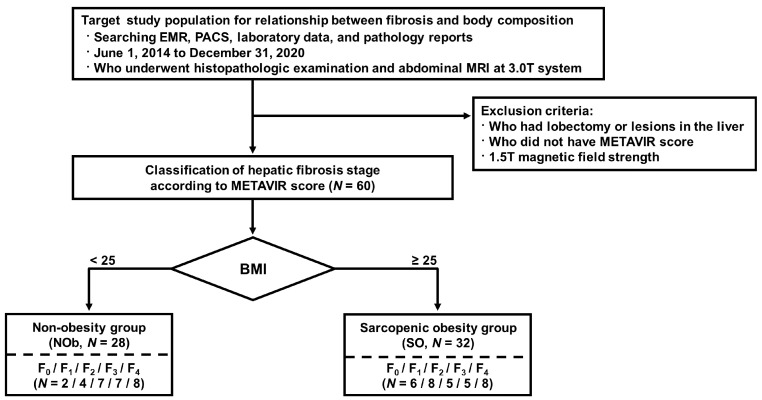
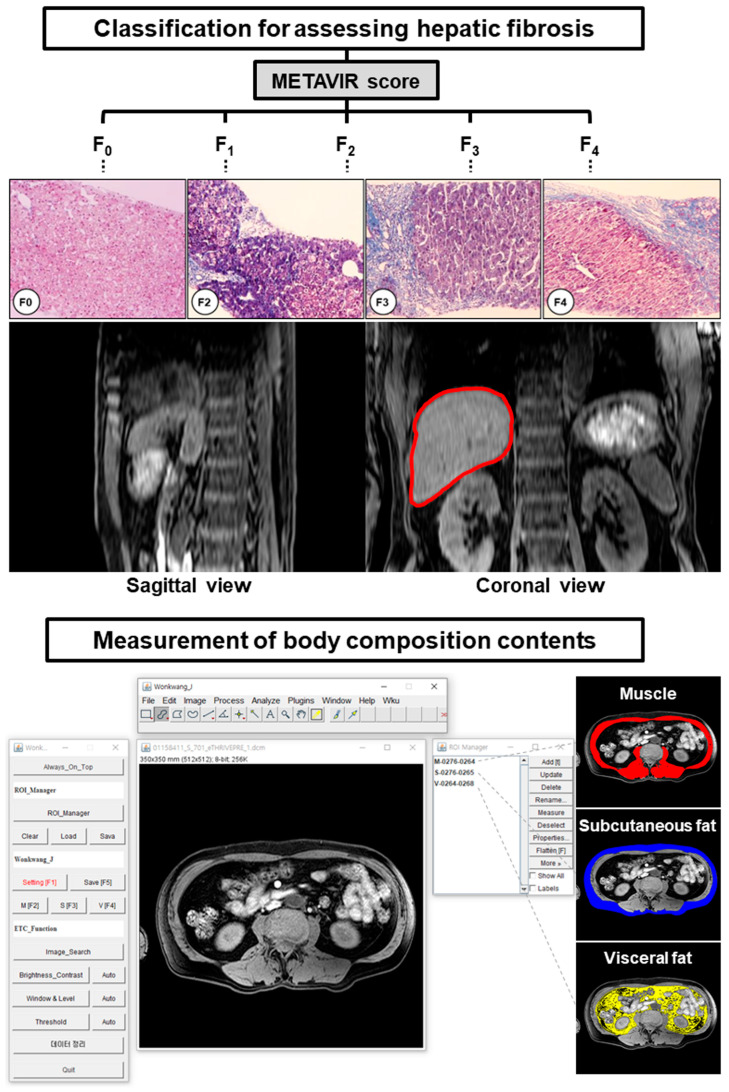
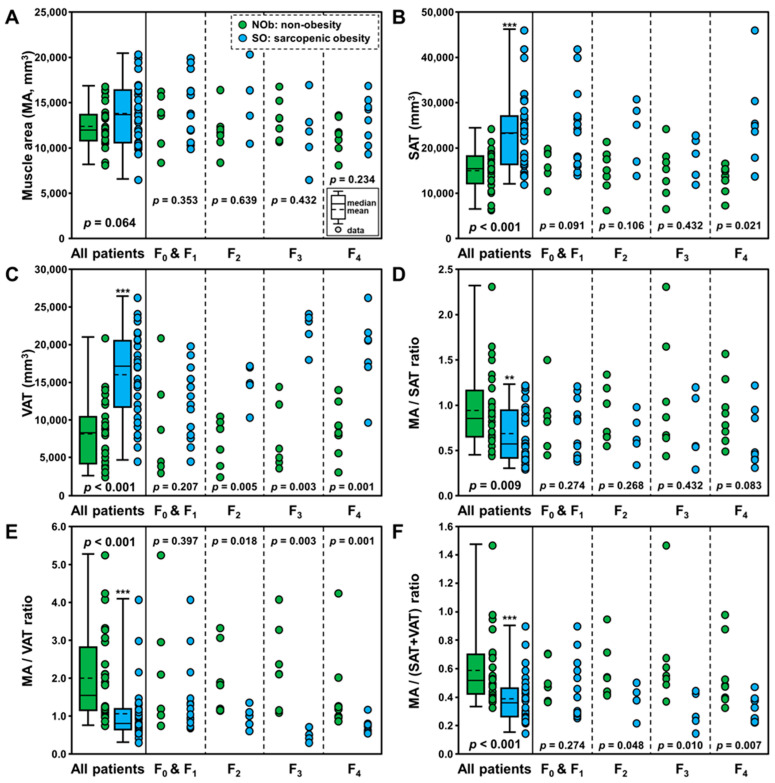
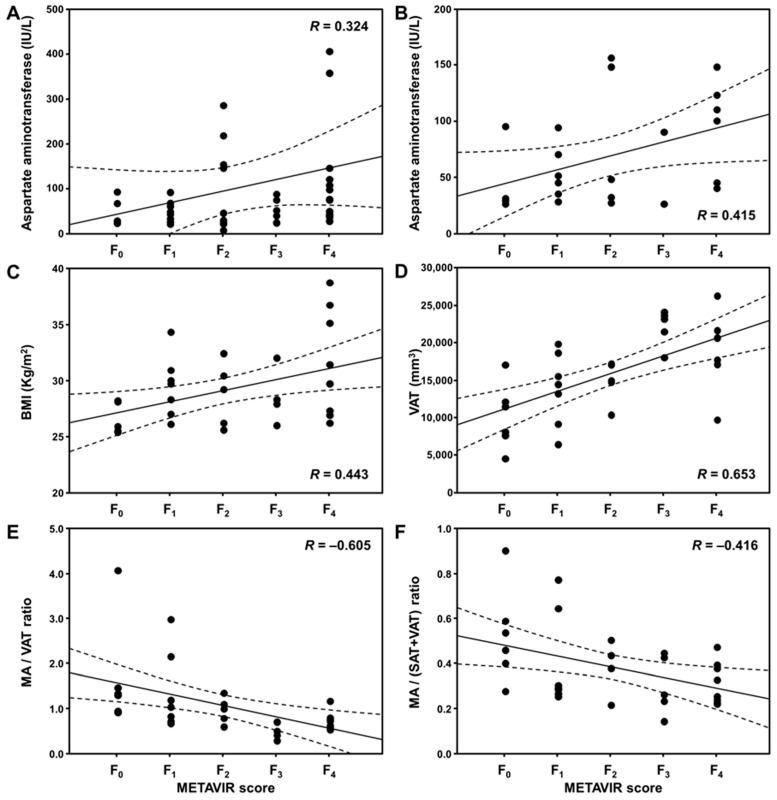
It is well established that sarcopenic obesity (SO) is linked to many diseases such as metabolic and non-alcoholic fatty liver diseases, but there is little known about the relationship between SO and hepatic fibrosis progression in chronic liver disease. This study compared body composition contents in patients with non-obesity (NOb) and SO using abdominal magnetic resonance imaging and investigated the relationship between hepatic fibrosis and SO factors. This retrospective study enrolled 60 patients (28 NOb; 32 SO) from June 2014 to December 2020. Patients underwent histopathologic investigation where they classified fibrosis stages based on the Meta-analysis of Histological Data in Viral Hepatitis fibrosis scoring system. Muscle and fat areas at the third lumber vertebra level were assessed. The variation in the areas of muscle (MA), subcutaneous adipose tissue (SAT), and visceral adipose tissue (VAT) among fibrosis stages, and associations between hepatic fibrosis and SO factors, were analyzed. There were significant differences in SAT and VAT (p < 0.001), whereas there was no difference in MA (p = 0.064). There were significant differences in MA/SAT (p = 0.009), MA/VAT (p < 0.001), and MA/(SAT+VAT) (p < 0.001). In all the patients, hepatic fibrosis positively correlated with serum aspartate aminotransferase level (AST, R = 0.324; p = 0.025). Especially in SO patients, hepatic fibrosis closely correlated with body mass index (BMI, R = 0.443; p = 0.011), AST (R = 0.415; p = 0.044), VAT (R = 0.653; p < 0.001), MA/VAT (R = -0.605; p < 0.001), and MA/(SAT+VAT) (R = -0.416; p = 0.018). However, there was no association in NOb patients. This study demonstrated that SO patients had larger SAT and VAT than NOb patients. Hepatic fibrosis in SO positively correlated with body visceral fat composition in combination with BMI and AST level. These findings will be useful for understanding the relationship between the hepatic manifestation of fibrosis and body fat composition in sarcopenia and SO.
Keywords: body composition; hepatic fibrosis; sarcopenic obesity (SO); third lumber spine (L3).
Conflict of interest statement
The authors declare no conflict of interest.
Figures
Similar articles
-
Visceral adiposity and inflammatory bowel disease.Int J Colorectal Dis. 2021 Nov;36(11):2305-2319. doi: 10.1007/s00384-021-03968-w. Epub 2021 Jun 9. Int J Colorectal Dis. 2021. PMID: 34104989 Review.
-
[The correlations of abdominal adipose tissue with anthropometric and metabolic parameters in obese children by magnetic resonance imaging].Zhonghua Er Ke Za Zhi. 2022 Aug 2;60(8):798-803. doi: 10.3760/cma.j.cn112140-20220129-00099. Zhonghua Er Ke Za Zhi. 2022. PMID: 35922191 Chinese.
-
Association between MRI-based visceral adipose tissues and metabolic abnormality in a Chinese population: a cross-sectional study.Nutr Metab (Lond). 2022 Mar 5;19(1):16. doi: 10.1186/s12986-022-00651-x. Nutr Metab (Lond). 2022. PMID: 35248099 Free PMC article.
-
Threshold values of visceral fat measures and their anthropometric alternatives for metabolic derangement in Japanese obese boys.Int J Obes Relat Metab Disord. 2002 Feb;26(2):208-13. doi: 10.1038/sj.ijo.0801865. Int J Obes Relat Metab Disord. 2002. PMID: 11850752
-
Crossvalidation of anthropometry against magnetic resonance imaging for the assessment of visceral and subcutaneous adipose tissue in children.Int J Obes (Lond). 2006 Jan;30(1):23-30. doi: 10.1038/sj.ijo.0803163. Int J Obes (Lond). 2006. PMID: 16344845 Review.
Cited by
-
HDL-C and visceral adipose tissue as combined predictors of visceral fat changes following laparoscopic sleeve gastrectomy.BMC Surg. 2025 Aug 6;25(1):343. doi: 10.1186/s12893-025-03069-3. BMC Surg. 2025. PMID: 40770632 Free PMC article. Clinical Trial.
-
Metabolic-associated fatty liver disease and sarcopenia: A double whammy.World J Hepatol. 2024 Feb 27;16(2):152-163. doi: 10.4254/wjh.v16.i2.152. World J Hepatol. 2024. PMID: 38495287 Free PMC article. Review.
References
-
- Donini L.M., Busetto L., Bischoff S.C., Cederholm T., Ballesteros-Pomar M.D., Batsis J.A., Bauer J.M., Boirie Y., Cruz-Jentoft A.J., Dicker D., et al. Definition and Diagnostic Criteria for Sarcopenic Obesity: ESPEN and EASO Consensus Statement. Obes. Facts. 2022;15:321–335. doi: 10.1159/000521241. - DOI - PMC - PubMed
LinkOut - more resources
Full Text Sources
Research Materials
