. 2023 Jun 21;24(13):10426.
doi: 10.3390/ijms241310426.

An Efficient 5-Aminolevulinic Acid Photodynamic Therapy Treatment for Human Hepatocellular Carcinoma

Affiliations

An Efficient 5-Aminolevulinic Acid Photodynamic Therapy Treatment for Human Hepatocellular Carcinoma

Abhishek Kumar et al. Int J Mol Sci. .

Abstract

Photodynamic therapy (PDT) is a two-stage treatment relying on cytotoxicity induced by photoexcitation of a nontoxic dye, called photosensitizer (PS). Using 5-aminolevulinic acid (5-ALA), the pro-drug of PS protoporphyrin IX, we investigated the impact of PDT on hepatocellular carcinoma (HCC). Optimal 5-ALA PDT dose was determined on three HCC cell lines by analyzing cell death after treatment with varying doses. HCC-patient-derived tumor hepatocytes and healthy donor liver myofibroblasts were treated with optimal 5-ALA PDT doses. The proliferation of cancer cells and healthy donor immune cells cultured with 5-ALA-PDT-treated conditioned media was analyzed. Finally, therapy efficacy on humanized SCID mice model of HCC was investigated. 5-ALA PDT induced a dose-dependent decrease in viability, with an up-to-four-fold reduction in viability of patient tumor hepatocytes. The 5-ALA PDT treated conditioned media induced immune cell clonal expansion. 5-ALA PDT has no impact on myofibroblasts in terms of viability, while their activation decreased cancer cell proliferation and reduced the tumor growth rate of the in vivo model. For the first time, 5-ALA PDT has been validated on primary patient tumor hepatocytes and donor healthy liver myofibroblasts. 5-ALA PDT may be an effective anti-HCC therapy, which might induce an anti-tumor immune response.

Keywords: 5-ALA; anti-tumor immunity; anti-tumor immunotherapy; hepatocellular carcinoma; photodynamic therapy.


Conflict of interest statement

The authors declare no conflict of interest.

Figures
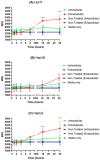
Figure 1
Figure 1
Fluorimetry-based protoporphyrin IX (PpIX) quantification of three HCC cell lines treated by 0.6 mM of 5-ALA for different incubation periods (0, 1, 2, 4, 8, 18, and 24 h). Extracellular PpIX levels were determined by fluorometric analysis of the conditioned media, while intracellular levels were measured by cells in fresh media. The values are represented in relative fluorescence units (RFU). A one-way ANOVA test was performed, with p ≤ 0.05 (*), p ≤ 0.01 (**), p ≤ 0.0001 (****) being considered statistically significant for the first and highly significant for the other (n = 2).
Figure 2
Figure 2
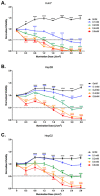
Viability analysis of HCC cell lines (A) HuH7, (B) Hep3B, and (C) HepG2 treated with different concentrations of 5-ALA and illumination doses at 24 h post illumination. The cells were Non-Treated or subjected to different 5-ALA concentrations (at 0 J/cm2, from 0 mM to 0.5 mM), or different illumination doses (at 0 mM of 5-ALA and up to 3.6 J/cm2) and illumination time variations (5 min, 10 min, 20 min, 30 min, 40 min, 50 min, 60 min), or were PDT-treated (within the same dose range) using a laser set-up at 635 nm with an irradiance rate of 1 mW/cm2. The viability readings were then normalized by the Non-Treated Control. A two-way ANOVA test was performed with p ≤ 0.01 (**), p ≤ 0.001 (***), and p ≤ 0.0001 (****) being considered statistically significant for the first and highly significant for the others (n = 3).
Figure 3
Figure 3
Proliferation assay of HCC cell lines treated by their respective IC50 dose, 24 h post illumination. The cells were subjected to no treatment (Non-Treated), 0.6 mM of 5-ALA only (5-ALA Only), 0.6 J/cm2 or 1.8 J/cm2 of illumination (Light Only), or were PDT Treated. The counts per minute (CPM) readings were then normalized by the Non-Treated control. A two-way ANOVA test was performed with p ≤ 0.05 (*), p ≤ 0.01 (**), p ≤ 0.001 (***), and p ≤ 0.0001 (****) being considered statistically significant for the first and highly significant for the others (n = 3).
Figure 4
Figure 4
Annexin-V/PI-based flow cytometry for analysis of the type of cell death induced by 5-ALA PDT for HuH7 cell line at (A) 1 h, (B) 4 h, and (C) 24 h post-illumination. The values are expressed as a percentage of the parent population, where the values were compared with the Non-Treated condition. Heat treatment (75 °C for 15 min) and staurosporine (10 µM for 18 h) were used as positive controls for necrosis and apoptosis, respectively. A two-way ANOVA test was performed, with p ≤ 0.05 (*), p ≤ 0.01 (**), and p ≤ 0.0001 (****) being considered statistically significant for the first and highly significant for the others (n = 3). (D) Representative flow cytometry plots showing the frequency of viable, necrotic, and apoptotic HuH7 cells, when subjected to no treatment, 5-ALA Only (0.6 mM for 4 h), Light Only (0.6 J/cm2), PDT Treated (0.6 mM 5-ALA for 4 h with 0.6 J/cm2 light dose), Heat Treated and Staurosporine Treated. Representative pseudocolor dot plot.
Figure 5
Figure 5
Lactate dehydrogenase (LDH- release-based cytotoxicity was analyzed for HCC cell lines treated by 5-ALA PDT at 0 h and 24 h post-illumination. The values are expressed as % Cytotoxicity, where the values were compared with those of the Non-Treated and positive control (treated by Triton-X). The percent cytotoxicity was determined by the formula described earlier. A two-way ANOVA test was performed, with p ≤ 0.00001 (****) being considered statistically significant for the first and highly significant for the others (n = 3).
Figure 6
Figure 6
(a) Impact of conditioned media on the proliferation of cancer cells. The data are represented in counts per minute (CPM) normalized with Non-Treated control. A two-way ANOVA test was performed, with ns considered as non-significant, p ≤ 0.05 (*), p ≤ 0.01 (**), p ≤ 0.001 (***), and p ≤ 0.0001 (****) being considered statistically significant for the first and highly significant for the others (n = 3). (b) Impact of conditioned media on the viability of cancer cells. The data are represented in viability normalized with Non-Treated control. A two-way ANOVA test was performed with p ≤ 0.05 (*), p ≤ 0.01 (**), p ≤ 0.001 (***), and p ≤ 0.0001 (****) being considered statistically sig-nificant for the first and highly significant for the others (n = 3).
Figure 6
Figure 6
(a) Impact of conditioned media on the proliferation of cancer cells. The data are represented in counts per minute (CPM) normalized with Non-Treated control. A two-way ANOVA test was performed, with ns considered as non-significant, p ≤ 0.05 (*), p ≤ 0.01 (**), p ≤ 0.001 (***), and p ≤ 0.0001 (****) being considered statistically significant for the first and highly significant for the others (n = 3). (b) Impact of conditioned media on the viability of cancer cells. The data are represented in viability normalized with Non-Treated control. A two-way ANOVA test was performed with p ≤ 0.05 (*), p ≤ 0.01 (**), p ≤ 0.001 (***), and p ≤ 0.0001 (****) being considered statistically sig-nificant for the first and highly significant for the others (n = 3).
Figure 7
Figure 7
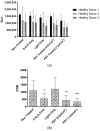
(a) Viability analysis of donor healthy liver myofibroblasts (HLMFs) treated with two doses of 5-ALA PDT (0.6 mM of 5-ALA with 0.6 J/cm2 and 1.8 J/cm2 of illumination dose) at 24 h post illumination. The values are expressed as relative luminescence units (RLU). A two-way ANOVA test was performed (n = 3). (b) Cellular proliferation analysis of primary healthy liver myofibroblasts (HLMFs) from three different donors treated with two doses of 5-ALA PDT (0.6 mM of 5-ALA with 0.6 J/cm2 and 1.8 J/cm2 of illumination dose) at 24 h post-illumination. The values are expressed as RLU. A two-way ANOVA test was performed, with p ≤ 0.05 (*), p ≤ 0.001 (**) and p ≤ 0.0001 (***) being considered statistically significant or highly significant, respectively. (n = 3).
Figure 8
Figure 8
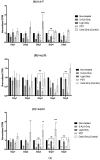
(a) Analysis of fibrosis of donor healthy liver myofibroblasts induced by 5-ALA PDT at two doses, 24 h post-illumination, using RT-qPCR-based gene expression analysis of collagen 1, α-smooth muscle actin (αSMA), tissue inhibitor of metalloproteinase 1 (TIMP1), HSP47, and matrix metallopeptidase 2 (MMP2) for different conditions, 24 h post-illumination. A two-way ANOVA test was performed (n = 3). (b) Analysis of fibrosis of donor healthy liver myofibroblasts induced by 5-ALA PDT at two doses, 24 h post-illumination, by ELISA-based analysis of collagen I secretion. A two-way ANVOVA test was performed, with p ≤ 0.05 (*), being considered statistically significant or highly significant. (n = 3).
Figure 9
Figure 9
(a) Impact of conditioned media from HCC cell lines, (A) HuH7, (B) Hep3B, and (C) HepG2, on the viability of activated human PBMCs. The data are represented in viability normalized with Non-Treated control. A two-way ANOVA test was performed, with p ≤ 0.05 (*), p ≤ 0.01 (**), p ≤ 0.001 (***) and p ≤ 0.0001 (****) being considered statistically significant or highly significant, respectively. (b) Impact of conditioned media from HCC cell lines, (A) HuH7, (B) Hep3B, and (C) HepG2, on the proliferation of activated human PBMCs. The data are represented in counts per minute (CPM) normalized with Non-Treated control. A two-way ANOVA test was performed, with p ≤ 0.05 (*), p ≤ 0.01 (**), and p ≤ 0.001 (***) and p ≤ 0.0001 (****) being considered statistically significant for the first and highly significant for the others (n = 3).
Figure 9
Figure 9
(a) Impact of conditioned media from HCC cell lines, (A) HuH7, (B) Hep3B, and (C) HepG2, on the viability of activated human PBMCs. The data are represented in viability normalized with Non-Treated control. A two-way ANOVA test was performed, with p ≤ 0.05 (*), p ≤ 0.01 (**), p ≤ 0.001 (***) and p ≤ 0.0001 (****) being considered statistically significant or highly significant, respectively. (b) Impact of conditioned media from HCC cell lines, (A) HuH7, (B) Hep3B, and (C) HepG2, on the proliferation of activated human PBMCs. The data are represented in counts per minute (CPM) normalized with Non-Treated control. A two-way ANOVA test was performed, with p ≤ 0.05 (*), p ≤ 0.01 (**), and p ≤ 0.001 (***) and p ≤ 0.0001 (****) being considered statistically significant for the first and highly significant for the others (n = 3).
Figure 10
Figure 10
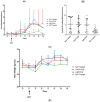
(a) (A) Normalized bioluminescence of SCID mice with humanized HCC tumor, treated with or without 5-ALA PDT, over the period from 2 days prior to illumination to 15 days post-illumination (n = 2) (B) Average normalized bioluminescence of different mice groups starting from day 0 to day 20 post-illumination. A two-way ANOVA test was performed, with p ≤ 0.05 (*) being considered statistically significant (n = 2). (b). Average of mice weight of different groups over the period from 2 days prior to illumination to 15 days post-illumination. (n = 2). For all the graphs, the circle corresponds to non-treated conditiond, the squares to treatment with 5-ALA only, the upward triangle to treatment with light only and the downward triangle to treatment with PDT.
Figure 11
Figure 11
Viability analysis of tumor hepatocytes from four different HCC patients treated with two different doses of 5-ALA PDT (0.6 mM of 5-ALA with 0.6 J/cm2 and 1.8 J/cm2 of illumination dose), at different time points post-illumination. The values are expressed as relative luminescence units (RLU). A two-way ANOVA test was performed, with p ≤ 0.05 (*), p ≤ 0.01 (**), p ≤ 0.001 (***), and p ≤ 0.0001 (****) being considered statistically significant for the first and highly significant for the others.

References

    1. Mittal S., El-Serag H.B. Epidemiology of HCC: Consider the Population. J. Clin. Gastroenterol. 2013;47:S2–S6. doi: 10.1097/MCG.0b013e3182872f29. - DOI - PMC - PubMed
    1. Marengo A., Rosso C., Bugianesi E. Liver Cancer: Connections with Obesity, Fatty Liver, and Cirrhosis. Annu. Rev. Med. 2016;67:103–117. doi: 10.1146/annurev-med-090514-013832. - DOI - PubMed
    1. Klungboonkrong V., Das D., McLennan G. Molecular Mechanisms and Targets of Therapy for Hepatocellular Carcinoma. J. Vasc. Interv. Radiol. 2017;28:949–955. doi: 10.1016/j.jvir.2017.03.002. - DOI - PubMed
    1. Lencioni R. Loco-Regional Treatment of Hepatocellular Carcinoma. Hepatology. 2010;52:762–773. doi: 10.1002/hep.23725. - DOI - PubMed
    1. Johnston M.P., Khakoo S.I. Immunotherapy for Hepatocellular Carcinoma: Current and Future. World J. Gastroenterol. 2019;25:2977–2989. doi: 10.3748/wjg.v25.i24.2977. - DOI - PMC - PubMed