LC-MS/MS-Based Serum Metabolomics and Transcriptome Analyses for the Mechanism of Augmented Renal Clearance
- PMID: 37445637
- PMCID: PMC10341629
- DOI: 10.3390/ijms241310459
LC-MS/MS-Based Serum Metabolomics and Transcriptome Analyses for the Mechanism of Augmented Renal Clearance
Abstract
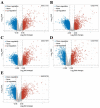
Augmented Renal Clearance (ARC) refers to the increased renal clearance of circulating solute in critically ill patients. In this study, the analytical research method of transcriptomics combined with metabolomics was used to study the pathogenesis of ARC at the transcriptional and metabolic levels. In transcriptomics, 534 samples from 5 datasets in the Gene Expression Omnibus database were analyzed and 834 differential genes associated with ARC were obtained. In metabolomics, we used Ultra-Performance Liquid Chromatography-Quadrupole Time-of-Flight Mass Spectrometry to determine the non-targeted metabolites of 102 samples after matching propensity scores, and obtained 45 differential metabolites associated with ARC. The results of the combined analysis showed that purine metabolism, arginine biosynthesis, and arachidonic acid metabolism were changed in patients with ARC. We speculate that the occurrence of ARC may be related to the alteration of renal blood perfusion by LTB4R, ARG1, ALOX5, arginine and prostaglandins E2 through inflammatory response, as well as the effects of CA4, PFKFB2, PFKFB3, PRKACB, NMDAR, glutamate and cAMP on renal capillary wall permeability.
Keywords: augmented renal clearance; metabolomics; transcriptome; vancomycin.
Conflict of interest statement
The authors declare no conflict of interest.
Figures


Similar articles
-
Discovery of potential biomarkers in acute kidney injury by ultra-high-performance liquid chromatography-tandem quadrupole time-of-flight mass spectrometry (UPLC-Q/TOF-MS).Int Urol Nephrol. 2021 Dec;53(12):2635-2643. doi: 10.1007/s11255-021-02829-3. Epub 2021 Mar 8. Int Urol Nephrol. 2021. PMID: 33686532
-
Study of the metabolomics characteristics of patients with metabolic syndrome based on liquid chromatography quadrupole time-of-flight mass spectrometry.Ann Endocrinol (Paris). 2018 Feb;79(1):37-44. doi: 10.1016/j.ando.2017.05.005. Epub 2017 Dec 13. Ann Endocrinol (Paris). 2018. PMID: 29246383
-
Region identification of Xinyang Maojian tea using UHPLC-Q-TOF/MS-based metabolomics coupled with multivariate statistical analyses.J Food Sci. 2021 May;86(5):1681-1691. doi: 10.1111/1750-3841.15676. Epub 2021 Apr 2. J Food Sci. 2021. PMID: 33798265
-
[Advances in liquid chromatography-mass spectrometry analysis of several important secondary metabolites in plant metabolomics].Sheng Wu Gong Cheng Xue Bao. 2022 Oct 25;38(10):3674-3681. doi: 10.13345/j.cjb.220488. Sheng Wu Gong Cheng Xue Bao. 2022. PMID: 36305402 Review. Chinese.
-
Mass spectrometric based approaches in urine metabolomics and biomarker discovery.Mass Spectrom Rev. 2017 Mar;36(2):115-134. doi: 10.1002/mas.21455. Epub 2015 Apr 16. Mass Spectrom Rev. 2017. PMID: 25881008 Review.
Cited by
-
Evaluation of the Efficacy of a Nomogram to Predict Multidrug-Resistant Pulmonary Infections Based on Data from Neurosurgery Ward Patients.Infect Drug Resist. 2025 Jul 26;18:3723-3734. doi: 10.2147/IDR.S527114. eCollection 2025. Infect Drug Resist. 2025. PMID: 40741530 Free PMC article.
-
Multi-Omics and -Organ Insights into Energy Metabolic Adaptations in Early Sepsis Onset.Adv Sci (Weinh). 2025 Aug;12(30):e04418. doi: 10.1002/advs.202504418. Epub 2025 May 24. Adv Sci (Weinh). 2025. PMID: 40411399 Free PMC article.
-
Determination of nine prostaglandins in the arachidonic acid metabolic pathway with UHPLC-QQQ-MS/MS and application to in vitro and in vivo inflammation models.Front Pharmacol. 2025 May 30;16:1595059. doi: 10.3389/fphar.2025.1595059. eCollection 2025. Front Pharmacol. 2025. PMID: 40520189 Free PMC article.
References
-
- Cojutti P.G., Lazzarotto D., Candoni A., Dubbini M.V., Zannier M.E., Fanin R., Pea F. Real-Time TDM-Based Optimization of Continuous-Infusion Meropenem for Improving Treatment Outcome of Febrile Neutropenia in Oncohaematological Patients: Results from a Prospective, Monocentric, Interventional Study. J. Antimicrob. Chemother. 2020;75:3029–3037. doi: 10.1093/jac/dkaa267. - DOI - PMC - PubMed
-
- De Waele J.J., Dumoulin A., Janssen A., Hoste E.A. Epidemiology of Augmented Renal Clearance in Mixed ICU Patients. Minerva Anestesiol. 2015;81:1079–1085. - PubMed
MeSH terms
Substances
Grants and funding
LinkOut - more resources
Full Text Sources
Research Materials
Miscellaneous

