. 2023 Jun 22;24(13):10474.
doi: 10.3390/ijms241310474.

LRRK2 Knockout Confers Resistance in HEK-293 Cells to Rotenone-Induced Oxidative Stress, Mitochondrial Damage, and Apoptosis

Affiliations

LRRK2 Knockout Confers Resistance in HEK-293 Cells to Rotenone-Induced Oxidative Stress, Mitochondrial Damage, and Apoptosis

Diana Alejandra Quintero-Espinosa et al. Int J Mol Sci. .

Abstract

Leucine-rich repeat kinase 2 (LRRK2) has been linked to dopaminergic neuronal vulnerability to oxidative stress (OS), mitochondrial impairment, and increased cell death in idiopathic and familial Parkinson's disease (PD). However, how exactly this kinase participates in the OS-mitochondria-apoptosis connection is still unknown. We used clustered regularly interspaced short palindromic repeats (CRISPR)/Cas9 LRRK2 knockout (KO) in the human embryonic kidney cell line 293 (HEK-293) to evaluate the cellular response to the mitochondrial inhibitor complex I rotenone (ROT), a well-known OS and cell death inducer. We report successful knockout of the LRRK2 gene in HEK-293 cells using CRISPR editing (ICE, approximately 60%) and flow cytometry (81%) analyses. We found that HEK-293 LRRK2 WT cells exposed to rotenone (ROT, 50 μM) resulted in a significant increase in intracellular reactive oxygen species (ROS, +7400%); oxidized DJ-1-Cys106-SO3 (+52%); phosphorylation of LRRK2 (+70%) and c-JUN (+171%); enhanced expression of tumor protein (TP53, +2000%), p53 upregulated modulator of apoptosis (PUMA, +1950%), and Parkin (PRKN, +22%); activation of caspase 3 (CASP3, +8000%), DNA fragmentation (+35%) and decreased mitochondrial membrane potential (ΔΨm, -58%) and PTEN induced putative kinase 1 (PINK1, -49%) when compared to untreated cells. The translocation of the cytoplasmic fission protein dynamin-related Protein 1 (DRP1) to mitochondria was also observed by colocalization with translocase of the outer membrane 20 (TOM20). Outstandingly, HEK-293 LRRK2 KO cells treated with ROT showed unaltered OS and apoptosis markers. We conclude that loss of LRRK2 causes HEK-293 to be resistant to ROT-induced OS, mitochondrial damage, and apoptosis in vitro. Our data support the hypothesis that LRRK2 acts as a proapoptotic kinase by regulating mitochondrial proteins (e.g., PRKN, PINK1, DRP1, and PUMA), transcription factors (e.g., c-JUN and TP53), and CASP3 in cells under stress conditions. Taken together, these observations suggest that LRRK2 is an important kinase in the pathogenesis of PD.

Keywords: Leucine-rich repeat kinase 2; apoptosis; clustered regularly interspaced short palindromic repeats; gene edition; human embryonic kidney cell line 293; knockout; oxidative stress; rotenone.


Conflict of interest statement

The authors declare no conflict of interest.

Figures
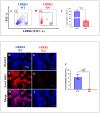
Figure 1
Figure 1
LRRK2 KO decreases the expression of LRRK2 protein. (A,B) Representative flow cy-tometry contour plots show total LRRK2 protein in LRRK2 WT and LRRK2 KO cells. (C) Percent-age of total LRRK2 protein in LRRK2 WT and LRRK2 KO cells. The data are presented as the mean ± SD of three independent experiments (n = 3). Student’s t-test: Statistically significant differences when *** p < 0.001. Additionally, HEK-293 LRRK2 WT cells and KO cells were stained with Hoechst 33342 (D,E), primary antibodies against total-LRRK2 (F,G), and merged (H,I). Positive blue fluorescence reflects nuclei, and positive red fluorescence reflects total-LRRK2. (J) Quantification of the mean fluorescence intensity (MFI) in WT and KO cells. The figures represent one out of three independent experiments. One-way ANOVA, post hoc test Bonferroni. The data are expressed as the mean ± SD; *** p < 0.001. Image magnification, 200×.
Figure 2
Figure 2
LRRK2 KO induces no significant ΔΨm damage, ROS production, or nuclear fragmentation. (A,B) Representative histograms showing the percentage of MitoTracker flow cytometry (FC) analysis from untreated HEK-293 LRRK2 WT and HEK-293 LRRK2 KO cells or cells treated with ROT (1, 5, 10, and 50 µM) at 6 h at 37 °C. (C) Percentage of MitoTracker in LRRK2 WT and LRRK2 KO untreated or treated with ROT. (D,E) Representative histograms showing the percentage of DCF flow cytometry analysis from untreated HEK-293 LRRK2 WT and LRRK2 KO cells or cells treated with ROT. (F) Percentage of DCF in LRRK2 WT and LRRK2 KO untreated or treated with ROT. (G,H) Representative histograms showing the percentage of SubG1 flow cytometry analysis from untreated HEK-293 LRRK2 WT and LRRK2 KO cells or cells treated with ROT. (I) Percentage of SubG1 in LRRK2 WT and LRRK2 KO untreated or treated with ROT. The image represents one of three independent experiments. The data are presented as the mean ± SD of three independent experiments (n = 3). Two-way ANOVA followed by Bonferroni’s test: Statistically significant differences when *** p < 0.001. ns: no significance. (JY) Representative fluorescence microscopy photographs showing untreated LRRK2 WT cells and KO cells or treated with ROT (50 μM) for 6 h and stained with MitoTracker (JM), DCFH2DA (NQ), Hoechst (RU), and merged (VY). Positive red fluorescence reflects mitochondrial membrane potential (ΔΨm), positive green DCF fluorescence reflects the cytoplasmic presence of reactive oxygen species (ROS), and positive blue fluorescence reflects nuclei. (Z,AA) Quantification of the Mitotracker and DCFH2DA mean fluorescence intensity (MFI), respectively, in LRRK2 WT and KO cells. The figures represent one out of three independent experiments. One-way ANOVA, followed by Tukey’s test. Statistically significant differences when *** p < 0.001. Image magnification, 200×. The image represents one out of three independent experiments (n = 3).
Figure 2
Figure 2
LRRK2 KO induces no significant ΔΨm damage, ROS production, or nuclear fragmentation. (A,B) Representative histograms showing the percentage of MitoTracker flow cytometry (FC) analysis from untreated HEK-293 LRRK2 WT and HEK-293 LRRK2 KO cells or cells treated with ROT (1, 5, 10, and 50 µM) at 6 h at 37 °C. (C) Percentage of MitoTracker in LRRK2 WT and LRRK2 KO untreated or treated with ROT. (D,E) Representative histograms showing the percentage of DCF flow cytometry analysis from untreated HEK-293 LRRK2 WT and LRRK2 KO cells or cells treated with ROT. (F) Percentage of DCF in LRRK2 WT and LRRK2 KO untreated or treated with ROT. (G,H) Representative histograms showing the percentage of SubG1 flow cytometry analysis from untreated HEK-293 LRRK2 WT and LRRK2 KO cells or cells treated with ROT. (I) Percentage of SubG1 in LRRK2 WT and LRRK2 KO untreated or treated with ROT. The image represents one of three independent experiments. The data are presented as the mean ± SD of three independent experiments (n = 3). Two-way ANOVA followed by Bonferroni’s test: Statistically significant differences when *** p < 0.001. ns: no significance. (JY) Representative fluorescence microscopy photographs showing untreated LRRK2 WT cells and KO cells or treated with ROT (50 μM) for 6 h and stained with MitoTracker (JM), DCFH2DA (NQ), Hoechst (RU), and merged (VY). Positive red fluorescence reflects mitochondrial membrane potential (ΔΨm), positive green DCF fluorescence reflects the cytoplasmic presence of reactive oxygen species (ROS), and positive blue fluorescence reflects nuclei. (Z,AA) Quantification of the Mitotracker and DCFH2DA mean fluorescence intensity (MFI), respectively, in LRRK2 WT and KO cells. The figures represent one out of three independent experiments. One-way ANOVA, followed by Tukey’s test. Statistically significant differences when *** p < 0.001. Image magnification, 200×. The image represents one out of three independent experiments (n = 3).
Figure 3
Figure 3
LRRK2 KO shows almost no oxidation of DJ-1 in the presence of ROT. (A,B) Representative flow cytometry contour plots showing oxidized protein DJ-1 (DJ-1 Cys106-SO3) in LRRK2 WT and LRRK2 KO untreated or treated with ROT (50 μM). (C) Percentage of oxDJ-1 (DJ-1 Cys106-SO3) in LRRK2 WT and LRRK2 KO cells untreated or treated with ROT. (DO) Representative fluorescence microscopy photographs showing untreated LRRK2 WT cells and KO cells, or treated with ROT (50 μM) for 6 h and stained with Hoechst (DG), primary antibodies against oxDJ-1 (HK), and merged (LO). Positive blue fluorescence reflects nuclei, and positive green fluorescence reflects the cytoplasmic presence of oxDJ-1 protein. (P) Quantification of the oxDJ-1 mean fluorescence intensity (MFI) in LRRK2 WT and KO cells. The figures represent one out of three independent experiments. One-way ANOVA, followed by Tukey’s test. The data are expressed as the mean ± SD; *** p < 0.001. Image magnification, 200×.
Figure 4
Figure 4
LRRK2 KO shows no significant p-S935-LRRK2 when exposed to ROT. (A,B) Representative flow cytometry contour plots show phosphorylated LRRK2 at residue S935 in LRRK2 WT and LRRK2 KO untreated or treated with ROT (50 μM). (C) Percentage of p-S935-LRRK2 in LRRK2 WT and LRRK2 KO untreated or treated with ROT. The data are presented as the mean ± SD of three independent experiments (n = 3). One-way ANOVA followed by Tukey’s test: statistically significant differences when *** p < 0.001. ns: no significance. (DO) Representative fluorescence microscopy photographs showing untreated LRRK2 WT cells and KO cells or treated with ROT (50 μM) for 6 h and stained with Hoechst (DG), primary antibodies against p-S935-LRRK2 (HK), and merged (LO). Positive blue fluorescence reflects nuclei, and positive green fluorescence reflects the cytoplasmic presence of p-S935-LRRK2 protein. (P) Quantification of the p-S935-LRRK2 mean fluorescence intensity (MFI) in LRRK2 WT and KO cells. The data are presented as the mean ± SD of three independent experiments (n = 3). One-way ANOVA followed by Tukey’s test: statistically significant differences when ** p < 0.01, *** p < 0.001. Image magnification, 200×.
Figure 5
Figure 5
LRRK2 KO upregulates PINK1 but not PRKN under ROT stimuli. (A,B) Representative flow cytometry contour plots show HEK-293 LRRK2 WT and LRRK2 KO cells untreated or treated with ROT (50 µM) labeled with primary antibodies against TOM20. (C) Percentage of TOM20. (D,E) Representative flow cytometry contour plots show LRRK2 WT and LRRK2 KO cells untreated or treated with ROT (50 µM) labeled with primary antibodies against PRKN. (F) Percentage of PRKN. (G,H) Representative flow cytometry contour plots show LRRK2 WT and LRRK2 KO cells untreated or treated with ROT (50 µM) labeled with primary antibodies against PINK1. (I) Percentage of PINK1. The data are presented as the mean ± SD of three independent experiments (n = 3). One-way ANOVA followed by Tukey’s test: Statistically significant differences when ** p < 0.01, and *** p < 0.001; ns: no significance. In addition, HEK-293 WT LRRK2 cells and KO cells were stained Hoechst (JM,WZ), primary antibodies against PRKN (NQ), and merged (RU), PINK1 (AAAD), and merged (AEAH). Positive blue fluorescence reflects nuclei, positive green fluorescence reflects the cytoplasmic presence of PRKN protein, and positive red fluorescence reflects the presence of PINK1 protein. (V,AI) Quantification of the PRKN and PINK1 mean fluorescence intensity (MFI) in LRRK2 WT and KO cells. The figures represent one out of three independent experiments, followed by Tukey’s test: Statistically significant differences when * p < 0.05, ** p < 0.01, and *** p < 0.001. Image magnification, 200×.
Figure 5
Figure 5
LRRK2 KO upregulates PINK1 but not PRKN under ROT stimuli. (A,B) Representative flow cytometry contour plots show HEK-293 LRRK2 WT and LRRK2 KO cells untreated or treated with ROT (50 µM) labeled with primary antibodies against TOM20. (C) Percentage of TOM20. (D,E) Representative flow cytometry contour plots show LRRK2 WT and LRRK2 KO cells untreated or treated with ROT (50 µM) labeled with primary antibodies against PRKN. (F) Percentage of PRKN. (G,H) Representative flow cytometry contour plots show LRRK2 WT and LRRK2 KO cells untreated or treated with ROT (50 µM) labeled with primary antibodies against PINK1. (I) Percentage of PINK1. The data are presented as the mean ± SD of three independent experiments (n = 3). One-way ANOVA followed by Tukey’s test: Statistically significant differences when ** p < 0.01, and *** p < 0.001; ns: no significance. In addition, HEK-293 WT LRRK2 cells and KO cells were stained Hoechst (JM,WZ), primary antibodies against PRKN (NQ), and merged (RU), PINK1 (AAAD), and merged (AEAH). Positive blue fluorescence reflects nuclei, positive green fluorescence reflects the cytoplasmic presence of PRKN protein, and positive red fluorescence reflects the presence of PINK1 protein. (V,AI) Quantification of the PRKN and PINK1 mean fluorescence intensity (MFI) in LRRK2 WT and KO cells. The figures represent one out of three independent experiments, followed by Tukey’s test: Statistically significant differences when * p < 0.05, ** p < 0.01, and *** p < 0.001. Image magnification, 200×.
Figure 6
Figure 6
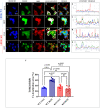
TOM20 and DRP1 do not colocalize in LRRK2 KO cells exposed to ROT. (AX) Representative fluorescence microscopy photographs showing untreated LRRK2 WT cells and KO cells, or cells treated with ROT (50 μM) for 6 h that were labeled with Hoechst (A,G,M,S), primary antibodies against TOM20 (B,H,N,T), and DRP1 (C,I,O,U). Positive blue fluorescence reflects nuclei, positive green fluorescence reflects TOM20 protein, and positive red reflects TOM20 protein. Colocalization images (D,J,P,V) were used to select the merge image (broken square in panels E,K,Q,W) and calculate the intensity profile (F,L,R,X) by using Zen v.3.1 (Zeiss microscope software, Zeiss, Jena, Germany). Intensity (y-axis) was mapped against distance (μm x-axis) in the cell. The overlapping of green and red intensity histograms represents the colocalization of TOM20 and DRP1 (e.g., panel L). The percentage of positive colocalization (Y) was calculated as the colocalized area of each marker/total area on HEK293 LRRK2 WT and LRRK2 KO cells. The image represents one out of three independent experiments (n = 3). Experiments were performed in triplicate in three independent experiments. Dunnett’s T3 test. *** p < 0.001. ns: no significance. The data are presented as mean ± SD of three independent experiments. Image magnification, 400×.
Figure 7
Figure 7
LRRK2 KO induces no activation of pro-apoptosis proteins under ROT stimuli. (A,B) Representative flow cytometry contour plots show HEK-293 LRRK2 WT and LRRK2 KO cells untreated or treated with ROT (50 µM) and stained with primary antibodies against c-JUN; (C) Percentage of pS65-c-JUN; (D,E) Representative flow cytometry contour plots show LRRK2 WT and LRRK2 KO cells untreated or treated with ROT (50 µM) and stained with primary antibodies against TP53. (F) Percentage of TP53. (G,H) Representative flow cytometry contour plots showing LRRK2 WT and LRRK2 KO cells untreated or treated with ROT (50 µM) stained with primary antibodies against PUMA. (I) Percentage of PUMA. (J,K) Representative flow cytometry contour plots show LRRK2 WT and LRRK2 KO cells untreated or treated with ROT (50 µM) stained with primary antibodies against CASP3. (L) Percentage of CASP3. The data are presented as the mean ± SD of three independent experiments (n = 3). One-way ANOVA followed by Tukey’s test or Dunnett’s T3 test: statistically significant differences when ** p < 0.01, and *** p < 0.001. ns: no significance. (MBK) Representative fluorescence microscopy photographs showing untreated LRRK2 WT cells and KO cells or treated with ROT (50 µM) for 6 h and stained with Hoechst (MP,ZAC,AMAP,AZBC), primary antibodies against p-S65-c-JUN (QT), merged (UY), TP53 (ADAG), merged (AHAK), PUMA (AQAT), merged (AUAX), and CASP3 (BDBG), and merged (BHBK). Positive blue fluorescence reflects nuclei, positive red fluorescence reflects p-S65-c-JUN and TP53, and positive green fluorescence reflects PUMA and CASP3. Quantification of p-S65-cJUN (Y), TP53 (AL), PUMA (AY), and CASP3 (BL) mean fluorescence intensity (MFI) in WT and KO cells. The data are presented as the mean ± SD of three independent experiments (n = 3). One-way ANOVA followed by Tukey’s test: Statistically significant differences when ** p < 0.01, *** p < 0.001. Image magnification, 200×.
Figure 7
Figure 7
LRRK2 KO induces no activation of pro-apoptosis proteins under ROT stimuli. (A,B) Representative flow cytometry contour plots show HEK-293 LRRK2 WT and LRRK2 KO cells untreated or treated with ROT (50 µM) and stained with primary antibodies against c-JUN; (C) Percentage of pS65-c-JUN; (D,E) Representative flow cytometry contour plots show LRRK2 WT and LRRK2 KO cells untreated or treated with ROT (50 µM) and stained with primary antibodies against TP53. (F) Percentage of TP53. (G,H) Representative flow cytometry contour plots showing LRRK2 WT and LRRK2 KO cells untreated or treated with ROT (50 µM) stained with primary antibodies against PUMA. (I) Percentage of PUMA. (J,K) Representative flow cytometry contour plots show LRRK2 WT and LRRK2 KO cells untreated or treated with ROT (50 µM) stained with primary antibodies against CASP3. (L) Percentage of CASP3. The data are presented as the mean ± SD of three independent experiments (n = 3). One-way ANOVA followed by Tukey’s test or Dunnett’s T3 test: statistically significant differences when ** p < 0.01, and *** p < 0.001. ns: no significance. (MBK) Representative fluorescence microscopy photographs showing untreated LRRK2 WT cells and KO cells or treated with ROT (50 µM) for 6 h and stained with Hoechst (MP,ZAC,AMAP,AZBC), primary antibodies against p-S65-c-JUN (QT), merged (UY), TP53 (ADAG), merged (AHAK), PUMA (AQAT), merged (AUAX), and CASP3 (BDBG), and merged (BHBK). Positive blue fluorescence reflects nuclei, positive red fluorescence reflects p-S65-c-JUN and TP53, and positive green fluorescence reflects PUMA and CASP3. Quantification of p-S65-cJUN (Y), TP53 (AL), PUMA (AY), and CASP3 (BL) mean fluorescence intensity (MFI) in WT and KO cells. The data are presented as the mean ± SD of three independent experiments (n = 3). One-way ANOVA followed by Tukey’s test: Statistically significant differences when ** p < 0.01, *** p < 0.001. Image magnification, 200×.

Similar articles

Cited by

References

    1. Berwick D.C., Heaton G.R., Azeggagh S., Harvey K. LRRK2 Biology from structure to dysfunction: Research progresses, but the themes remain the same. Mol. Neurodegener. 2019;14:49. doi: 10.1186/s13024-019-0344-2. - DOI - PMC - PubMed
    1. Wauters L., Versées W., Kortholt A. Roco Proteins: GTPases with a Baroque Structure and Mechanism. Int. J. Mol. Sci. 2019;20:147. doi: 10.3390/ijms20010147. - DOI - PMC - PubMed
    1. Paisán-Ruíz C., Jain S., Evans E.W., Gilks W.P., Simón J., van der Brug M., López de Munain A., Aparicio S., Gil A.M., Khan N., et al. Cloning of the gene containing mutations that cause PARK8-linked Parkinson’s disease. Neuron. 2004;44:595–600. doi: 10.1016/j.neuron.2004.10.023. - DOI - PubMed
    1. Deng H., Le W., Guo Y., Hunter C.B., Xie W., Huang M., Jankovic J. Genetic analysis of LRRK2 mutations in patients with Parkinson disease. J. Neurol. Sci. 2006;251:102–106. doi: 10.1016/j.jns.2006.09.017. - DOI - PubMed
    1. Cornejo-Olivas M., Torres L., Velit-Salazar M.R., Inca-Martinez M., Mazzetti P., Cosentino C., Micheli F., Perandones C., Dieguez E., Raggio V., et al. Variable frequency of LRRK2 variants in the Latin American research consortium on the genetics of Parkinson’s disease (LARGE-PD), a case of ancestry. NPJ Park. Dis. 2017;3:19. doi: 10.1038/s41531-017-0020-6. - DOI - PMC - PubMed

MeSH terms