. 2023 Jun 24;24(13):10589.
doi: 10.3390/ijms241310589.

Rotenone Blocks the Glucocerebrosidase Enzyme and Induces the Accumulation of Lysosomes and Autophagolysosomes Independently of LRRK2 Kinase in HEK-293 Cells

Affiliations

Rotenone Blocks the Glucocerebrosidase Enzyme and Induces the Accumulation of Lysosomes and Autophagolysosomes Independently of LRRK2 Kinase in HEK-293 Cells

Laura Patricia Perez-Abshana et al. Int J Mol Sci. .

Abstract

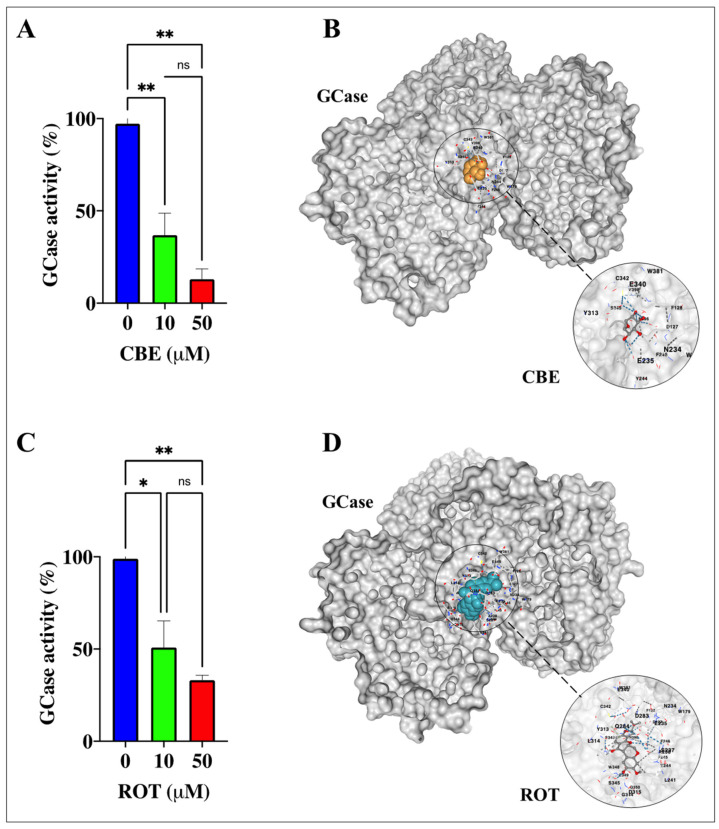
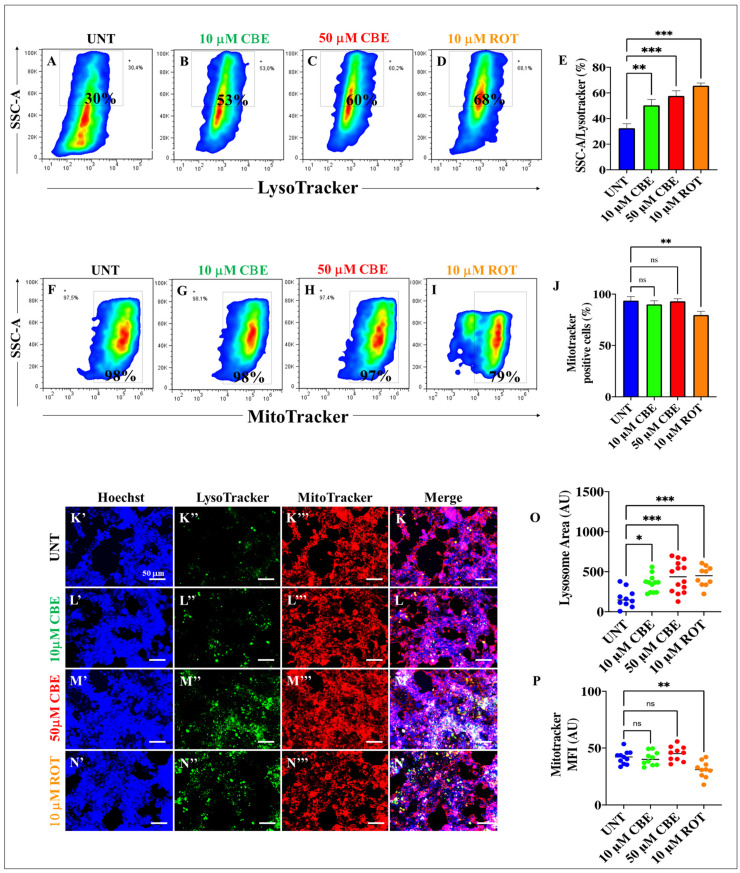
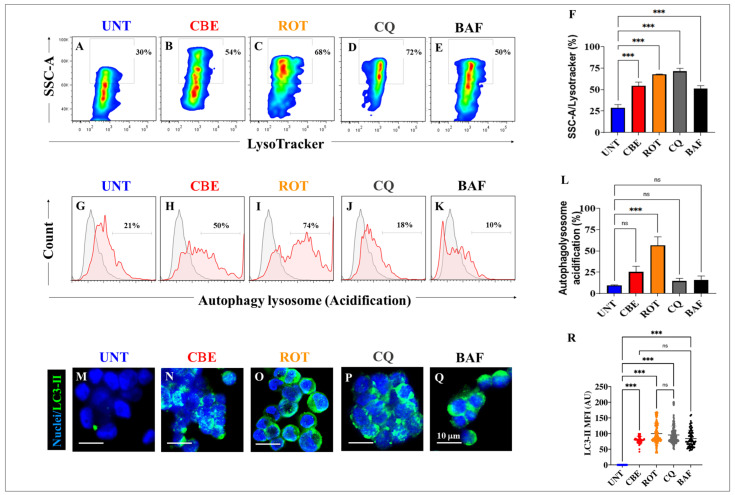
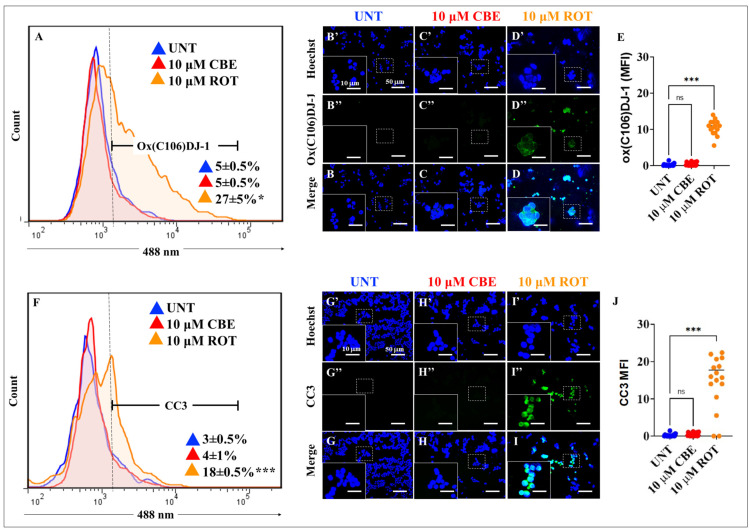
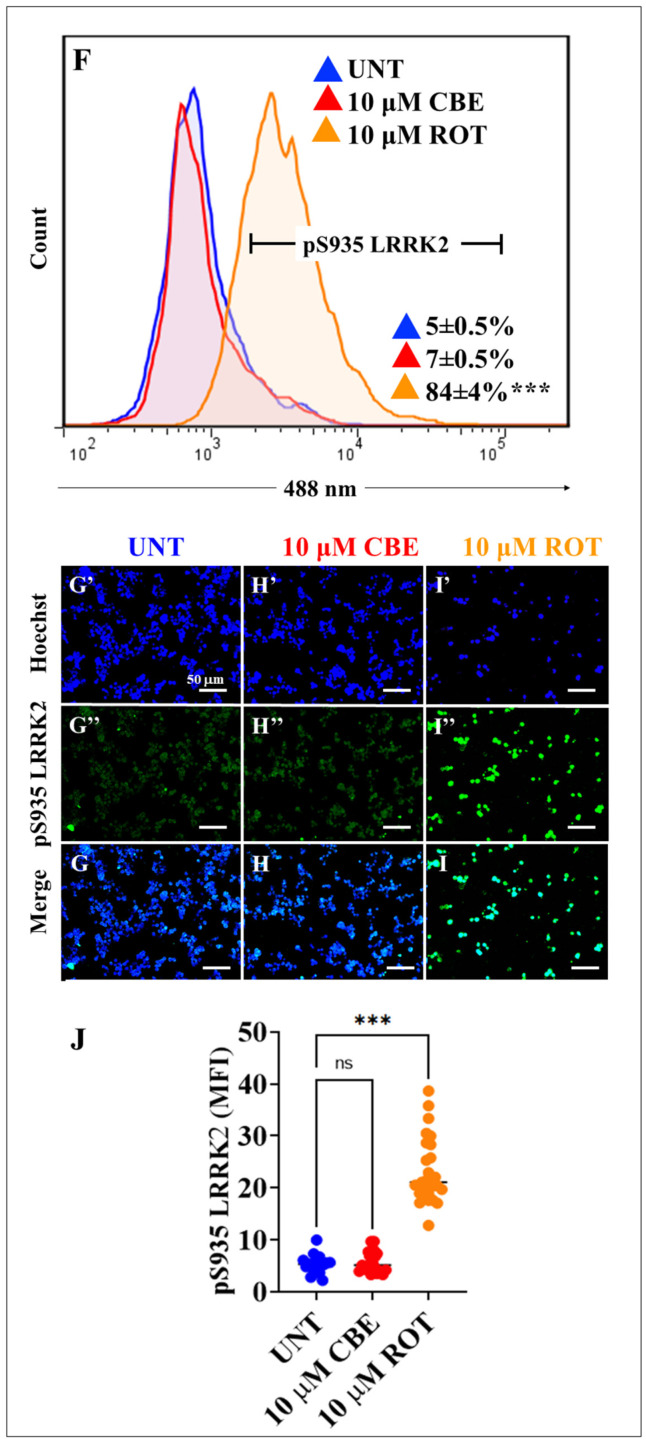
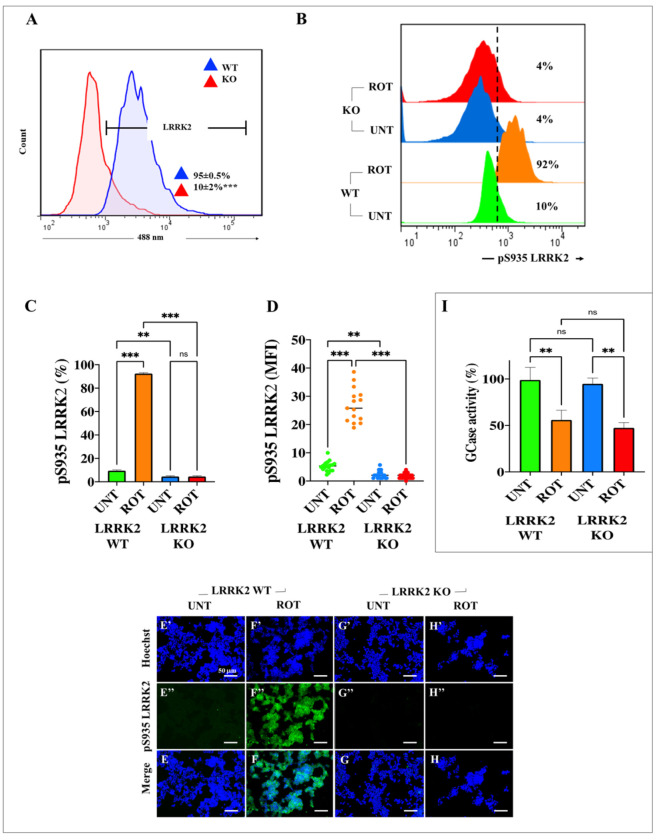
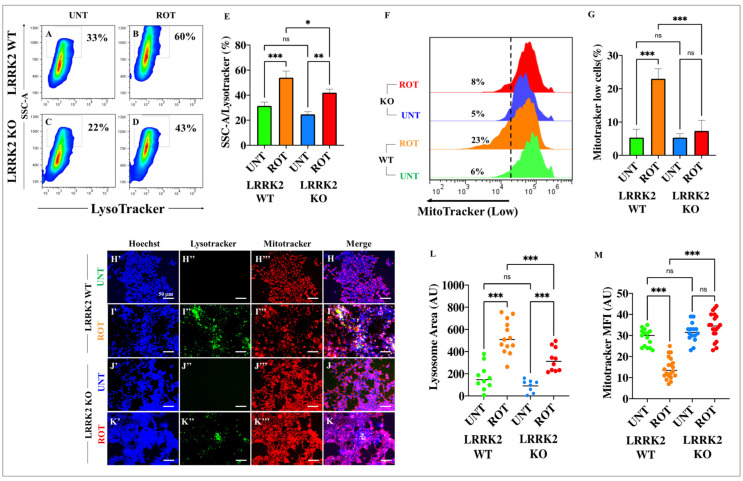
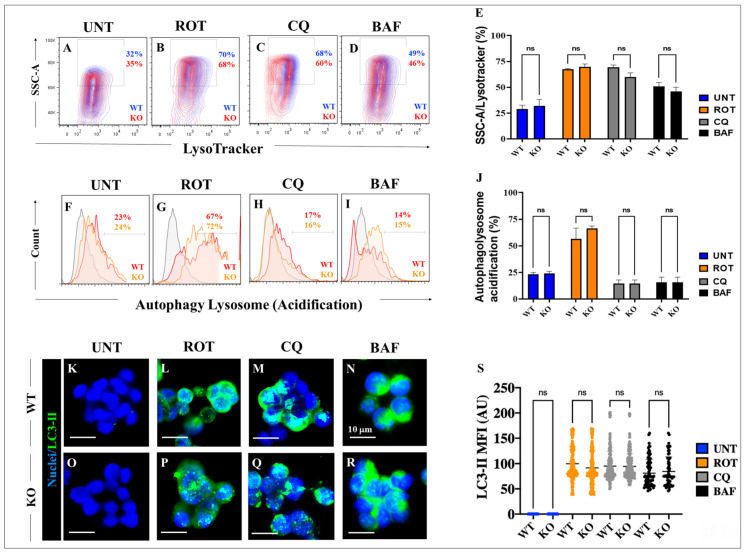
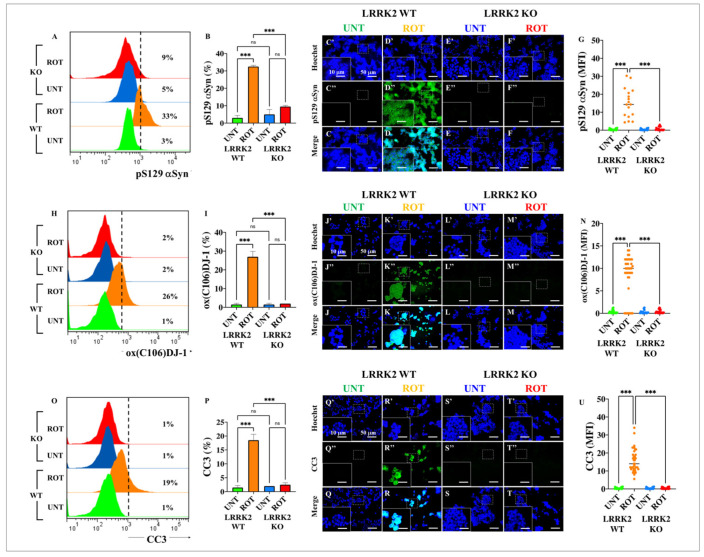
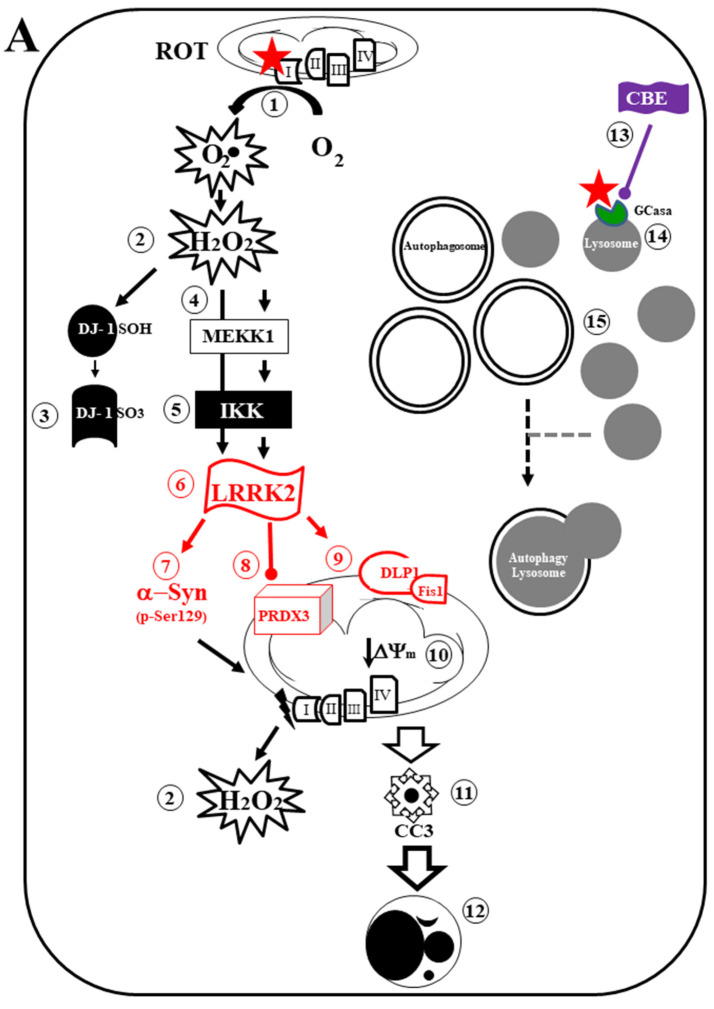
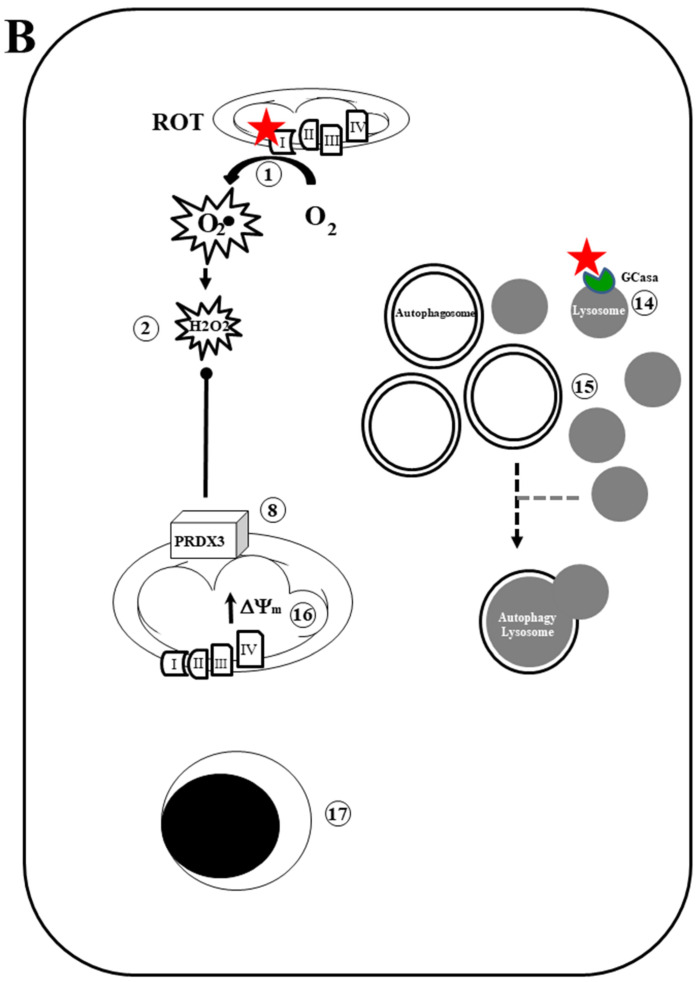
Parkinson's disease (PD) is a neurodegenerative disorder caused by the progressive loss of dopaminergic (DAergic) neurons in the substantia nigra and the intraneuronal presence of Lewy bodies (LBs), composed of aggregates of phosphorylated alpha-synuclein at residue Ser129 (p-Ser129α-Syn). Unfortunately, no curative treatment is available yet. To aggravate matters further, the etiopathogenesis of the disorder is still unresolved. However, the neurotoxin rotenone (ROT) has been implicated in PD. Therefore, it has been widely used to understand the molecular mechanism of neuronal cell death. In the present investigation, we show that ROT induces two convergent pathways in HEK-293 cells. First, ROT generates H2O2, which, in turn, either oxidizes the stress sensor protein DJ-Cys106-SH into DJ-1Cys106SO3 or induces the phosphorylation of the protein LRRK2 kinase at residue Ser395 (p-Ser395 LRRK2). Once active, the kinase phosphorylates α-Syn (at Ser129), induces the loss of mitochondrial membrane potential (ΔΨm), and triggers the production of cleaved caspase 3 (CC3), resulting in signs of apoptotic cell death. ROT also reduces glucocerebrosidase (GCase) activity concomitant with the accumulation of lysosomes and autophagolysosomes reflected by the increase in LC3-II (microtubule-associated protein 1A/1B-light chain 3-phosphatidylethanolamine conjugate II) markers in HEK-293 cells. Second, the exposure of HEK-293 LRRK2 knockout (KO) cells to ROT displays an almost-normal phenotype. Indeed, KO cells showed neither H2O2, DJ-1Cys106SO3, p-Ser395 LRRK2, p-Ser129α-Syn, nor CC3 but displayed high ΔΨm, reduced GCase activity, and the accumulation of lysosomes and autophagolysosomes. Similar observations are obtained when HEK-293 LRRK2 wild-type (WT) cells are exposed to the inhibitor GCase conduritol-β-epoxide (CBE). Taken together, these observations imply that the combined development of LRRK2 inhibitors and compounds for recovering GCase activity might be promising therapeutic agents for PD.

Keywords: HEK-293; LRRK2; Parkinson’s; autophagy; conduritol-β-epoxide; glucocerebrosidase; rotenone.


Conflict of interest statement

The authors declare no conflict of interest.

Figures

Figure 1
Figure 1
Evaluation of glucocerebrosidase (GCase) activity in HEK-293 cells exposed to conduritol-β-epoxide (CBE) and rotenone (ROT): a molecular docking analysis. (A) Analysis of GCase activity in HEK-293 cells exposed to CBE (0, 10, and 50 μM). (B) Representative CB-Dock2 3D images showing the molecular docking of GCase (PDB: 6T13) with CBE (PubChem CID 119054). (C) Analysis of GCase activity in HEK-293 cells exposed to ROT (0, 10, and 50 μM). (D) Representative CB-Dock2 3D images showing the molecular docking of GCase (PDB: 6T13) with ROT (PubChem CID 6758). The data are expressed as mean ± SD; * p < 0.05; ** p < 0.01; ns—not significant. Bars represent 1 out of 3 independent experiments (n = 3).
Figure 2
Figure 2
Rotenone (ROT) and conduritol-β-epoxide (CBE) induce accumulation of lysosomes, but rotenone diminishes mitochondrial membrane potential (ΔΨm) only in HEK-293 cells. Representative density 2D plots showing SSC-A/LysoTracker analysis (lysosomes) in untreated cells (A) or treated with (10 μM) CBE (B), (50 μM) CBE (C), or (10 μM) ROT (D). Quantitative analysis of SSC-A/LysoTracker-positive cells (E). Representative density 2D plots showing SSC-A/MitoTracker analysis of untreated cells (F) or cells treated with (10 μM) CBE (G), (50 μM) CBE (H), or (10 μM) ROT (I). Quantitative analysis of SSC-A/MitoTracker-positive cells (J). The formation of acidic vacuoles was determined as described in Section 4. The percentage is the number of events for positive staining for acidic vacuoles in the upper-left quadrants (AD,FI), and color contrast indicates cell population density: dark blue < light blue < green < yellow < red. Representative fluorescence images showing Hoechst (K′N′), LysoTracker (K″N″), MitoTracker (K‴N‴), and merge (KN) of untreated HEK-293 cells (K) or cells treated with (10 μM) CBE (L), (50 μM) CBE (M), or (10 μM) ROT (N). Quantitative analysis of LysoTracker-stained area (O). Quantitative analysis of MitoTracker mean fluorescence intensity (P). The data are expressed as mean ± SD; * p < 0.05; ** p < 0.01; *** p < 0.001; ns—not significant. The smooth dot plots, bars, and photomicrographs represent 1 out of 3 independent experiments (n = 3). Image magnification, 20×.
Figure 3
Figure 3
Rotenone (ROT) and conduritol-β-epoxide (CBE) induce accumulation of lysosomes and phagolysosomes in HEK-293 cells. Representative density 2D plots showing SSC-A/LysoTracker analysis (lysosomes) in untreated cells (A) or cells treated with (10 μM) CBE (B), (10 μM) ROT (C), (10 μM) chloroquine (CQ) (D), or (10 nM) bafilomycin A1 (BAF) (E). Quantitative analysis of SSC-A/LysoTracker-positive cells (F). Representative density 2D plots showing the autophagy–lysosome acidification of untreated cells (G) or cells treated with (10 μM) CBE (H), (10 μM) ROT (I), (10 μM) chloroquine (CQ) (J), or (10 nM) bafilomycin A1 (BAF) (K). Quantitative analysis of autophagy–lysosome-acidification-positive cells (L). The formation of acidic vacuoles was determined as described in Section 4. The percentage is the number of events for positive staining for acidic vacuoles in the upper-left quadrants (AE), and color contrast indicates cell population density: dark blue < light blue < green < yellow < red. Representative immunofluorescence images showing LC3-II reactivity in untreated cells (M) or cells treated with (10 μM) CBE (N), (10 μM) ROT (O), (10 μM) chloroquine (CQ) (P), or (10 nM) bafilomycin A1 (BAF) (Q). Quantitative analysis of LC3-II mean fluorescence intensity (R). The data are expressed as mean ± SD; *** p < 0.001; ns—not significant. The dot plots, bars, histograms, and photomicrographs represent 1 out of 3 independent experiments (n = 3). Image magnification, 200×.
Figure 4
Figure 4
Rotenone (ROT) but not conduritol-β-epoxide (CBE) induces oxidation of DJ-1 proteins at residue Cys106 and cleaved caspase 3 (CC3). (A) Representative flow cytometry histogram analysis showing the oxDJ-1(Cys106)-positive population in untreated cells (blue curve) or cells treated with (10 μM) CBE (red) or (10 μM) ROT (orange). Representative fluorescence images showing Hoechst (B′D′), oxDJ-1(Cys106)-positive (B″D″), and merge (BD) in untreated HEK-293 cells (B) or cells treated with (10 μM) of CBE (C) or (10 μM) ROT (D). Quantitative analysis of ox(Cys106) DJ-1 mean fluorescence intensity (E). Representative flow cytometry histogram analysis showing the CC3-positive population in untreated (blue), (10 μM) CBE (red)-, or (10 μM) ROT (orange)-treated cells (F). Representative fluorescence images showing Hoechst (G′I′), CC3-positive (G″I″), and merge (GI) of untreated HEK-293 cells (G) or cells treated with (10 μM) CBE (H) or (10 μM) ROT (I). Quantitative analysis of CC3 mean fluorescence intensity (J). The data are expressed as mean ± SD; * p < 0.05; *** p < 0.001; ns—not significant. The histograms, bars, and photomicrographs represent 1 out of 3 independent experiments (n = 3). Image magnification, 20×. White line (area) represents magnification of broken line (area).
Figure 5
Figure 5
Rotenone (ROT) but not conduritol-β-epoxide (CBE) induces α-synuclein (α-Syn) phosphorylation at residue Ser129 and LRRK2 kinase in HEK-293 cells. (A) Representative flow cytometry histogram analysis showing the pSer129α-Syn-positive population in untreated cells (blue) or cells treated with (10 μM) CBE (red) or (10 μM) ROT (orange). Representative fluorescence images showing Hoechst (B′D′), pSer129α-Syn-positive (B″D″), and merge (BD) in untreated HEK-293 cells (B) or cells treated with (10 μM) CBE (C) or (10 μM) ROT (D). Quantitative analysis of pSer129 α-Syn mean fluorescence intensity (E). Representative flow cytometry histogram analysis showing the pS935 LRRK2-positive population untreated (blue) or treated with (10 μΜ) CBE (red) or (10 μM) ROT (orange) (F). Representative fluorescence images showing Hoechst (G′I′), pS935 LRRK2-positive (G″I″), and merge (GI) of untreated HEK-293 cells (I) or cells treated with (10 μM) CBE (H) or (10 μM) ROT (I). Quantitative analysis of pS935 LRRK2 mean fluorescence intensity (J). The data are expressed as mean ± SD; *** p < 0.001; ns—not significant. The histograms, dot graphs, and photomicrographs represent 1 out of 3 independent experiments (n = 3). Image magnification, 20×.
Figure 5
Figure 5
Rotenone (ROT) but not conduritol-β-epoxide (CBE) induces α-synuclein (α-Syn) phosphorylation at residue Ser129 and LRRK2 kinase in HEK-293 cells. (A) Representative flow cytometry histogram analysis showing the pSer129α-Syn-positive population in untreated cells (blue) or cells treated with (10 μM) CBE (red) or (10 μM) ROT (orange). Representative fluorescence images showing Hoechst (B′D′), pSer129α-Syn-positive (B″D″), and merge (BD) in untreated HEK-293 cells (B) or cells treated with (10 μM) CBE (C) or (10 μM) ROT (D). Quantitative analysis of pSer129 α-Syn mean fluorescence intensity (E). Representative flow cytometry histogram analysis showing the pS935 LRRK2-positive population untreated (blue) or treated with (10 μΜ) CBE (red) or (10 μM) ROT (orange) (F). Representative fluorescence images showing Hoechst (G′I′), pS935 LRRK2-positive (G″I″), and merge (GI) of untreated HEK-293 cells (I) or cells treated with (10 μM) CBE (H) or (10 μM) ROT (I). Quantitative analysis of pS935 LRRK2 mean fluorescence intensity (J). The data are expressed as mean ± SD; *** p < 0.001; ns—not significant. The histograms, dot graphs, and photomicrographs represent 1 out of 3 independent experiments (n = 3). Image magnification, 20×.
Figure 6
Figure 6
Rotenone (ROT) does not induce the phosphorylation of LRRK2 in HEK-293 LRRK2 KO cells but reduces the levels of glucocerebrosidase (GCase) activity in both HEK-293 LRRK2 WT and KO cells. Representative flow cytometry histogram analysis showing the total LRRK2-positive population of HEK-293 LRRK2 WT (blue) and KO cells (red) (A). Quantitative analysis of pS935 LRRK2-positive cells untreated (green, blue) or treated with (10 μM) ROT (orange, red) in HEK-293 LRRK2 WT and KO cells (B). Percentage of pS935 LRRK2-positive cells untreated (green, blue) or treated with (10 μM) ROT (orange, red) in HEK-293 LRRK2 WT and KO cells (C). Quantitative analysis of pS935 LRRK2 mean fluorescence intensity (D). Representative fluorescence images showing Hoechst (E′H′), pS935 LRRK2-positive (E″H″), and merge (EH) in HEK-293 LRRK2 WT cells (E,F) and KO cells (G,H) untreated (E,G) or treated with (10 μM) of ROT (F,H). Analysis of GCase activity in HEK-293 LRRK2 WT and KO cells without or with (10 μM) ROT (I). The data are expressed as mean ± SD; ** p < 0.01; *** p < 0.001. The histograms, bars, and photomicrographs represent 1 out of 3 independent experiments (n = 3). Image magnification, 20×.
Figure 7
Figure 7
Rotenone (ROT) induces the accumulation of lysosomes but does not reduce mitochondrial membrane potential (ΔΨm) in HEK-293 LRRK2 KO cells. Representative density 2D plots showing SSC-A/LysoTracker analysis (complexity of lysosomes) of untreated HEK-293 LRRK2 WT cells (A) or cells treated with (10 μM) ROT (B), and HEK-293 LRRK2 KO cells untreated (C) or treated with (10 μM) ROT (D). Quantitative analysis of SSC-A/LysoTracker-positive cells (E). The formation of acidic vacuoles was determined as described in Section 4. The percentage is the number of events for positive staining for acidic vacuoles in the upper-left quadrants (AD), and color contrast indicates cell population density: dark blue < light blue < green < yellow < red. Representative flow cytometry histograms showing MitoTracker analysis of untreated or treated with (10 μM) ROT HEK-293 LRRK2 WT and KO cells. (F). Quantitative analysis of MitoTracker-depleted cells (G). Representative fluorescence images showing Hoechst (H′K′), LysoTracker (H″K″), MitoTracker (H‴K‴), and merge (HK) HEK-293 LRRK2 WT and KO cells untreated (H,J) or treated (I,K) with (10 μM) ROT. Quantitative analysis of LysoTracker-stained area (L). Quantitative analysis of MitoTracker mean fluorescence intensity (M). The data are expressed as mean ± SD; * p < 0.05; ** p < 0.01; *** p < 0.001; ns—not significant. The smooth dot plots, bars, histograms, and photomicrographs represent 1 out of 3 independent experiments (n = 3). Image magnification, 20×.
Figure 8
Figure 8
Rotenone (ROT) induces accumulation of the autophagolysosome flux in HEK-293 LRRK2 KO cells. Representative density 2D plots showing SSC-A/LysoTracker analysis (granular content or complexity of lysosomes) of untreated HEK-293 LRRK2 WT or HEK-293 LRRK2 KO cells (A) or cells treated with 10 μM ROT (B), (10 μM) chloroquine (CQ) (C), or (10 nM) bafilomycin A1 (BAF) (D). Quantitative analysis of SSC-A/LysoTracker-positive cells (E);. The formation of acidic vacuoles was determined as described in Section 4. The percentage is the number of events for positive staining for acidic vacuoles in the upper-left quadrants (AD), and color indicates cell population density of HEK-293 LRRK2 WT (blue) and HEK-293 LRRK2 KO (red) cells. Representative flow cytometry histograms showing the autophagy–lysosome acidification of untreated HEK-293 LRRK2 WT or KO cells (F) or cells treated with 10 μM ROT (G), (10 μM) chloroquine (CQ) (H), or (10 nM) bafilomycin A1 (BAF) (I). Quantitative analysis of autophagy–lysosome-acidification-positive cells (J). The percentage is the number of events for positive staining for acidic vacuoles, and color indicates cell population of HEK-293 LRRK2 WT (red) and HEK-293 LRRK2 KO (orange) cells. Representative immunofluorescence images showing LC3-II accumulation in HEK-293 LRRK2 WT (KN) and KO cells (OR) untreated (K,O) or treated with (10 μM) ROT (L,P), (10 μM) chloroquine (CQ) (M,Q), or (10 nM) bafilomycin A1 (BAF) (N,R). Quantitative analysis of the accumulation of LC3-II as mean fluorescence intensity (S). The data are expressed as mean ± SD; ns—not significant. The contour diagrams, histograms, bars, dot graphs, and photomicrographs represent 1 out of 3 independent experiments (n = 3). Image magnification, 200×.
Figure 9
Figure 9
Rotenone (ROT) neither induces phosphorylation of α-synuclein (α-Syn), oxidation of DJ-1 protein at residue Cys106 nor generates cleaved caspase 3 (CC3). Representative flow cytometry histogram analysis showing the α-synuclein (α-Syn)-positive population in HEK-293 LRRK2 WT (blue) or KO cells (red) (A). Quantitative analysis of α-Syn (B). Representative fluorescence images showing Hoechst (C′F′), α-Syn (C″F″), and merge (CF) HEK-293 LRRK2 WT and KO cells untreated (C,E) or treated (D,F) with (10 μM) of ROT. Quantitative analysis of α-Syn-stained area (G). Representative flow cytometry histogram analysis showing the oxDJ-1Cys106-positive population in HEK-293 LRRK2 WT (blue) or KO cells (red) (H). Quantitative analysis of oxDJ-1Cys106 (I). Representative fluorescence images showing Hoechst (J′M′), oxDJ-1Cys106 (J″M″), and merge (JM) HEK-293 LRRK2 WT and KO cells untreated (J,L) or treated (K,M) with (10 μM) ROT. Quantitative analysis of oxDJ-1Cys106-stained area (N). Representative flow cytometry histogram analysis showing the cleaved caspase 3 (CC3)-positive cell population in HEK-293 LRRK2 WT (blue) or KO cells (red) (O). Quantitative analysis of CC3 (P). Representative fluorescence images showing Hoechst (Q′T′), oxDJ-1Cys106 (Q″T″), and merge (QT) HEK-293 LRRK2 WT and KO cells untreated (Q,S) or treated (R,T) with (10 μM) ROT. Quantitative analysis of CC3-stained area (U). The data are expressed as mean ± SD; *** p < 0.001; ns—not significant. The smooth dot plots, bars, histograms, and photomicrographs represent 1 out of 3 independent experiments (n = 3). Image magnification, 20×. White line (area) represents magnification of broken line (area).
Figure 10
Figure 10
Schematic model of cell signaling induced by rotenone and conduritol-β-epoxide: A mechanistic explanation of the interaction between LRRK2 kinase, α-Synuclein, glucocerebrosidase, lysosomes, and autophagosomes. (A) Rotenone (ROT, red full star) binds to the ubiquinone binding site of mitochondrial complex I (NADH:ubiquinone oxidoreductase), thus preventing electron transfer via Flavin mononucleotide (FMN) to coenzyme Q10 (1). Consequently, the interruption of the electron transport chain concomitantly generates anion superoxide (O2) and hydrogen peroxide (H2O2, 2). This last compound is capable of oxidizing the stress sensor protein DJ-1Cys106-SH into DJ-1Cys106-SO3 (3), directly activates LRRK2 (leucine-rich repeat kinase 2) kinase by autophosphorylation (4) or indirectly phosphorylates LRRK2 through activation of MEKK1 (mitogen-activated protein/extracellular signal-related protein kinase (MAP/ERK) kinase (MEK))/IKK (IκB kinase, 5). Once LRRK2 is phosphorylated at Ser935, the active p-(S-935)-LRRK2 kinase (6) phosphorylates three major targets: (i) alpha-synuclein (α-Syn) at residue Ser129 (7), which, in turn, interacts with mitochondria complex I, thereby generating H2O2, and induces loss of mitochondrial membrane potential (ΔΨm); (ii) it inactivates protein PRDX3 (peroxiredoxin 3, 8), thereby preventing H2O2 catalysis; (iii) p-(S-935)-LRRK2 activates the mitochondrial fission protein DLP-1 (dynamin-like protein 1, 9), which, together with the fission protein-1 (Fis-1) receptor, induces mitochondria depolarization, fragmentation, and aggregation (10). Subsequently, the release of apoptogenic proteins (e.g., cytochrome C) results in the production of cleaved caspase 3 (11), which is responsible for chromatin condensation and DNA fragmentation (12) in HEK-293 LRRK2 WT cells. The nucleus morphology constitutes the typical hallmark of apoptosis. Alternatively, ROT and conduritol-β-epoxide (CBE, 13) bind to the enzyme glucocerebrosidase (GCase) (14). The reduced catalytic activity of GCase results in a limited fusion of autophagosomes and lysosomes, leading to their respective accumulation (15). (B) Rotenone (ROT, red full star) binds to the complex I (1), thereby generating (O2.−) and hydrogen peroxide (H2O2, 2). This last compound is decomposed by PRDX3 (8). As a result, ΔΨm is preserved (16), avoiding the release of apoptogenic proteins. Therefore, the nucleus is conserved intact (17) in HEK-293 LRRK2 KO cells. Additionally, ROT binds to GCase (14), resulting in the accumulation of lysosomes and autophagy–lysosomes (15). The cell shows neither signs of oxidative stress (OS) nor apoptosis markers.
Figure 10
Figure 10
Schematic model of cell signaling induced by rotenone and conduritol-β-epoxide: A mechanistic explanation of the interaction between LRRK2 kinase, α-Synuclein, glucocerebrosidase, lysosomes, and autophagosomes. (A) Rotenone (ROT, red full star) binds to the ubiquinone binding site of mitochondrial complex I (NADH:ubiquinone oxidoreductase), thus preventing electron transfer via Flavin mononucleotide (FMN) to coenzyme Q10 (1). Consequently, the interruption of the electron transport chain concomitantly generates anion superoxide (O2) and hydrogen peroxide (H2O2, 2). This last compound is capable of oxidizing the stress sensor protein DJ-1Cys106-SH into DJ-1Cys106-SO3 (3), directly activates LRRK2 (leucine-rich repeat kinase 2) kinase by autophosphorylation (4) or indirectly phosphorylates LRRK2 through activation of MEKK1 (mitogen-activated protein/extracellular signal-related protein kinase (MAP/ERK) kinase (MEK))/IKK (IκB kinase, 5). Once LRRK2 is phosphorylated at Ser935, the active p-(S-935)-LRRK2 kinase (6) phosphorylates three major targets: (i) alpha-synuclein (α-Syn) at residue Ser129 (7), which, in turn, interacts with mitochondria complex I, thereby generating H2O2, and induces loss of mitochondrial membrane potential (ΔΨm); (ii) it inactivates protein PRDX3 (peroxiredoxin 3, 8), thereby preventing H2O2 catalysis; (iii) p-(S-935)-LRRK2 activates the mitochondrial fission protein DLP-1 (dynamin-like protein 1, 9), which, together with the fission protein-1 (Fis-1) receptor, induces mitochondria depolarization, fragmentation, and aggregation (10). Subsequently, the release of apoptogenic proteins (e.g., cytochrome C) results in the production of cleaved caspase 3 (11), which is responsible for chromatin condensation and DNA fragmentation (12) in HEK-293 LRRK2 WT cells. The nucleus morphology constitutes the typical hallmark of apoptosis. Alternatively, ROT and conduritol-β-epoxide (CBE, 13) bind to the enzyme glucocerebrosidase (GCase) (14). The reduced catalytic activity of GCase results in a limited fusion of autophagosomes and lysosomes, leading to their respective accumulation (15). (B) Rotenone (ROT, red full star) binds to the complex I (1), thereby generating (O2.−) and hydrogen peroxide (H2O2, 2). This last compound is decomposed by PRDX3 (8). As a result, ΔΨm is preserved (16), avoiding the release of apoptogenic proteins. Therefore, the nucleus is conserved intact (17) in HEK-293 LRRK2 KO cells. Additionally, ROT binds to GCase (14), resulting in the accumulation of lysosomes and autophagy–lysosomes (15). The cell shows neither signs of oxidative stress (OS) nor apoptosis markers.

Similar articles

Cited by

References

    1. Jankovic J. Parkinson’s disease: Clinical features and diagnosis. J. Neurol. Neurosurg. Psychiatry. 2008;79:368–376. doi: 10.1136/jnnp.2007.131045. - DOI - PubMed
    1. Spillantini M.G., Schmidt M.L., Lee V.M., Trojanowski J.Q., Jakes R., Goedert M. Alpha-synuclein in Lewy bodies. Nature. 1997;388:839–840. doi: 10.1038/42166. - DOI - PubMed
    1. Parkinson J. An essay on the shaking palsy. J. Neuropsychiatry Clin. Neurosci. 2002;14:223–236, discussion 222. doi: 10.1176/jnp.14.2.223. - DOI - PubMed
    1. Dorsey E.R., Sherer T., Okun M.S., Bloem B.R. The Emerging Evidence of the Parkinson Pandemic. J. Park. Dis. 2018;8:S3–S8. doi: 10.3233/JPD-181474. - DOI - PMC - PubMed
    1. Dorsey E.R., Bloem B.R. The Parkinson Pandemic-A Call to Action. JAMA Neurol. 2018;75:9–10. doi: 10.1001/jamaneurol.2017.3299. - DOI - PubMed

MeSH terms

Grants and funding