

Immune Cell-Related Genes in Juvenile Idiopathic Arthritis Identified Using Transcriptomic and Single-Cell Sequencing Data
- PMID: 37445800
- PMCID: PMC10342059
- DOI: 10.3390/ijms241310619
Immune Cell-Related Genes in Juvenile Idiopathic Arthritis Identified Using Transcriptomic and Single-Cell Sequencing Data
Abstract
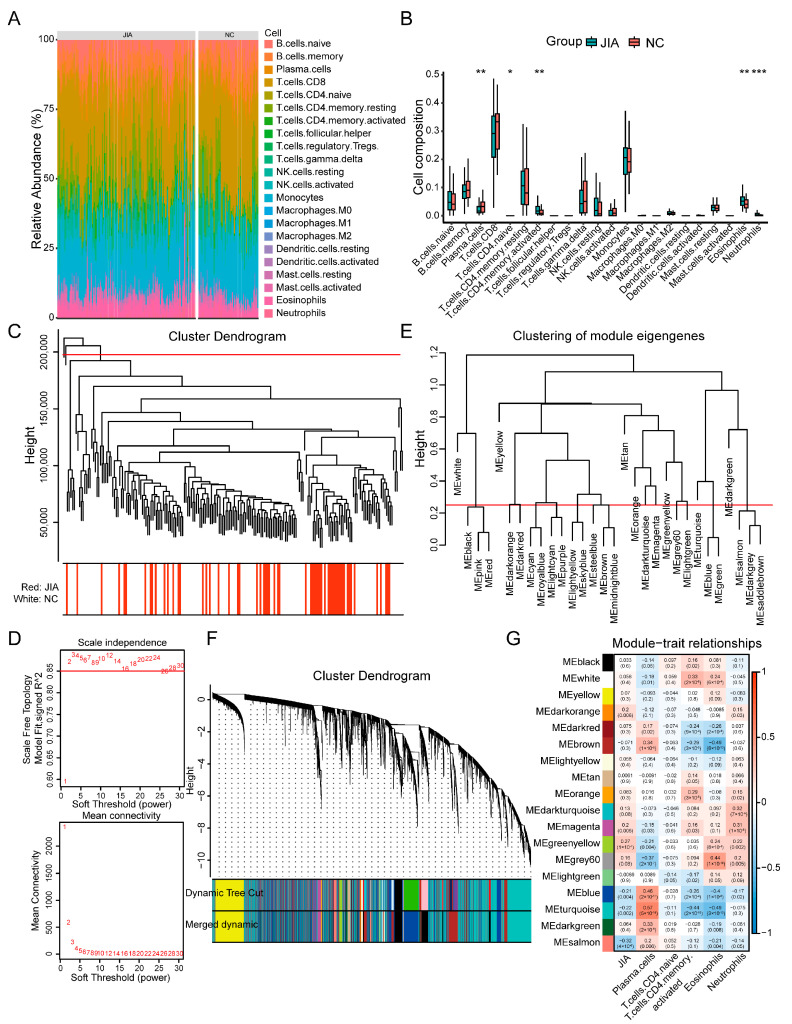
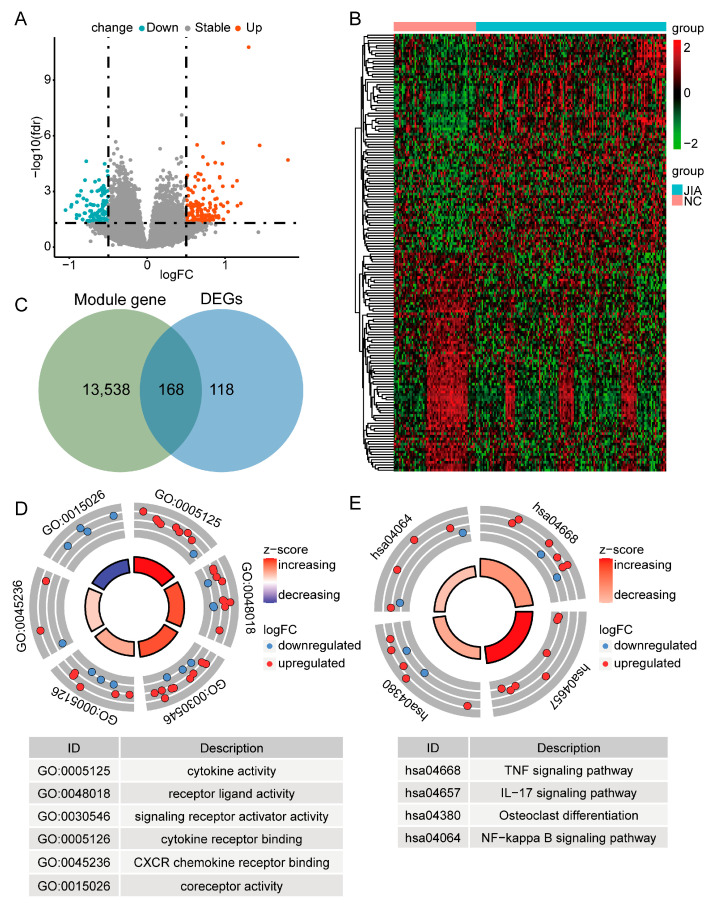
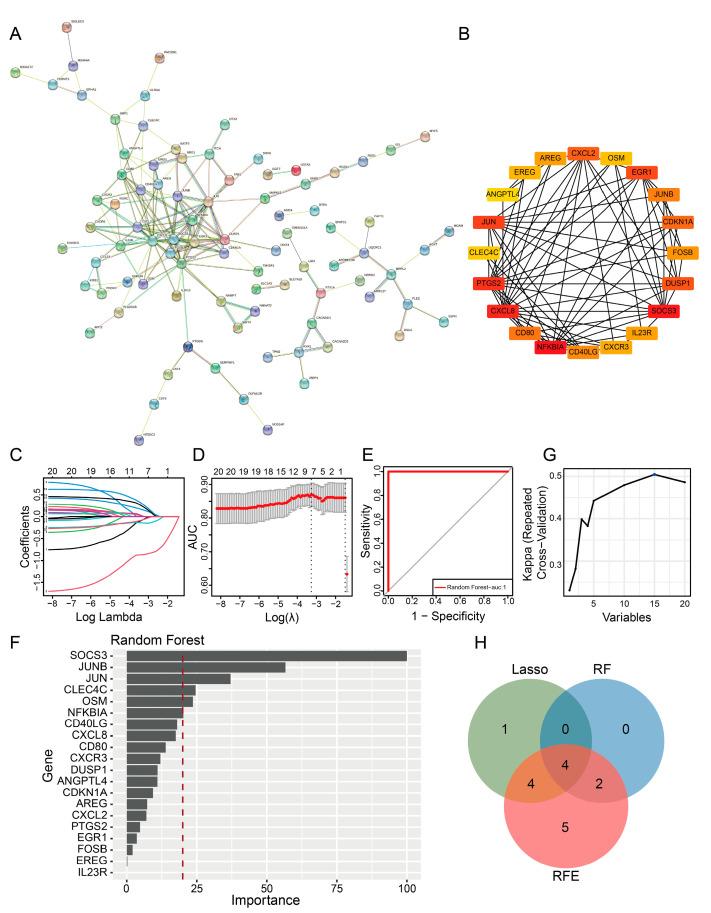
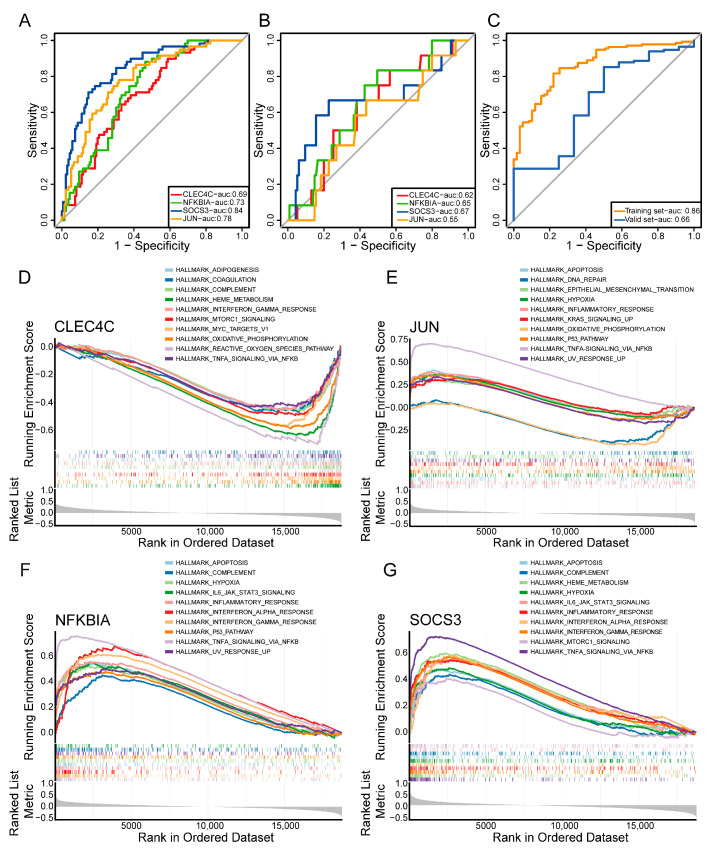
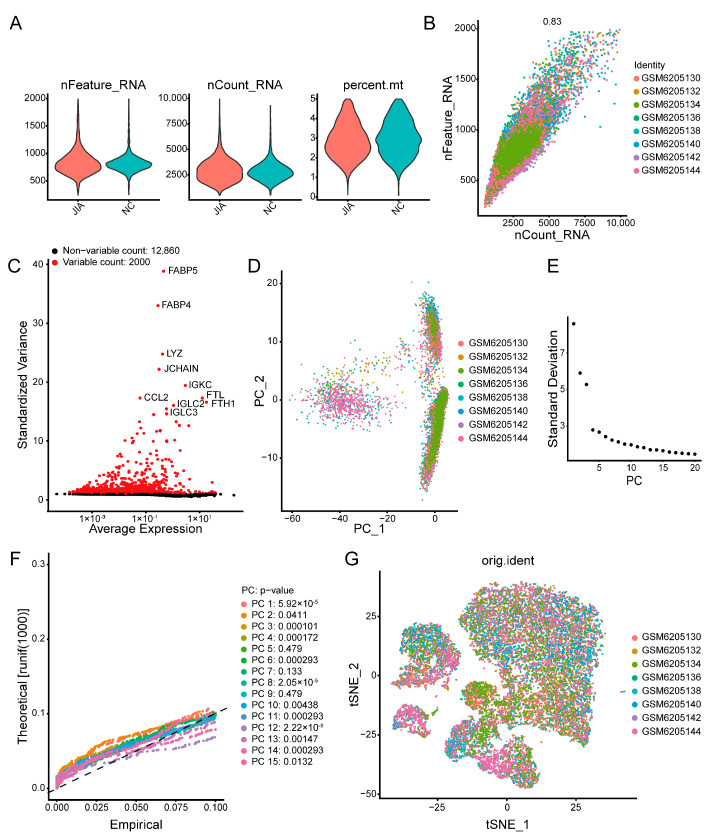
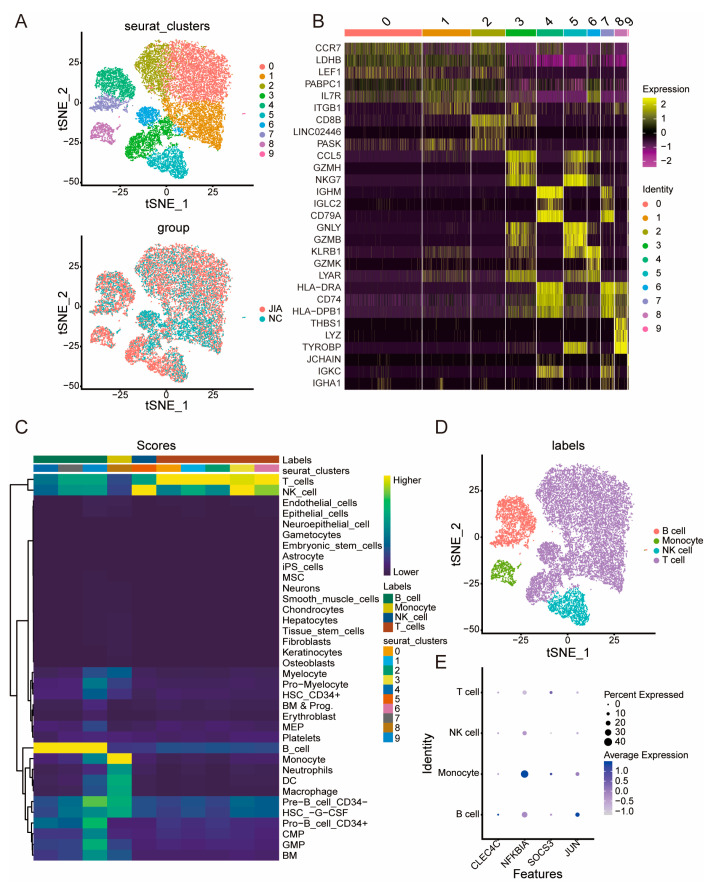
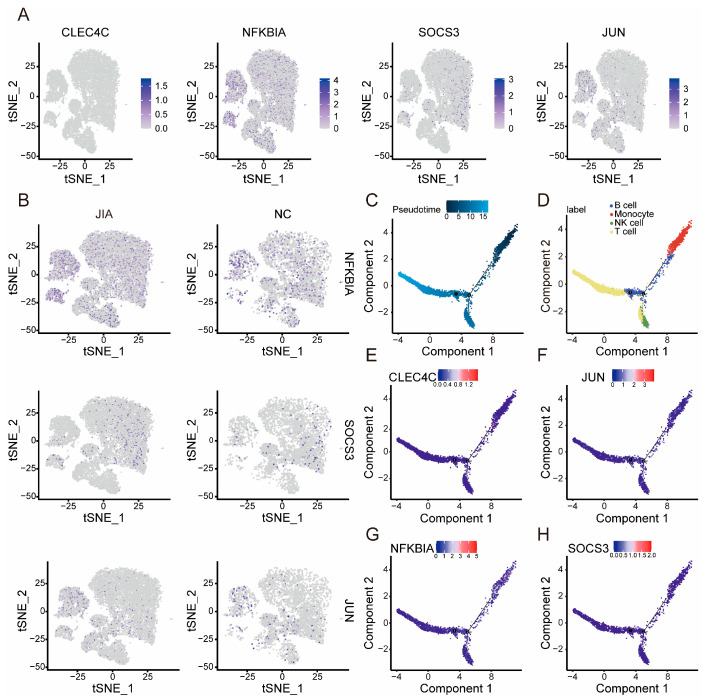
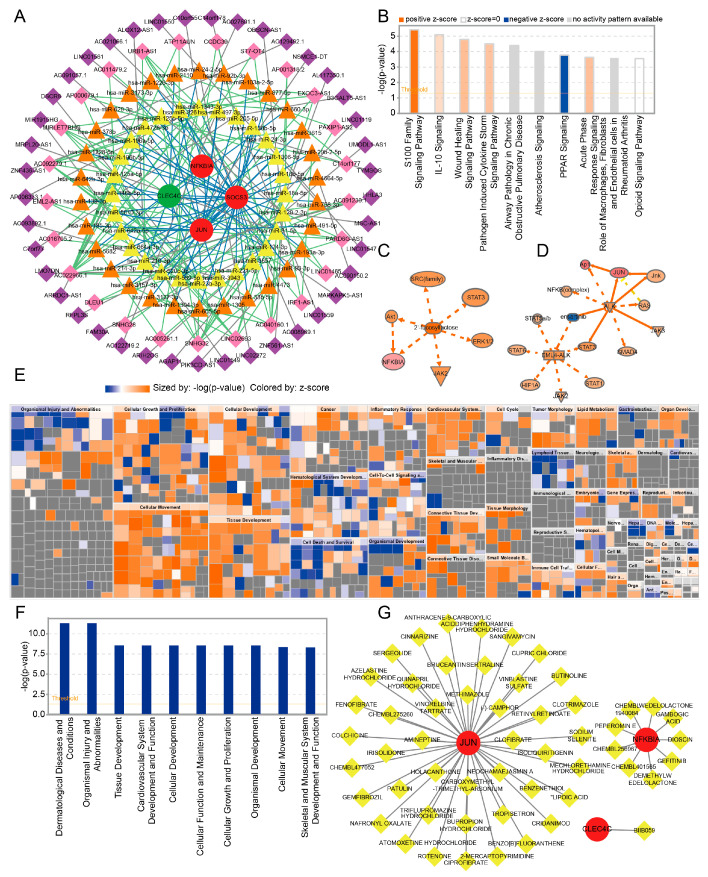
Juvenile idiopathic arthritis (JIA) is the most common chronic rheumatic disease in children. The heterogeneity of the disease can be investigated via single-cell RNA sequencing (scRNA-seq) for its gap in the literature. Firstly, five types of immune cells (plasma cells, naive CD4 T cells, memory-activated CD4 T cells, eosinophils, and neutrophils) were significantly different between normal control (NC) and JIA samples. WGCNA was performed to identify genes that exhibited the highest correlation to differential immune cells. Then, 168 differentially expressed immune cell-related genes (DE-ICRGs) were identified by overlapping 13,706 genes identified by WGCNA and 286 differentially expressed genes (DEGs) between JIA and NC specimens. Next, four key genes, namely SOCS3, JUN, CLEC4C, and NFKBIA, were identified by a protein-protein interaction (PPI) network and three machine learning algorithms. The results of functional enrichment revealed that SOCS3, JUN, and NFKBIA were all associated with hallmark TNF-α signaling via NF-κB. In addition, cells in JIA samples were clustered into four groups (B cell, monocyte, NK cell, and T cell groups) by single-cell data analysis. CLEC4C and JUN exhibited the highest level of expression in B cells; NFKBIA and SOCS3 exhibited the highest level of expression in monocytes. Finally, real-time quantitative PCR (RT-qPCR) revealed that the expression of three key genes was consistent with that determined by differential analysis. Our study revealed four key genes with prognostic value for JIA. Our findings could have potential implications for JIA treatment and investigation.
Keywords: WGCNA; juvenile idiopathic arthritis; machine learning analysis; protein–protein interaction; single-cell RNA sequencing.
Conflict of interest statement
The authors declare no conflict of interest.
Figures
Similar articles
-
Identification of key biomarkers in RF-negative polyarticular and oligoarticular juvenile idiopathic arthritis by bioinformatic analysis.Pediatr Rheumatol Online J. 2023 Nov 24;21(1):143. doi: 10.1186/s12969-023-00926-4. Pediatr Rheumatol Online J. 2023. PMID: 38001449 Free PMC article.
-
Whole Transcriptome Analysis Reveals Heterogeneity in B Cell Memory Populations in Patients With Juvenile Idiopathic Arthritis-Associated Uveitis.Front Immunol. 2020 Sep 17;11:2170. doi: 10.3389/fimmu.2020.02170. eCollection 2020. Front Immunol. 2020. PMID: 33042130 Free PMC article.
-
Intermediate monocytes are increased in enthesitis-related arthritis, a category of juvenile idiopathic arthritis.Clin Exp Immunol. 2017 Feb;187(2):234-241. doi: 10.1111/cei.12880. Epub 2016 Oct 28. Clin Exp Immunol. 2017. PMID: 27706807 Free PMC article.
-
Specific gene expression profiles in systemic juvenile idiopathic arthritis.Arthritis Rheum. 2007 Jun;56(6):1954-65. doi: 10.1002/art.22644. Arthritis Rheum. 2007. PMID: 17530721
-
Single-cell RNA sequencing in juvenile idiopathic arthritis.Genes Dis. 2023 May 24;11(2):633-644. doi: 10.1016/j.gendis.2023.04.014. eCollection 2024 Mar. Genes Dis. 2023. PMID: 37692495 Free PMC article. Review.
Cited by
-
Aging associated immunosenescence in rheumatoid arthritis identified by machine learning and single cell profiling.Sci Rep. 2025 Aug 23;15(1):31042. doi: 10.1038/s41598-025-15370-5. Sci Rep. 2025. PMID: 40849565 Free PMC article.
-
Comprehensive analysis of juvenile idiopathic arthritis patients' immune characteristics based on bulk and single-cell sequencing data.Front Mol Biosci. 2024 May 1;11:1359235. doi: 10.3389/fmolb.2024.1359235. eCollection 2024. Front Mol Biosci. 2024. PMID: 38751447 Free PMC article.
-
Special Issue "Machine Learning and Bioinformatics in Human Health and Disease"-Chances and Challenges.Int J Mol Sci. 2024 Nov 28;25(23):12811. doi: 10.3390/ijms252312811. Int J Mol Sci. 2024. PMID: 39684521 Free PMC article.
-
NLRP3 overexpression exacerbated synovium tissue degeneration in juvenile collagen-induced arthritis.Sci Rep. 2025 Feb 27;15(1):7024. doi: 10.1038/s41598-025-86720-6. Sci Rep. 2025. PMID: 40016261 Free PMC article.
-
Development of a machine learning-based predictive nomogram for screening children with juvenile idiopathic arthritis: a pseudo-longitudinal study of 223,195 children in the United States.Front Public Health. 2025 May 29;13:1531764. doi: 10.3389/fpubh.2025.1531764. eCollection 2025. Front Public Health. 2025. PMID: 40510579 Free PMC article.
References
-
- Consolaro A., Giancane G., Alongi A., van Dijkhuizen E.H.P., Aggarwal A., Al-Mayouf S.M., Bovis F., De Inocencio J., Demirkaya E., Flato B., et al. Phenotypic variability and disparities in treatment and outcomes of childhood arthritis throughout the world: An observational cohort study. Lancet Child Adolesc. Health. 2019;3:255–263. doi: 10.1016/S2352-4642(19)30027-6. - DOI - PubMed
-
- Giancane G., Muratore V., Marzetti V., Quilis N., Benavente B.S., Bagnasco F., Alongi A., Civino A., Quartulli L., Consolaro A., et al. Disease activity and damage in juvenile idiopathic arthritis: Methotrexate era versus biologic era. Arthritis Res. Ther. 2019;21:168. doi: 10.1186/s13075-019-1950-7. - DOI - PMC - PubMed
-
- Schmidt T., Berthold E., Arve-Butler S., Gullstrand B., Mossberg A., Kahn F., Bengtsson A.A., Månsson B., Kahn R. Children with oligoarticular juvenile idiopathic arthritis have skewed synovial monocyte polarization pattern with functional impairment-a distinct inflammatory pattern for oligoarticular juvenile arthritis. Arthritis Res. Ther. 2020;22:186. doi: 10.1186/s13075-020-02279-9. - DOI - PMC - PubMed
MeSH terms
Substances
Grants and funding
LinkOut - more resources
Full Text Sources
Medical
Research Materials
Miscellaneous
