. 2023 Jun 25;24(13):10634.
doi: 10.3390/ijms241310634.

Anti-Inflammatory Activity of Black Soldier Fly Oil Associated with Modulation of TLR Signaling: A Metabolomic Approach

Affiliations

Anti-Inflammatory Activity of Black Soldier Fly Oil Associated with Modulation of TLR Signaling: A Metabolomic Approach

Hadas Richter et al. Int J Mol Sci. .

Abstract

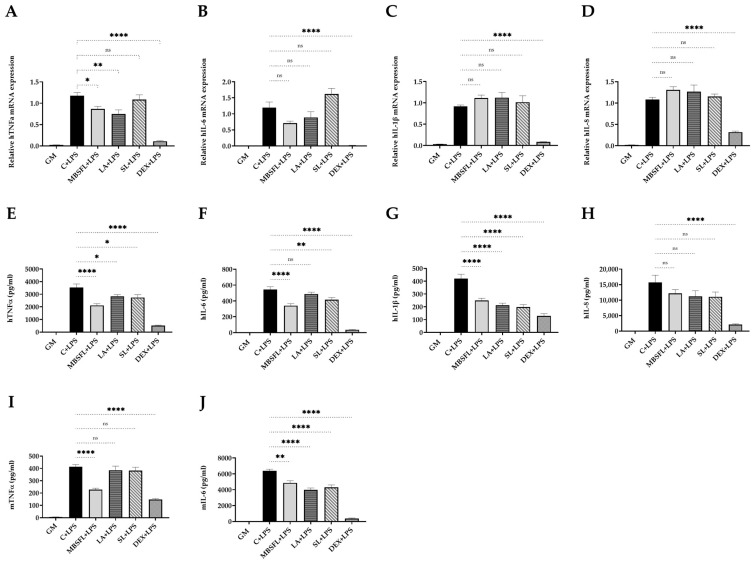
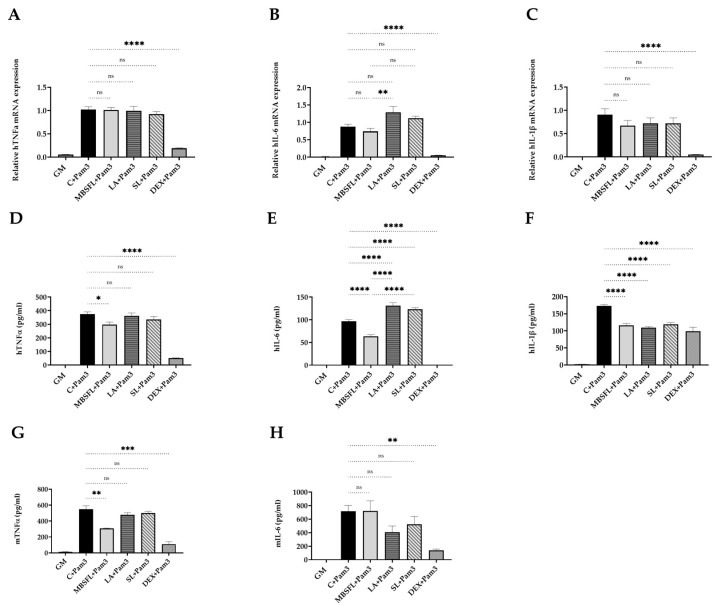
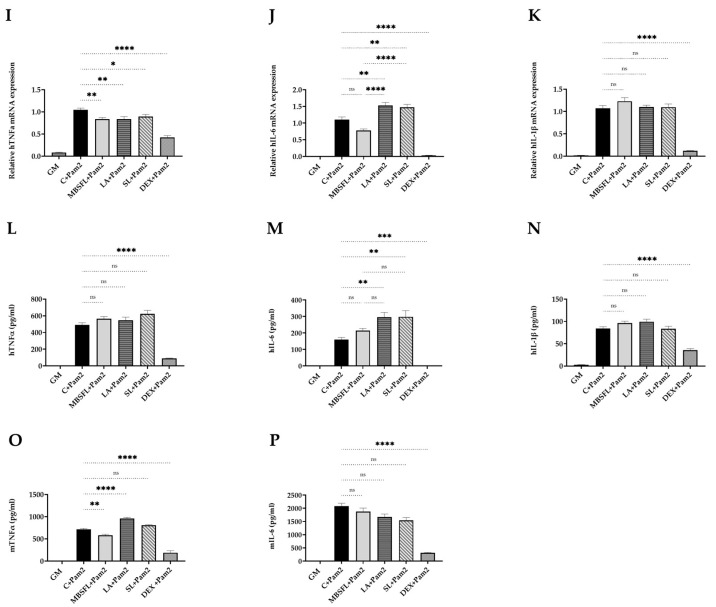
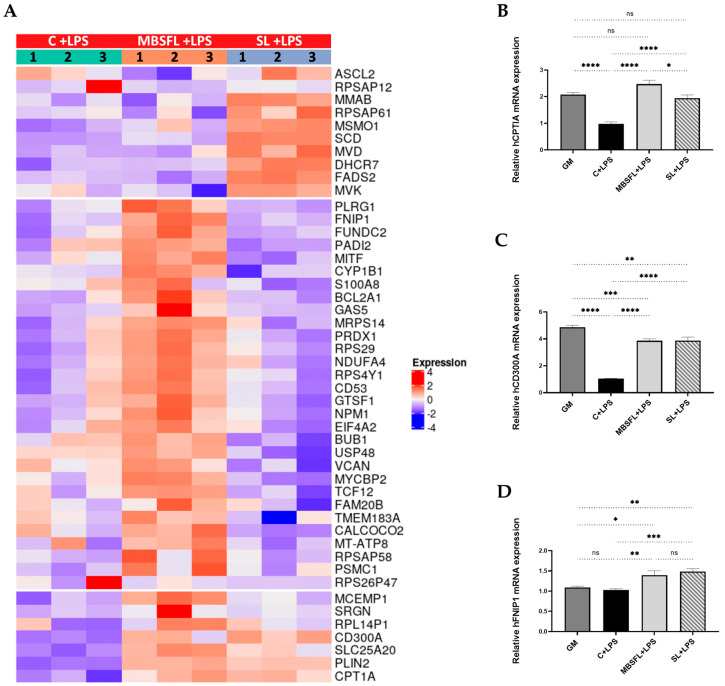
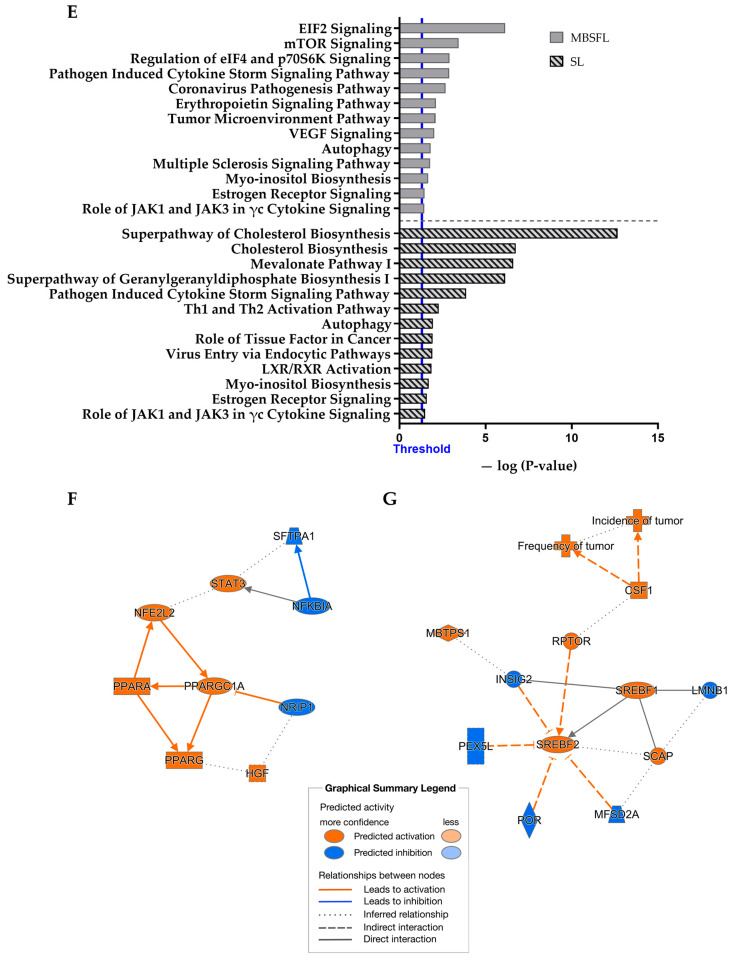
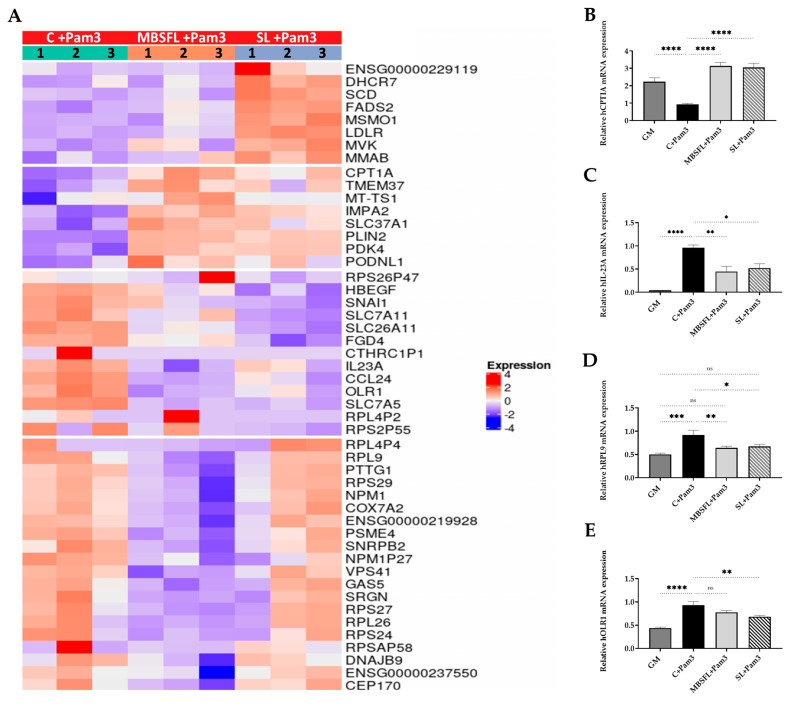
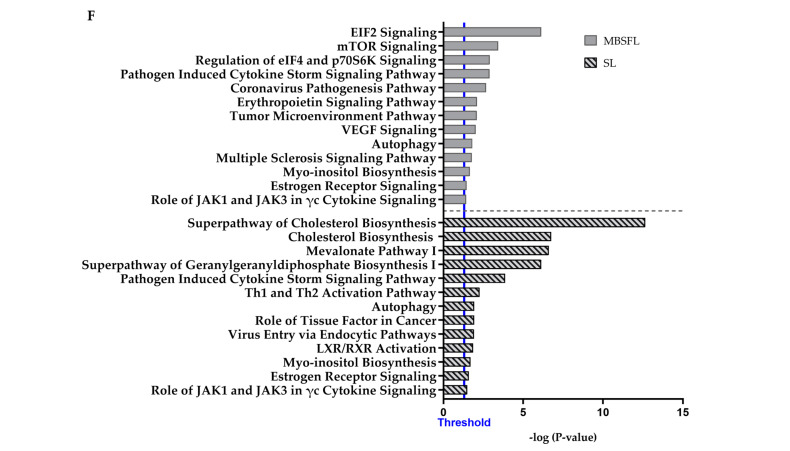
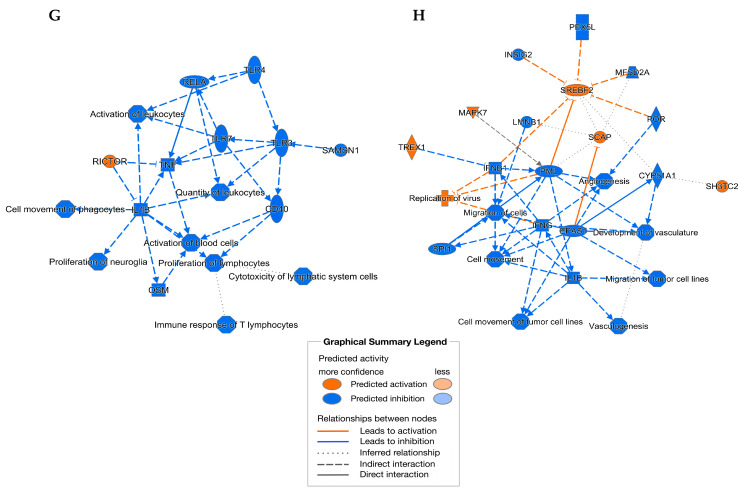
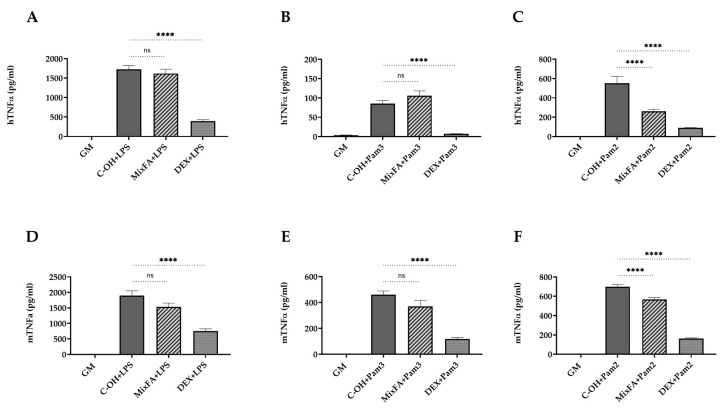
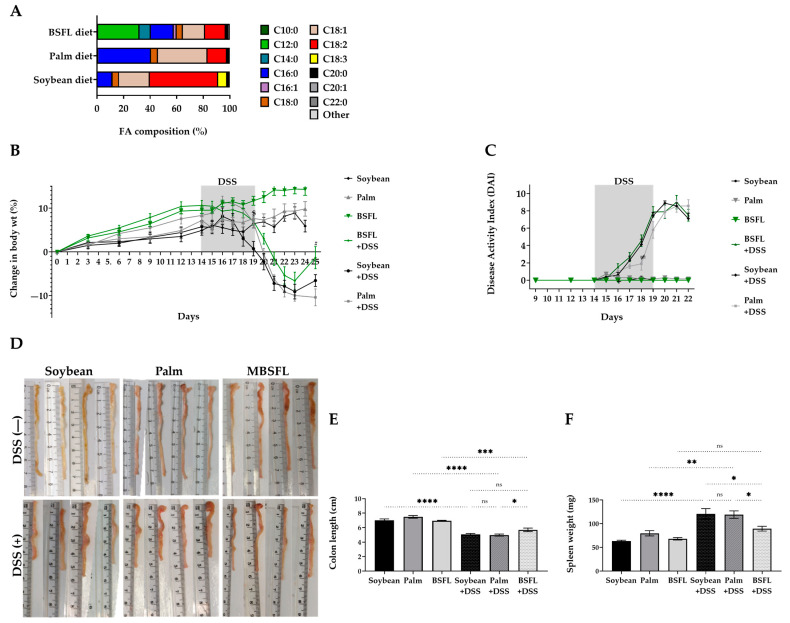
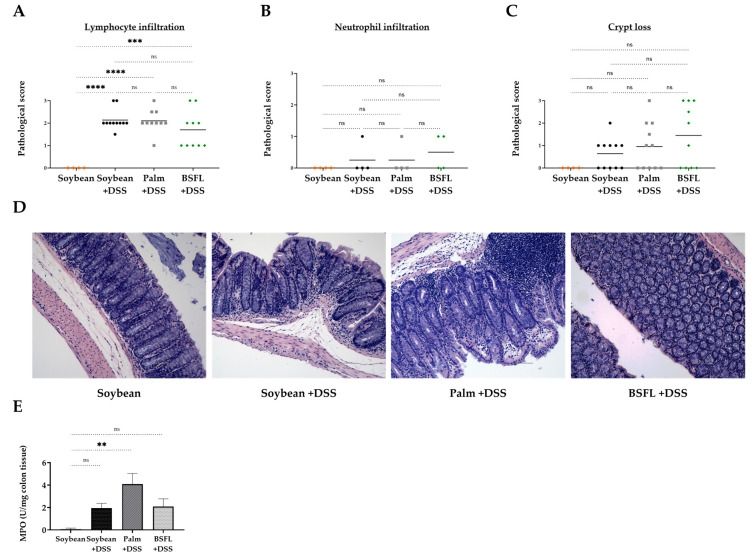
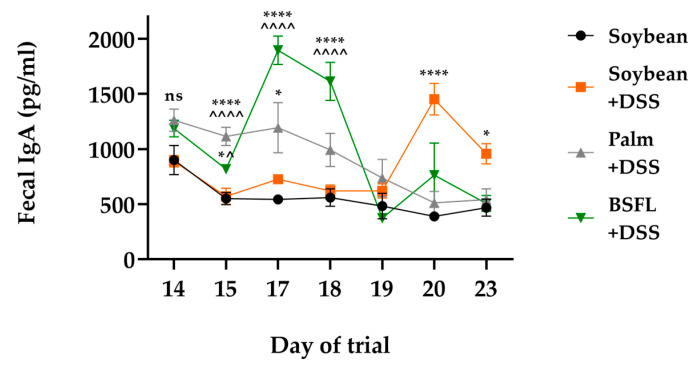
Dietary intervention in the treatment of ulcerative colitis involves, among other things, modifications in fatty acid content and/or profile. For example, replacing saturated long chain fatty acids with medium chain fatty acids (MCFAs) has been reported to ameliorate inflammation. The Black Soldier Fly Larvae's (BSFL) oil is considered a sustainable dietary ingredient rich in the MCFA C12:0; however, its effect on inflammatory-related conditions has not been studied until now. Thus, the present study aimed to investigate the anti-inflammatory activity of BSFL oil in comparison to C12:0 using TLR4- or TLR2-activated THP-1 and J774A.1 cell lines and to assess its putative protective effect against dextran sulfate sodium (DSS)-induced acute colitis in mice. BSFL oil and C12:0 suppressed proinflammatory cytokines release in LPS-stimulated macrophages; however, only BSFL oil exerted anti-inflammatory activity in Pam3CSK4-stimulated macrophages. Transcriptome analysis provided insight into the possible role of BSFL oil in immunometabolism switch, involving mTOR signaling and an increase in PPAR target genes promoting fatty acid oxidation, exhibiting a discrepant mode of action compared to C12:0 treatment, which mainly affected cholesterol biosynthesis pathways. Additionally, we identified anti-inflammatory eicosanoids, oxylipins, and isoprenoids in the BSFL oil that may contribute to an orchestrated anti-inflammatory response. In vivo, a BSFL oil-enriched diet (20%) ameliorated the clinical signs of colitis, as indicated by improved body weight recovery, reduced colon shortening, reduced splenomegaly, and an earlier phase of secretory IgA response. These results indicate the novel beneficial use of BSFL oil as a modulator of inflammation.

Keywords: Pam3CSK4; Toll-like receptor (TLR); black soldier fly larvae (BSFL); dextran sulfate sodium (DSS)-induced colitis; lipopolysaccharides (LPS); macrophage; mammalian target of rapamycin (mTOR); medium chain fatty acid (MCFA) C12:0; peroxisome proliferator-activated receptor (PPAR); proinflammatory cytokine.


Conflict of interest statement

The authors declare no conflict of interest.

Figures

Figure 1
Figure 1
Suppression of Toll-like receptor (TLR) 4-mediated proinflammatory cytokines by modified BSFL oil (MBSFL) and C12:0 in macrophages. Phorbol 12-myristate 13-acetate (PMA)-primed human THP-1 and murine J774A.1 macrophages were treated with 250 µM MBSFL, 250 µM lauric acid (LA), 250 µM sodium laurate (SL), or dexamethasone (DEX; Positive control, 2 µg/mL in THP-1, 1.2 µg/mL in J774A.1), followed by lipopolysaccharides (LPS) stimulation, compared to stimulated vehicle-treated control (C + LPS), and untreated and unstimulated cells (GM; Negative control). (AD) mRNA expression and; (EH) Protein secretion levels of tumor necrosis factor alpha (TNFα), interleukin (IL)-6, IL-1β, and IL-8 in PMA-primed THP-1 cells stimulated with 10 ng/mL LPS for 12 h and 20 h, respectively; (I,J) TNFα and IL-6 levels in the medium of J774A.1 cells 24 h following 7.5 ng/mL LPS stimulation. mRNA expression was measured by qPCR (n = 4–6), and secreted cytokines in the medium were measured by ELISA (n = 8–10); ns: not significant, * p < 0.05, ** p < 0.01, **** p < 0.0001.
Figure 2
Figure 2
MBSFL and C12:0 reciprocally modulate TLR2-mediated proinflammatory cytokines expression and secretion in macrophages. PMA-primed THP-1 and J774A.1 macrophages were treated with 250 µM MBSFL, 250 µM LA, 250 µM SL, or DEX (positive control, 2 µg/mL in THP-1, 1.2 µg/mL in J774A.1), followed by stimulation with a TLR2 ligand and compared with stimulated vehicle-treated controls (C + Pam3 or C + Pam2) and untreated and unstimulated cells (GM; Negative control). (AC) mRNA expression and; (DF) Protein secretion levels of TNFα, IL-6, and IL-1β in THP-1 cells stimulated with 50 ng/mL Pam3CSK4 (Pam3) for 12 h and 20 h, respectively; (G,H) TNFα and IL-6 levels in the medium of J774A.1 cells 24 h following 50 ng/mL Pam3 stimulation; (IK) mRNA expression and; (LN) Protein secretion levels of TNFα, IL-6, and IL-1β in THP-1 cells stimulated with 1 ng/mL Pam2CSK4 (Pam2) for 6 h and 20 h, respectively; (O,P) TNFα and IL-6 levels in the medium of J774A.1 cells 24 h following 25 ng/mL Pam2 stimulation. mRNA expression was measured by qPCR (n = 4–6), and secreted cytokines in the medium were measured by ELISA (n = 8–10); ns: not significant, * p < 0.05, ** p < 0.01, *** p < 0.001, **** p < 0.0001.
Figure 2
Figure 2
MBSFL and C12:0 reciprocally modulate TLR2-mediated proinflammatory cytokines expression and secretion in macrophages. PMA-primed THP-1 and J774A.1 macrophages were treated with 250 µM MBSFL, 250 µM LA, 250 µM SL, or DEX (positive control, 2 µg/mL in THP-1, 1.2 µg/mL in J774A.1), followed by stimulation with a TLR2 ligand and compared with stimulated vehicle-treated controls (C + Pam3 or C + Pam2) and untreated and unstimulated cells (GM; Negative control). (AC) mRNA expression and; (DF) Protein secretion levels of TNFα, IL-6, and IL-1β in THP-1 cells stimulated with 50 ng/mL Pam3CSK4 (Pam3) for 12 h and 20 h, respectively; (G,H) TNFα and IL-6 levels in the medium of J774A.1 cells 24 h following 50 ng/mL Pam3 stimulation; (IK) mRNA expression and; (LN) Protein secretion levels of TNFα, IL-6, and IL-1β in THP-1 cells stimulated with 1 ng/mL Pam2CSK4 (Pam2) for 6 h and 20 h, respectively; (O,P) TNFα and IL-6 levels in the medium of J774A.1 cells 24 h following 25 ng/mL Pam2 stimulation. mRNA expression was measured by qPCR (n = 4–6), and secreted cytokines in the medium were measured by ELISA (n = 8–10); ns: not significant, * p < 0.05, ** p < 0.01, *** p < 0.001, **** p < 0.0001.
Figure 3
Figure 3
Differential transcriptome profile upon treatment with MBSFL or SL in TLR4-activated macrophages. PMA-primed THP-1 cells were treated with 250 µM MBSFL or 250 µM SL, followed by stimulation with 10 ng/mL LPS for 12 h and compared to stimulated vehicle-treated control (C + LPS). (A) Heatmap of Differentially Expressed Genes (DEGs). The log 2-normalized counts were standardized to have a zero mean and standard unit variance for each gene. The standardized log counts were used for clustering analysis. The expression profile is accompanied by a color bar indicating the standardized log 2-normalized counts; (BD) mRNA expression of selected DEGs, assessed by qPCR. Data are indicated as mean ± SEM (n = 4–6); ns: not significant, * p < 0.05, ** p < 0.01, *** p < 0.001, **** p < 0.0001; (E) Lists of selected canonical pathways affected by MBSFL or SL treatment; (F,G) Graphical interaction networks of the major biological themes and their predicted relationship affected by MBSFL or SL, respectively, based on Ingenuity Pathway Analysis (IPA), using the threshold of fold changes ≥ 1.6 and p < 0.01.
Figure 3
Figure 3
Differential transcriptome profile upon treatment with MBSFL or SL in TLR4-activated macrophages. PMA-primed THP-1 cells were treated with 250 µM MBSFL or 250 µM SL, followed by stimulation with 10 ng/mL LPS for 12 h and compared to stimulated vehicle-treated control (C + LPS). (A) Heatmap of Differentially Expressed Genes (DEGs). The log 2-normalized counts were standardized to have a zero mean and standard unit variance for each gene. The standardized log counts were used for clustering analysis. The expression profile is accompanied by a color bar indicating the standardized log 2-normalized counts; (BD) mRNA expression of selected DEGs, assessed by qPCR. Data are indicated as mean ± SEM (n = 4–6); ns: not significant, * p < 0.05, ** p < 0.01, *** p < 0.001, **** p < 0.0001; (E) Lists of selected canonical pathways affected by MBSFL or SL treatment; (F,G) Graphical interaction networks of the major biological themes and their predicted relationship affected by MBSFL or SL, respectively, based on Ingenuity Pathway Analysis (IPA), using the threshold of fold changes ≥ 1.6 and p < 0.01.
Figure 4
Figure 4
Differential transcriptome profile upon treatment with MBSFL or SL in TLR2-activated macrophages. PMA-primed THP-1 cells were treated with 250 µM MBSFL or 250 µM SL, followed by stimulation with 50 ng/mL Pam3 for 12 h and compared to stimulated vehicle-treated control (C + Pam3). (A) Heatmap of DEGs. The log 2-normalized counts were standardized to have a zero mean and standard unit variance for each gene. The standardized log counts were used for the clustering analysis. The expression profile is accompanied by a color bar indicating the standardized log 2-normalized counts; (BE) mRNA expression of selected DEGs, assessed by qPCR. Data are indicated as mean ± SEM (n = 4–6); ns: not significant, * p < 0.05, ** p < 0.01, *** p < 0.001, **** p < 0.0001; (F) Lists of selected canonical pathways affected by MBSFL or SL treatment; (G,H) Graphical interaction network of the major biological themes and their predicted relationship affected by MBSFL or SL, respectively, based on IPA, using the threshold of fold changes ≥ 1.6 and p < 0.01.
Figure 4
Figure 4
Differential transcriptome profile upon treatment with MBSFL or SL in TLR2-activated macrophages. PMA-primed THP-1 cells were treated with 250 µM MBSFL or 250 µM SL, followed by stimulation with 50 ng/mL Pam3 for 12 h and compared to stimulated vehicle-treated control (C + Pam3). (A) Heatmap of DEGs. The log 2-normalized counts were standardized to have a zero mean and standard unit variance for each gene. The standardized log counts were used for the clustering analysis. The expression profile is accompanied by a color bar indicating the standardized log 2-normalized counts; (BE) mRNA expression of selected DEGs, assessed by qPCR. Data are indicated as mean ± SEM (n = 4–6); ns: not significant, * p < 0.05, ** p < 0.01, *** p < 0.001, **** p < 0.0001; (F) Lists of selected canonical pathways affected by MBSFL or SL treatment; (G,H) Graphical interaction network of the major biological themes and their predicted relationship affected by MBSFL or SL, respectively, based on IPA, using the threshold of fold changes ≥ 1.6 and p < 0.01.
Figure 5
Figure 5
Effect of a synthetic FAs mixture on TNFα secretion in activated macrophages. (AC) PMA-primed THP-1 cells were treated with 250 µM FAs mixture (MixFA) or 2 µg/mL DEX, followed by stimulation with 10 ng/mL LPS (A), 50 ng/mL Pam3 (B), or 1 ng/mL Pam2 (C) for 20 h. (DF) J774A.1 macrophages were treated with 250 µM MixFA or 1.2 µg/mL DEX, followed by stimulation with 7.5 ng/mL LPS (D), 50 ng/mL Pam3 (E), or 25 ng/mL Pam2 (F) for 24 h. Results were compared to vehicle-treated (C-OH) stimulated controls and untreated and unstimulated cells (GM; Negative control). TNFα in the medium was measured by ELISA (n = 8–10), ns: not significant, **** p < 0.0001.
Figure 6
Figure 6
Effect of BSFL oil treatment on the clinical signs of dextran sulfate sodium (DSS)-induced colitis: (A) FA composition of diets containing 20% soybean oil, palm oil, or BSFL oil; (B) Percentage change in body weight; (C) Disease activity index (DAI), a summation of body weight loss, stool consistency, and fecal blood; (D) Representative pictures displaying colonic tissues length; (E) Changes in colon length; (F) Changes in spleen weight. Data presented indicate the mean ± SEM (n = 6–10), ns: not significant, * p < 0.05, ** p < 0.01, *** p < 0.001, **** p < 0.0001.
Figure 7
Figure 7
Histologic markers of inflammation and myeloperoxidase (MPO) activity in colon tissues of DSS-induced colitis mice fed with a soybean oil-, palm oil-, or BSFL oil-based diet compared to healthy mice fed with a soybean oil-based diet (control). Colonic histopathological score of (A) Lymphocyte infiltration; (B) Neutrophil infiltration; (C) Crypt loss; (D) Representative images of hematoxylin and eosin (H&E) staining of colon tissue from each group (original magnification ×10); (E) MPO activity in colon tissue. Values are the mean ± SEM (n = 4–10), ns: not significant, ** p < 0.01, *** p < 0.001, **** p < 0.0001.
Figure 8
Figure 8
Time-dependent fecal immunoglobulin A (IgA) concentrations of mice fed with BSFL oil, soybean oil, or palm oil diet and treated with DSS compared to healthy mice fed according to a soybean oil-based diet (control). Values are the mean ± SEM (n = 7–10); ns: not significant, * p < 0.05, **** p < 0.0001 relative to control, ^ p < 0.05, ^^^^ p < 0.0001 relative to soybean oil+ DSS.

Similar articles

Cited by

References

    1. Lu Y., Li X., Liu S., Zhang Y., Zhang D. Toll-like Receptors and Inflammatory Bowel Disease. Front. Immunol. 2018;9:72. doi: 10.3389/fimmu.2018.00072. - DOI - PMC - PubMed
    1. Płóciennikowska A., Hromada-Judycka A., Borzęcka K., Kwiatkowska K. Co-Operation of TLR4 and Raft Proteins in LPS-Induced pro-Inflammatory Signaling. Cell. Mol. Life Sci. 2015;72:557–581. doi: 10.1007/s00018-014-1762-5. - DOI - PMC - PubMed
    1. Lancaster G.I., Langley K.G., Berglund N.A., Kammoun H.L., Reibe S., Estevez E., Weir J., Mellett N.A., Pernes G., Conway J.R.W., et al. Evidence That TLR4 Is Not a Receptor for Saturated Fatty Acids but Mediates Lipid-Induced Inflammation by Reprogramming Macrophage Metabolism. Cell Metab. 2018;27:1096–1110.e5. doi: 10.1016/j.cmet.2018.03.014. - DOI - PubMed
    1. Wang Y., Qian Y., Fang Q., Zhong P., Li W., Wang L., Fu W., Zhang Y., Xu Z., Li X., et al. Saturated Palmitic Acid Induces Myocardial Inflammatory Injuries through Direct Binding to TLR4 Accessory Protein MD2. Nat. Commun. 2017;8:13997. doi: 10.1038/ncomms13997. - DOI - PMC - PubMed
    1. Nicholas D.A., Zhang K., Hung C., Glasgow S., Aruni A.W., Unternaehrer J., Payne K.J., Langridge W.H.R., De Leon M. Palmitic Acid Is a Toll-like Receptor 4 Ligand That Induces Human Dendritic Cell Secretion of IL-1β. PLoS ONE. 2017;12:e0176793. doi: 10.1371/journal.pone.0176793. - DOI - PMC - PubMed

Grants and funding

LinkOut - more resources