

Efficacy of Carotenoid-Loaded Gelatin Nanoparticles in Reducing Plasma Cytokines and Adipocyte Hypertrophy in Wistar Rats
- PMID: 37445834
- PMCID: PMC10341683
- DOI: 10.3390/ijms241310657
Efficacy of Carotenoid-Loaded Gelatin Nanoparticles in Reducing Plasma Cytokines and Adipocyte Hypertrophy in Wistar Rats
Abstract
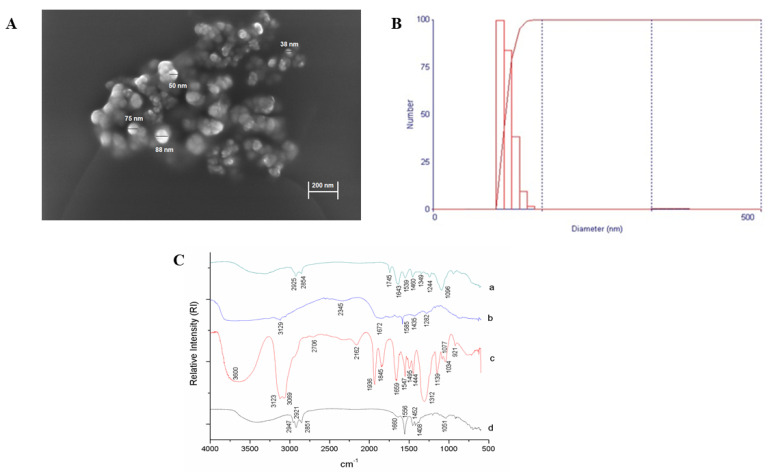
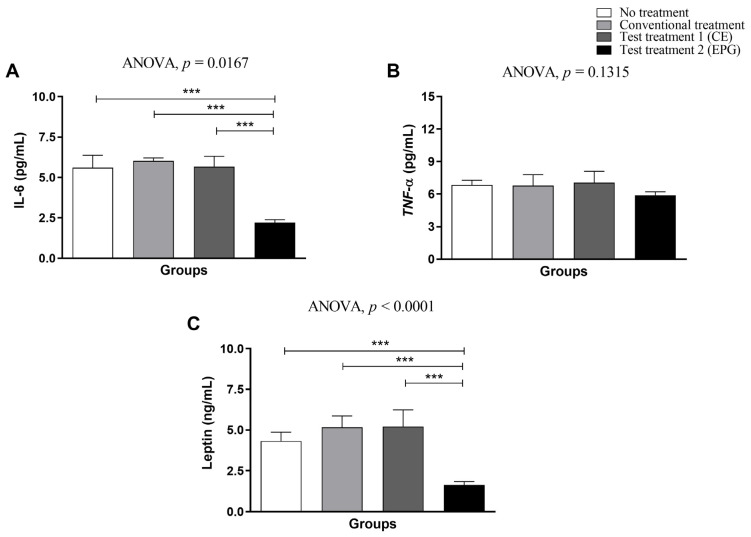
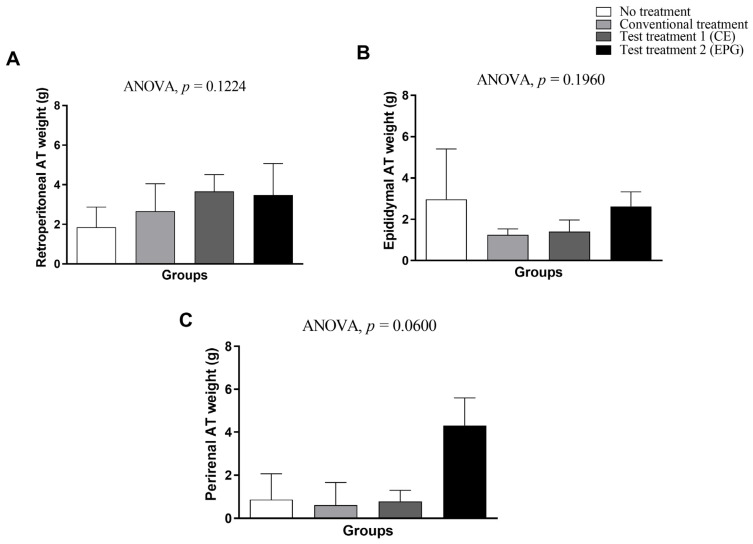
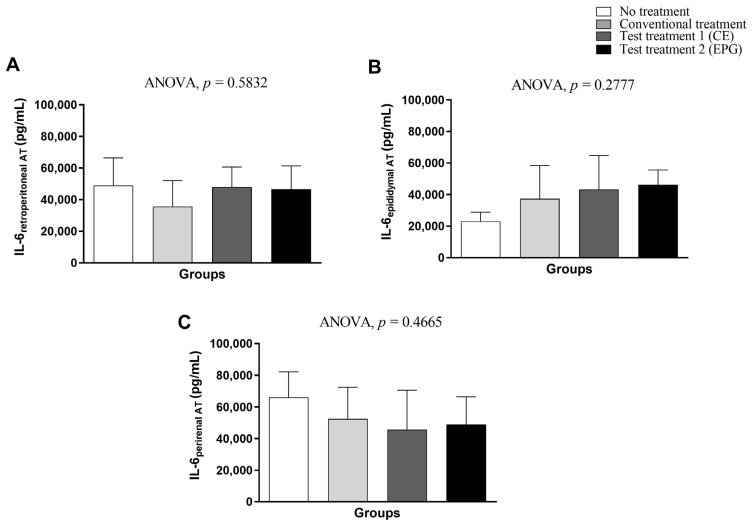
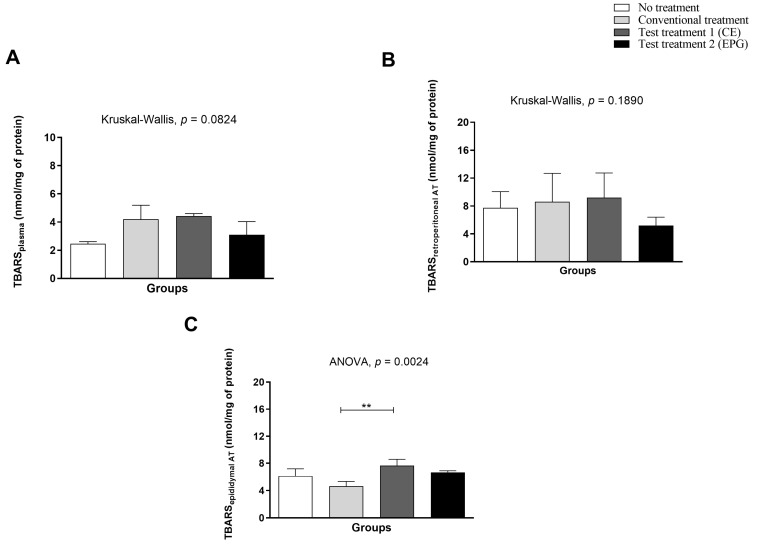
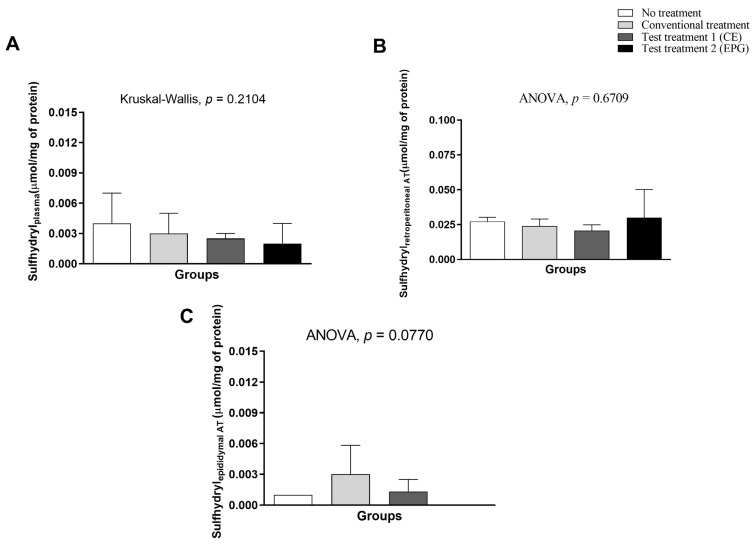
The present study investigated the effect of gelatin-based nanoparticles (EPG) loaded with a carotenoid-rich crude extract (CE) on systemic and adipose tissue inflammatory response in a model with inflammation induced by a high glycemic index and high glycemic load diet (HGLI). Nanoparticles synthesized were characterized by different physical and chemical methods. The in vivo investigation evaluated Wistar rats (n = 20, 11 days, adult male with 21 weeks) subdivided into untreated (HGLI diet), conventional treatment (nutritionally adequate diet), treatment 1 (HGLI + crude extract (12.5 mg/kg)), and treatment 2 (HGLI + EPG (50 mg/kg)) groups. Dietary intake, caloric intake and efficiency, weight, inflammatory cytokines tissue concentration, visceral adipose tissue (VAT) weight, histopathological analysis, and antioxidant activity in plasma and VAT were investigated. EPG showed the same physical and chemical characteristics as previous batches (95.2 nm, smooth surface, and chemical interactions between materials). The EPG-treated group was the only group promoting negative ∆dietary intake, ∆caloric efficiency, and ∆weight. In addition, it presented a significant reduction (p < 0.05) in IL-6 and leptin levels and a greater presence of multilocular adipocytes. The results suggest that EPG can act as a nutraceutical in adjuvant therapy for treating inflammatory diseases associated with adipose tissue accumulation.
Keywords: Cucumis melo L.; adiposity; anti-inflammatory agents; nanoparticles.
Conflict of interest statement
The authors declare no conflict of interest. The funders had no role in the design of this study; in the collection, analyses, or interpretation of data; in the writing of the manuscript; or in the decision to publish the results.
Figures
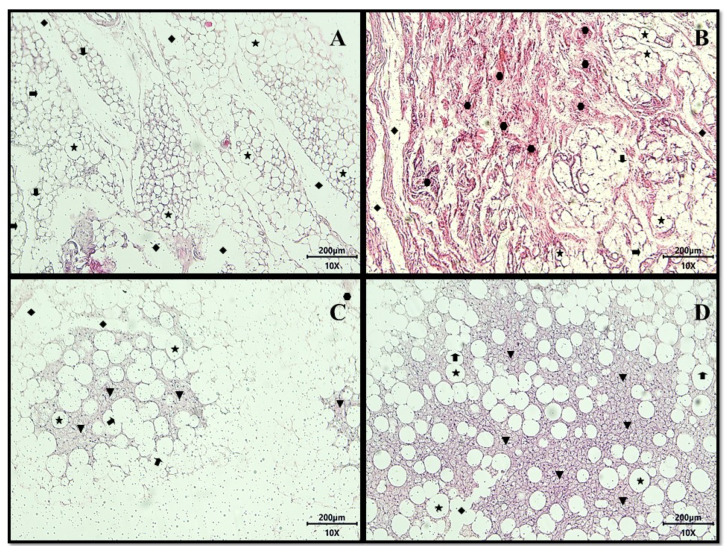
 ) primarily intact, showing focal areas of membrane destruction (
 ), extensive regions of lipolysis channels (
 ), vast areas of fibrosis consisting of dense non-patterned connective tissue in areas of adipocyte destruction (
 ), and the presence of the focal regions of multilocular adipocytes (
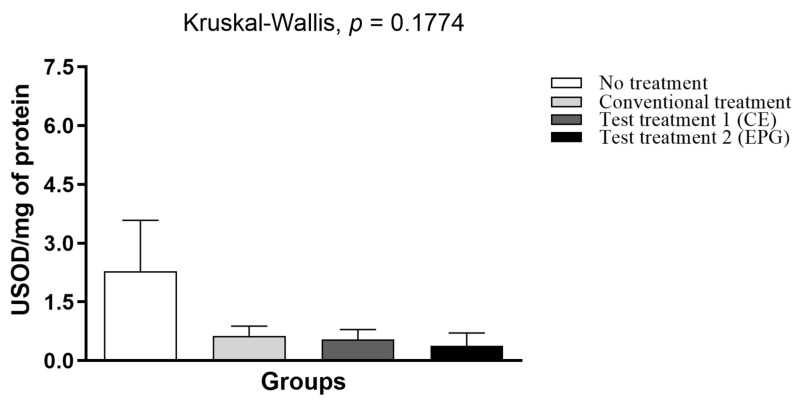
 ). No treatment: HGLI diet + 1 mL of water by gavage; conventional treatment: nutritionally adequate diet (Labina® feed) + 1 mL of water per gavage; test treatment 1: HGLI diet + 1 mL of CE at a concentration of 12.5 mg/kg by gavage; test treatment 2: HGLI diet + 1 mL of EPG at a concentration of 50 mg/kg by gavage; HGLI diet: mixture composed of Labina®, condensed milk and sugar (1:1:0.21 w/w/w); HGLI: high glycemic index and high glycemic load diet; CE: crude extract rich in carotenoids from Cantaloupe melons; EPG: crude extract rich in carotenoids from Cantaloupe melons nanoencapsulated in porcine gelatin.
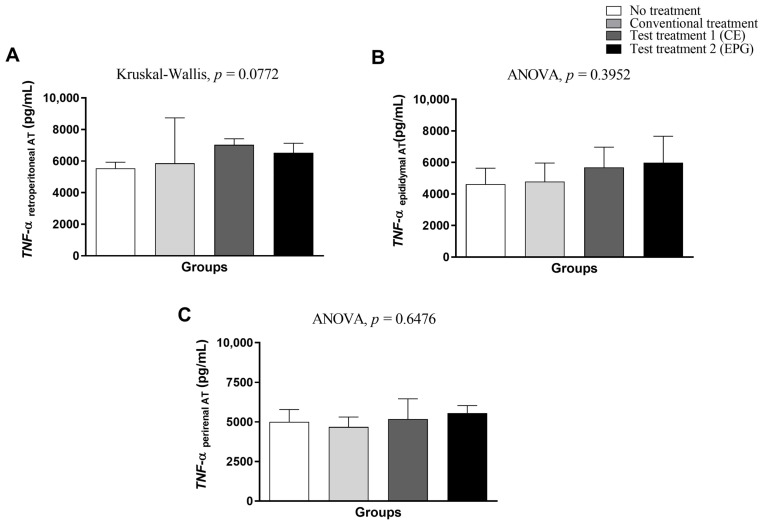
References
-
- Associação Brasileira para o Estudo da Obesidade e da Síndrome Metabólica . Diretrizes Brasileiras de Obesidade. 4th ed. ABESO; São Paulo, Brazil: 2016.
MeSH terms
Substances
Grants and funding
LinkOut - more resources
Full Text Sources
Medical
