. 2023 Jun 26;24(13):10655.
doi: 10.3390/ijms241310655.

Retinal Responses to Visual Stimuli in Interphotoreceptor Retinoid Binding-Protein Knock-Out Mice

Affiliations

Retinal Responses to Visual Stimuli in Interphotoreceptor Retinoid Binding-Protein Knock-Out Mice

Marci L DeRamus et al. Int J Mol Sci. .

Abstract

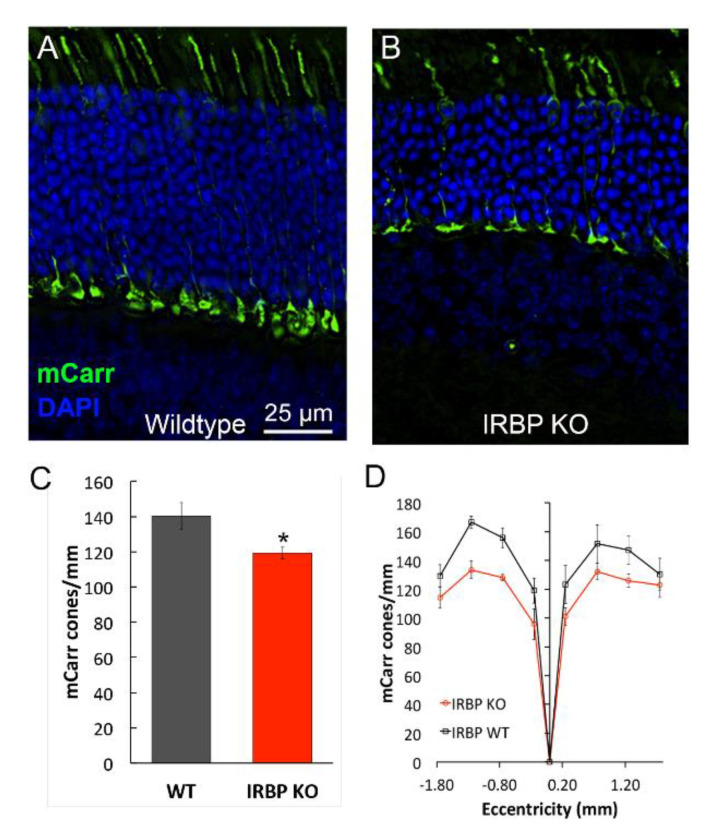
Interphotoreceptor retinoid-binding protein (IRBP) is an abundant glycoprotein in the subretinal space bound by the photoreceptor (PR) outer segments and the processes of the retinal pigmented epithelium (RPE). IRBP binds retinoids, including 11-cis-retinal and all-trans-retinol. In this study, visual function for demanding visual tasks was assessed in IRBP knock-out (KO) mice. Surprisingly, IRBP KO mice showed no differences in scotopic critical flicker frequency (CFF) compared to wildtype (WT). However, they did have lower photopic CFF than WT. IRBP KO mice had reduced scotopic and photopic acuity and contrast sensitivity compared to WT. IRBP KO mice had a significant reduction in outer nuclear layer (ONL) thickness, PR outer and inner segment, and full retinal thickness (FRT) compared to WT. There were fewer cones in IRBP KO mice. Overall, these results confirm substantial loss of rods and significant loss of cones within 30 days. Absence of IRBP resulted in cone circuit damage, reducing photopic flicker, contrast sensitivity, and spatial frequency sensitivity. The c-wave was reduced and accelerated in response to bright steps of light. This result also suggests altered retinal pigment epithelium activity. There appears to be a compensatory mechanism such as higher synaptic gain between PRs and bipolar cells since the loss of the b-wave did not linearly follow the loss of rods, or the a-wave. Scotopic CFF is normal despite thinning of ONL and reduced scotopic electroretinogram (ERG) in IRBP KO mice, suggesting either a redundancy or plasticity in circuits detecting (encoding) scotopic flicker at threshold even with substantial rod loss.

Keywords: ERG; IRBP; OKR; RPE; cone; flicker; retina; rod.


Conflict of interest statement

The authors declare no conflict of interest. The funders had no role in the design of the study; in the collection, analyses, or interpretation of data; in the writing of the manuscript; or in the decision to publish the results.

Figures

Figure 1
Figure 1
Optical coherence tomography analysis. OCT images for representative 4–6 week-old WT (A), IRBP KO (B), and IRBP Het (C) mice are shown; thickness scales for OCT are represented in (D). Ten marks (+) identify specific layers or layer-boundaries on the retina. OCT analysis of 4–6 week-old mice showed that IRBP KO mice had reductions in (D) FRT, (E) ONL, and (F) PR thicknesses compared to WT and IRBP Het. There were no differences between any of the groups for INL thickness measured at 4–6 weeks. Note: Different y scales for DF. (*** p < 0.001) (4–6 wks: WT n = 5, IRBP KO n = 9, IRBP Het n = 8; 13–15 months: WT n = 6, IRBP Het n = 4).
Figure 2
Figure 2
Measures of cone numbers via mCarr immunohistochemistry at 4–6 weeks. (A) WT and (B) IRBP KO mCarr immunohistochemistry images. (C) mCarr positive cones per mm across the entire retina for WT and IRBP KO mice. (D) mCarr positive cones per mm in WT and IRBP KO mice at eight different regions on either side of the optic nerve (nasal and temporal directions). Green = mCarr, Blue = DAPI, scale bar for A, and B = 25 µm. (* p < 0.05) (WT n = 4, IRBP KO n = 4).
Figure 3
Figure 3
Electroretinogram ERG recordings of 1-month-old WT and IRBP KO mice. (A) Dark-adapted bright flash responses (166,000 R* per rod) and (B) light-adapted responses to a flash of the same intensity (background light 505 nm, 2020 ± 160 R*/rod-s) showed reductions in IRBP KO mice. Average of three responses, AC bandpass filter 1.6–300 Hz. (C) Average scotopic threshold responses (0.14 ± 0.01 R* per rod) show reductions in IRBP KO mice. Average of 20 responses, AC bandpass filter 1.6–300 Hz. (D) Intensity response curves show reduced maximum amplitudes for b-waves of the IRBP KO but no difference in the I ½ compared to WT (black- and red-filled circles). (E) Typical recordings of the dark-adapted and (F) light-adapted oscillatory potentials, isolated from the standard ERG response by band pass filtering (34 to 70 Hz). OP area, demonstrated by the fill-to-zero coloring was measured between 0.015 and 0.15 ms. OP area was reduced in IRBP KO mice compared to WT (Table 1). All mice were 30 ± 2 days old. (WT n = 12, IRBP KO n = 11, IRBP Het n = 7).
Figure 4
Figure 4
PR responses measured via isolated retina ERG. (A) Representative WT responses to a saturating test flash before (pre), 5 s after (AP), and 215 s (post) after a 3 min conditioning step of light. WT AP responses were double that of the pre response. (B) Representative IRBP KO responses that were significantly lower than WT and showed a four-fold reduction in the level of AP compared to WT. (WT n = 9 trials and n = 4 mice, IRBP KO n = 8 trials and n = 3 mice, IRBP Het n = 17 trials and n = 6 mice).
Figure 5
Figure 5
The c-wave responses to 5 s steps of light recorded from WT (green traces) or IRBP KO mice (purple traces). The dims steps (bold solid lines) were in response to 1530 R*/rod/s (3.0), whereas the bright step responses were to stimuli of 42,300 R*/rod/s (thin dashed lines, 1.5). The thin red lines indicate exponential curves fit to the data from 0.8 to 4.95 s s.stimuli (1.46 ± 0.08 s, KO: 1.40 ± 0.11 s; p = 0.42). The IRBP KO mice had c-waves (Figure 5 purple traces) that were very similar to each despite the 28-fold increase in stimulus intensity, while the WT mice showed strikingly different c-wave amplitudes (Figure 5 green traces). A significant difference was seen when the ratios of the dim vs. bright light response c-wave amplitudes were calculated by the higher intensity response and comparing that ratio between groups (WT: 1.59 ± 0.09, KO: 1.13 ± 0.04, p = 0.0004).
Figure 6
Figure 6
Photopic flicker sweep ERG responses were used to calculate critical flicker frequency. IRBP KO mice show reduced CFF under photopic (0.0 or 1.2 log units attenuation) (red bars) compared with WT (gray bars) or IRBP Het animals (red/black-hatched bars). Stimulus frequencies swept from 0.1 to 30 Hz for scotopic flicker and 0.1–55 Hz for photopic flicker (WT mice n = 12, IRBP KO mice n = 13, IRBP Het mice n = 5). Analyses detailed in methods and Figure S1. * p < 0.05, ** p < 0.005.
Figure 7
Figure 7
Spatial acuity and contrast sensitivity measured using optokinetic reflex (OKR). (A) Photopic and (B) Scotopic contrast sensitivity was reduced in IRBP KO mice. (C) Photopic and scotopic spatial acuity were also reduced in IRBP KO mice. Note: A and B are displayed on a different y scale. (* p < 0.05) (WT n = 6, IRBP KO n = 5, IRBP Het n = 7).
Figure 7
Figure 7
Spatial acuity and contrast sensitivity measured using optokinetic reflex (OKR). (A) Photopic and (B) Scotopic contrast sensitivity was reduced in IRBP KO mice. (C) Photopic and scotopic spatial acuity were also reduced in IRBP KO mice. Note: A and B are displayed on a different y scale. (* p < 0.05) (WT n = 6, IRBP KO n = 5, IRBP Het n = 7).

Similar articles

Cited by

References

    1. Adler A.J., Evans C.D., Stafford W.F. Molecular properties of bovine interphotoreceptor retinol-binding protein. J. Biol. Chem. 1985;260:4850–4855. doi: 10.1016/S0021-9258(18)89149-9. - DOI - PubMed
    1. Saari J.C., Teller D.C., Crabb J.W., Bredberg L. Properties of an interphotoreceptor retinoid-binding protein from bovine retina. J. Biol. Chem. 1985;260:195–201. doi: 10.1016/S0021-9258(18)89715-0. - DOI - PubMed
    1. Bazan N.G., Reddy T.S., Redmond T.M., Wiggert B., Chader G.J. Endogenous fatty acids are covalently and noncovalently bound to interphotoreceptor retinoid-binding protein in the monkey retina. J. Biol. Chem. 1985;260:13677–13680. doi: 10.1016/S0021-9258(17)38777-X. - DOI - PubMed
    1. Gonzalez-Fernandez F. Interphotoreceptor retinoid-binding protein—An old gene for new eyes. Vis. Res. 2003;43:3021–3036. doi: 10.1016/j.visres.2003.09.019. - DOI - PubMed
    1. Eisenfeld A.J., Bunt-Milam A.H., Saari J.C. Immunocytochemical localization of retinoid-binding proteins in developing normal and RCS rats. [(accessed on 6 December 2017)];Prog. Clin. Biol. Res. 1985 190:231–240. Available online: http://www.ncbi.nlm.nih.gov/pubmed/3901036. - PubMed

MeSH terms

Substances

LinkOut - more resources