

DNA Methylation of Genes Participating in Hepatic Metabolisms and Function in Fetal Calf Liver Is Altered by Maternal Undernutrition during Gestation
- PMID: 37445858
- PMCID: PMC10341414
- DOI: 10.3390/ijms241310682
DNA Methylation of Genes Participating in Hepatic Metabolisms and Function in Fetal Calf Liver Is Altered by Maternal Undernutrition during Gestation
Abstract
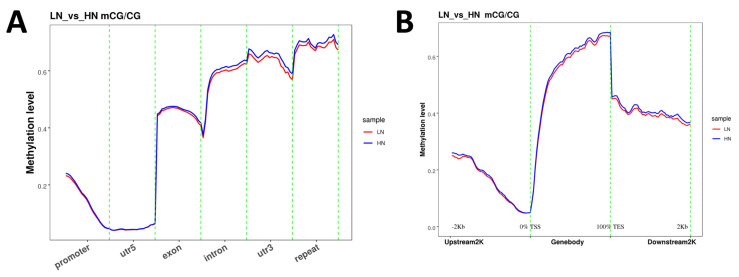
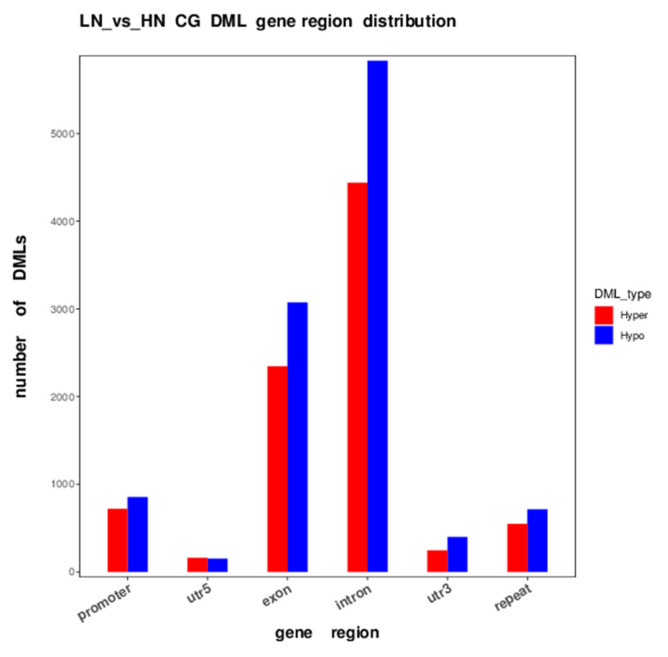
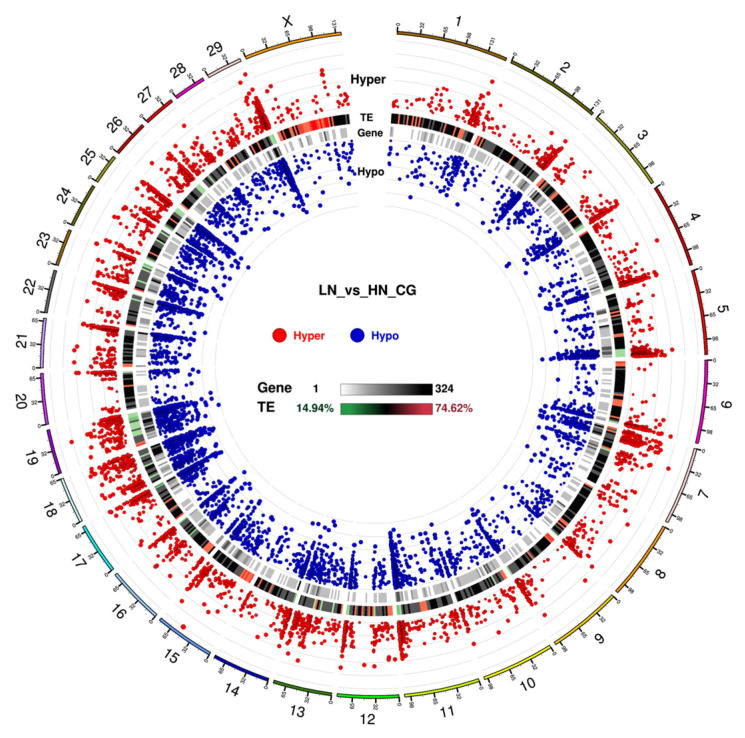
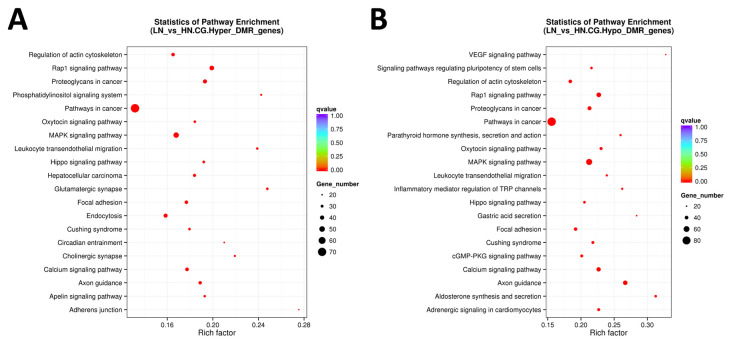
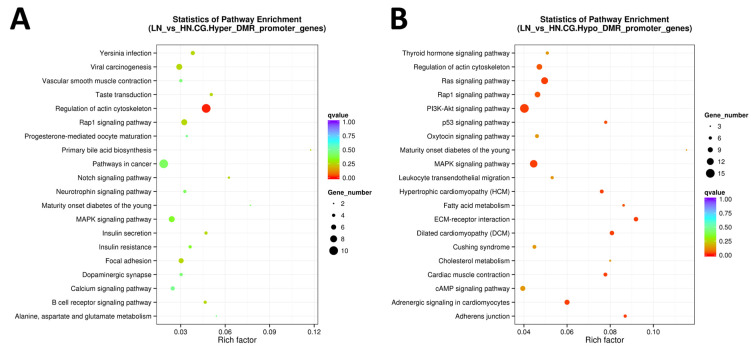
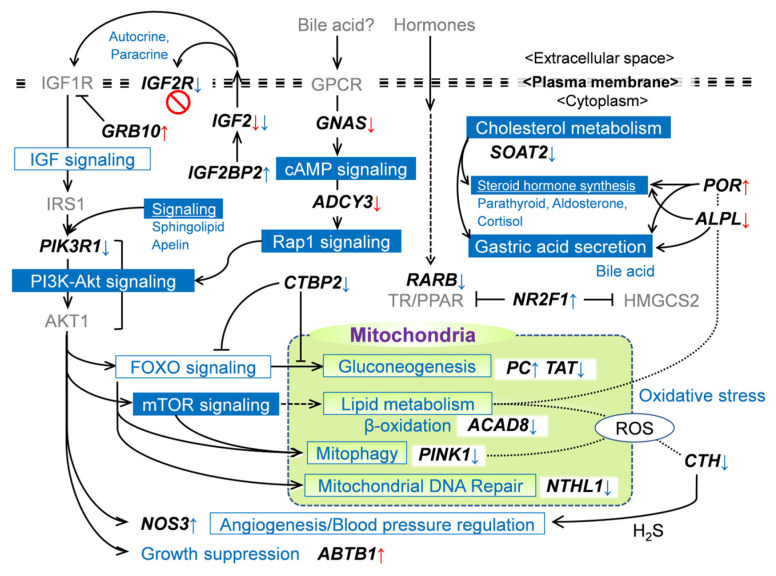
This study aimed to elucidate the effects of maternal undernutrition (MUN) on epigenetic modification of hepatic genes in Japanese Black fetal calves during gestation. Using a previously established experimental design feeding the dams with 60% (LN) or 120% (HN) of their global nutritional requirements during the 8.5-month gestational period, DNA methylation in the fetal liver was analyzed with reduced representation bisulfite sequencing (RRBS). The promoters and gene bodies in the LN fetuses were hypomethylated compared to HN fetuses. Pathway analysis showed that the genes with DMR in the exon/intron in the LN group were associated with pathways involved in Cushing syndrome, gastric acid secretion, and aldosterone synthesis and secretion. Promoter hypomethylation in the LN group was frequently observed in genes participating in various signaling pathways (thyroid hormone, Ras/Rap1, PIK3-Akt, cAMP), fatty acid metabolism, and cholesterol metabolism. The promoter hypomethylated genes ALPL and GNAS were upregulated in the LN group, whereas the promoter hypermethylated genes GRB10 and POR were downregulated. The intron/exon hypomethylated genes IGF2, IGF2R, ACAD8, TAT, RARB, PINK1, and SOAT2 were downregulated, whereas the hypermethylated genes IGF2BP2, NOS3, and NR2F1 were upregulated. Collectively, MUN alters the promoter and gene body methylation of genes associated with hepatic metabolisms (energy, cholesterol, mitochondria) and function, suggesting an impact of altered gene methylation on the dysregulation of gene expression in the fetal liver.
Keywords: DNA methylation; RRBS; epigenetics; fetal growth restriction; liver; maternal undernutrition; mitophagy.
Conflict of interest statement
The authors declare no conflict of interest.
Figures
Similar articles
-
Maternal Undernutrition Affects Fetal Thymus DNA Methylation, Gene Expression, and, Thereby, Metabolism and Immunopoiesis in Wagyu (Japanese Black) Cattle.Int J Mol Sci. 2024 Aug 26;25(17):9242. doi: 10.3390/ijms25179242. Int J Mol Sci. 2024. PMID: 39273192 Free PMC article.
-
Maternal Undernutrition during Pregnancy Alters Amino Acid Metabolism and Gene Expression Associated with Energy Metabolism and Angiogenesis in Fetal Calf Muscle.Metabolites. 2021 Aug 28;11(9):582. doi: 10.3390/metabo11090582. Metabolites. 2021. PMID: 34564398 Free PMC article.
-
Maternal Nutrient Restriction Disrupts Gene Expression and Metabolites Associated with Urea Cycle, Steroid Synthesis, Glucose Homeostasis, and Glucuronidation in Fetal Calf Liver.Metabolites. 2022 Feb 24;12(3):203. doi: 10.3390/metabo12030203. Metabolites. 2022. PMID: 35323646 Free PMC article.
-
Epigenetic changes in the hypothalamic proopiomelanocortin and glucocorticoid receptor genes in the ovine fetus after periconceptional undernutrition.Endocrinology. 2010 Aug;151(8):3652-64. doi: 10.1210/en.2010-0094. Epub 2010 Jun 23. Endocrinology. 2010. PMID: 20573728
-
Maternal nutrient restriction in mid-to-late gestation influences fetal mRNA expression in muscle tissues in beef cattle.BMC Genomics. 2017 Aug 18;18(1):632. doi: 10.1186/s12864-017-4051-5. BMC Genomics. 2017. PMID: 28821223 Free PMC article.
Cited by
-
Transcriptomic Analysis of Newborn Hanwoo Calves: Effects of Maternal Overnutrition during Mid- to Late Pregnancy on Subcutaneous Adipose Tissue and Liver.Genes (Basel). 2024 May 28;15(6):704. doi: 10.3390/genes15060704. Genes (Basel). 2024. PMID: 38927640 Free PMC article.
-
DNA Methylation of Postnatal Liver Development in Pigs.Genes (Basel). 2024 Aug 13;15(8):1067. doi: 10.3390/genes15081067. Genes (Basel). 2024. PMID: 39202427 Free PMC article.
-
Interaction Between CYP1A2-Related Caffeine Metabolism and Vitamin B12/Folate Status in Patients with Metabolic Syndrome: A Novel Biomarker Axis.Metabolites. 2025 Jul 4;15(7):450. doi: 10.3390/metabo15070450. Metabolites. 2025. PMID: 40710550 Free PMC article.
-
Maternal Undernutrition Affects Fetal Thymus DNA Methylation, Gene Expression, and, Thereby, Metabolism and Immunopoiesis in Wagyu (Japanese Black) Cattle.Int J Mol Sci. 2024 Aug 26;25(17):9242. doi: 10.3390/ijms25179242. Int J Mol Sci. 2024. PMID: 39273192 Free PMC article.
-
Promoter H3K4me3 and Gene Expression Involved in Systemic Metabolism Are Altered in Fetal Calf Liver of Nutrient-Restricted Dams.Int J Mol Sci. 2025 Aug 4;26(15):7540. doi: 10.3390/ijms26157540. Int J Mol Sci. 2025. PMID: 40806668 Free PMC article.
References
-
- Govoni K.E., Reed S.A., Zinn S.A. Cell biology symposium: Metabolic responses to stress: From animal to cell: Poor maternal nutrition during gestation: Effects on offspring whole-body and tissue-specific metabolism in livestock species. J. Anim. Sci. 2019;97:3142–3152. doi: 10.1093/jas/skz157. - DOI - PMC - PubMed
-
- Muroya S., Zhang Y., Kinoshita A., Otomaru K., Oshima K., Gotoh Y., Oshima I., Sano M., Roh S., Oe M., et al. Maternal Undernutrition during Pregnancy Alters Amino Acid Metabolism and Gene Expression Associated with Energy Metabolism and Angiogenesis in Fetal Calf Muscle. Metabolites. 2021;11:582. doi: 10.3390/metabo11090582. - DOI - PMC - PubMed
-
- Vonnahme K.A., Hess B.W., Hansen T.R., McCormick R.J., Rule D.C., Moss G.E., Murdoch W.J., Nijland M.J., Skinner D.C., Nathanielsz P.W., et al. Maternal undernutrition from early- to mid-gestation leads to growth retardation, cardiac ventricular hypertrophy, and increased liver weight in the fetal sheep. Biol. Reprod. 2003;69:133–140. doi: 10.1095/biolreprod.102.012120. - DOI - PubMed
MeSH terms
Substances
Grants and funding
LinkOut - more resources
Full Text Sources
Medical
Molecular Biology Databases
Miscellaneous
