. 2023 Jun 28;24(13):10763.
doi: 10.3390/ijms241310763.

Establishment and Characterization of Free-Floating 3D Macrophage Programming Model in the Presence of Cancer Cell Spheroids

Affiliations

Establishment and Characterization of Free-Floating 3D Macrophage Programming Model in the Presence of Cancer Cell Spheroids

Ksenija Korotkaja et al. Int J Mol Sci. .

Abstract

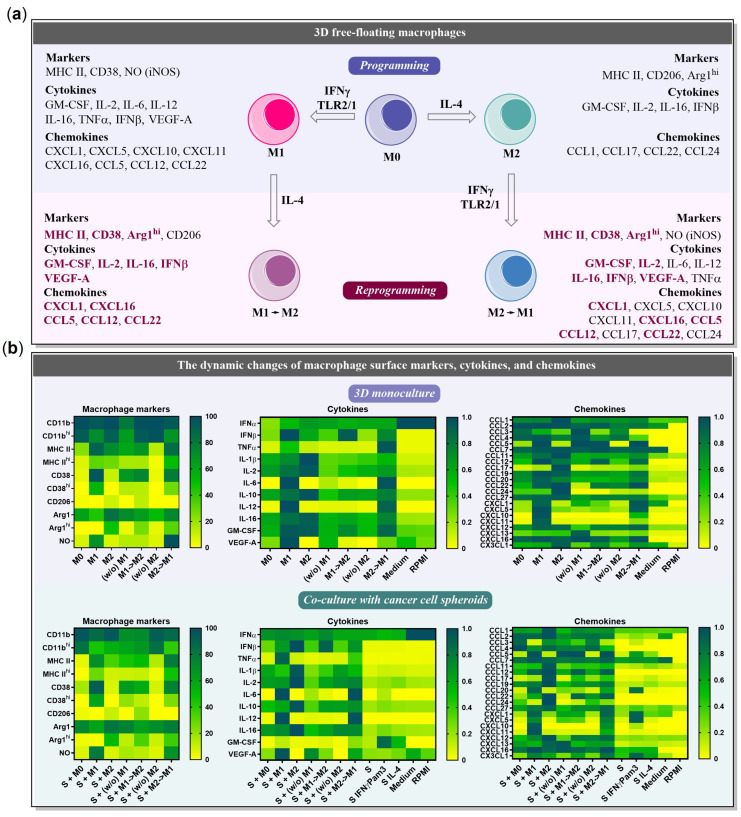
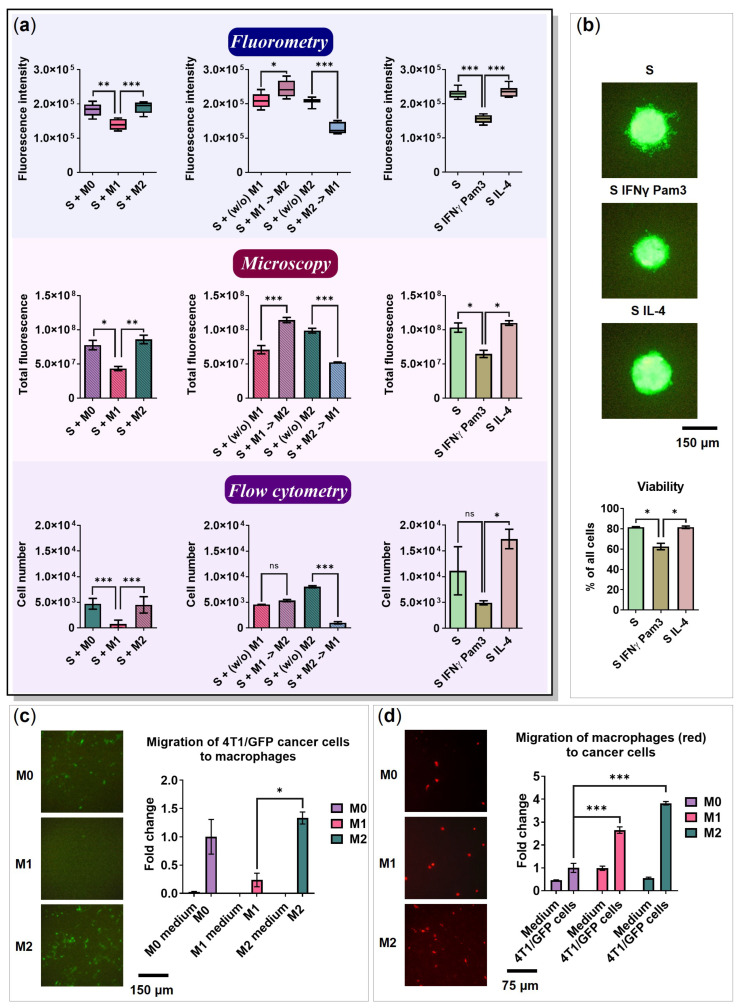
Reprogramming of tumor-associated macrophages (TAMs) is a promising strategy for cancer immunotherapy. Several studies have shown that cancer cells induce/support the formation of immunosuppressive TAMs phenotypes. However, the specific factors that orchestrate this immunosuppressive process are unknown or poorly studied. In vivo studies are expensive, complex, and ethically constrained. Therefore, 3D cell interaction models could become a unique framework for the identification of important TAMs programming factors. In this study, we have established and characterized a new in vitro 3D model for macrophage programming in the presence of cancer cell spheroids. First, it was demonstrated that the profile of cytokines, chemokines, and surface markers of 3D-cultured macrophages did not differ conceptually from monolayer-cultured M1 and M2-programmed macrophages. Second, the possibility of reprogramming macrophages in 3D conditions was investigated. In total, the dynamic changes in 6 surface markers, 11 cytokines, and 22 chemokines were analyzed upon macrophage programming (M1 and M2) and reprogramming (M1→M2 and M2→M1). According to the findings, the reprogramming resulted in a mixed macrophage phenotype that expressed both immunosuppressive and anti-cancer immunostimulatory features. Third, cancer cell spheroids were shown to stimulate the production of immunosuppressive M2 markers as well as pro-tumor cytokines and chemokines. In summary, the newly developed 3D model of cancer cell spheroid/macrophage co-culture under free-floating conditions can be used for studies on macrophage plasticity and for the development of targeted cancer immunotherapy.

Keywords: 3D cell culture models; cancer cell spheroids; chemokines; cytokines; macrophage plasticity; macrophage polarization; macrophage reprogramming; tumor-associated macrophages.


Conflict of interest statement

The authors declare no conflict of interest.

Figures

Figure 1
Figure 1
BMDMs programming under free-floating 3D conditions. BMDMs were plated in a 96-well black round bottom ultra-low attachment plate in a medium containing the following programming factors: 50 ng/mL recombinant mouse IFNγ and 100 ng/mL Pam3SCK4 to achieve M1 phenotype or with 20 ng/mL IL-4 to achieve M2 phenotype. M0 represents the initial BMDM phenotype. (a) Bright-field microscopy of M0/M1/M2 48 h after activation. (b) Nitric oxide test 72 h after activation (n = 3). (c) Flow cytometry determined marker expression of 3D polarized macrophages 72 h after activation; data are presented as % of all cells. Flow cytometry analysis showing representative staining of CD38 on the x-axis and CD206 on the y-axis. (d) The concentration of cytokines in the medium of 3D polarized macrophages 72 h after activation was determined using ELISA or Luminex assay. Medium—RPMI-1640 medium supplemented with 10% FBS, 50 U/mL penicillin, 50 µg/mL streptomycin, 2 mM L-glutamine, and 10% L929-conditioned medium (CM). Data are shown as the mean of two experiments ± SEM (n = 2, each experiment is a pool of 4 biological replicates). * p < 0.05; ** p < 0.01; *** p < 0.001; ns—non-significant.
Figure 2
Figure 2
BMDMs reprogramming under 3D free-floating conditions. (a) Scheme of reprogramming. BMDMs were polarized into M1 or M2 phenotype for 48 h, then the cells were collected, washed with PBS, and plated in a fresh macrophage medium. On Day 3, 50 ng/mL of recombinant mouse IFNγ and 100 ng/mL Pam3SCK4 were added to the M2 polarized macrophages and 20 ng/mL IL-4 to M1. For achieving (w/o) M1 and (w/o) M2 phenotype, cells were cultivated in a medium without factors from Day 2 till Day 6. (b) Bright-field microscopy and nitric oxide test of reprogrammed macrophages (M1→M2 and M2→M1) and cultivated macrophages ((w/o) M1 and (w/o) M2)) before (Day 2) and after reprogramming/cultivation (Day 6). (c) Marker expression of reprogrammed macrophages on Day 6. Cells were analyzed using flow cytometry; data are presented as % of total cells. Flow cytometry analysis showing representative staining of CD38 on the x-axis and CD206 on the y-axis. (d) The concentration of cytokines in the medium of reprogrammed macrophages on Day 6. Medium—RPMI-1640 medium containing 10% FBS, 50 U/mL penicillin, 50 µg/mL streptomycin, 2 mM L-glutamine, and 10% L929-CM. Data are shown as the mean of two experiments ± SEM (n = 2, each experiment is a pool of 4 biological replicates). * p < 0.05; ** p < 0.01; *** p < 0.001; ns—non-significant.
Figure 3
Figure 3
BMDMs programming in the presence of 4T1/GFP cancer cell spheroid under 3D conditions. (a) Experimental design for the generation of the 3D cancer cell spheroid model with free-floating M0, M1, and M2 macrophages. First, 4T1/GFP murine mammary cancer cells were plated in a 96-well black round bottom ultra-low attachment plate to achieve spheroids (S). After 48 h, BMDMs were added to the cancer cell spheroids. Cells were co-cultivated for 24 h to achieve TAM-like features, and then the factors were added to polarize cells towards M0, M1, and M2 phenotypes. After 72 h, co-cultures S + M0, S + M1, and S + M2 were analyzed. (b) Nitric oxide test, bright-field microscopy, and fluorescence microscopy of the 3D cancer cell model with M0, M1, and M2 macrophages 72 h after activation; cancer cells express GFP. (c) Flow cytometry determined marker expression of 3D polarized macrophages 72 h after activation; data are presented as % of GFP-negative (GFP) cell population. Flow cytometry analysis showing representative staining of CD38 on the x-axis and CD206 on the y-axis. (d) The concentration of secreted cytokines in the media of S + M0, S + M1, and S + M2 72 h after activation. S—spheroid; medium—RPMI-1640 medium containing 10% FBS, 50 U/mL penicillin, 50 µg/mL streptomycin, 2 mM L-glutamine, and 10% L929-CM. Data are shown as the mean of two experiments ± SEM (n = 2, each experiment is a pool of 4 biological replicates). * p < 0.05; ** p < 0.01; *** p < 0.001; ns—non-significant.
Figure 4
Figure 4
BMDMs reprogramming in the presence of 4T1/GFP cancer cell spheroid. (a) Experimental design for the reprogramming of free-floating M1 and M2 macrophages in the presence of cancer cell spheroid. BMDMs were activated for 48 h in 3D free-floating conditions to achieve M1 and M2 phenotypes. In parallel, 4T1/GFP murine mammary cancer cells were plated in a 96-well black round bottom ultra-low attachment plate to generate cancer cell spheroids (48 h). The activated M1 and M2 were added to the 4T1/GFP spheroids. Cells were co-cultivated for 24 h to achieve TAM-like features, and then the factors were added to reprogram cells towards M1→M2 (IL-4) and M2→M1 (IFNγ/Pam3SCK4) phenotypes. The M1 and M2 macrophages added to the 4T1/GFP spheroids without (w/o) reprogramming factors are indicated as S + (w/o) M1 and S + (w/o) M2, respectively. After 72 h, co-cultures S + (w/o) M1, S + M1→M2, S + (w/o) M2, and S + M2→M1 were analyzed. (b) Nitric oxide test, bright-field microscopy, and fluorescence microscopy of the 3D cancer cell spheroids and macrophages 72 h after reprogramming; cancer cells express green fluorescent protein gene (GFP). (c) Flow cytometry analysis of markers of reprogrammed macrophages in total GFP-negative (GFP) cell population 72 h after reprogramming; data are presented as % of GFP cells. Flow cytometry analysis of CD38 on the x-axis and CD206 on the y-axis. (d) Analysis of cytokines in the media of S + (w/o) M1, S + M1→M2, S + (w/o) M2, and S + M2→M1 72 h after reprogramming. S—spheroid; medium—RPMI-1640 medium containing 10% FBS, 50 U/mL penicillin, 50 µg/mL streptomycin, 2 mM L-glutamine, and 10% L929-CM. Data are shown as the mean of two experiments ± SEM (n = 2, each experiment is a pool of 4 biological replicates). * p < 0.05; ** p < 0.01; *** p < 0.001; ns—non-significant.
Figure 5
Figure 5
Chemokines produced by programmed macrophages and 4T1/GFP cancer cell spheroid under 3D free-floating conditions. Cell-conditioned medium from 3D monocultures and co-cultures was collected 72 h after programming. Then, the chemokines were determined using Luminex or ELISA. (a) Chemokines produced by 4T1/GFP cancer cell spheroid without stimulation and upon stimulation with IL-4 or IFNγ/Pam3SCK4. (b) Chemokines found in the medium of programmed macrophages in the presence (S + M) and absence (M) of cancer cell spheroids. S—spheroid; (w/o)—preprogrammed macrophages cultured without programming factors; medium—RPMI-1640 medium containing 10% FBS, 50 U/mL penicillin, 50 µg/mL streptomycin, 2 mM L-glutamine, and 10% L929-CM. Data are shown as the mean of two experiments ± SEM (n = 2, each experiment is a pool of 4 biological replicates). * p < 0.05; ** p < 0.01; *** p < 0.001.
Figure 6
Figure 6
Chemokines in the medium of reprogrammed macrophages in the presence (S + M) and absence (M) of cancer cell spheroids. Cell media from 3D monocultures and co-cultures were collected 72 h after reprogramming. Then, the chemokines were determined using Luminex and ELISA. S—spheroid; (w/o)—preprogrammed macrophages cultured without programming factors. Data are shown as the mean of two experiments ± SEM (n = 2, each experiment is a pool of 4 biological replicates). * p < 0.05; ** p < 0.01; *** p < 0.001; ns—non-significant.
Figure 7
Figure 7
Summary of cell surface marker and secretome profiles of programmed and reprogrammed free-floating 3D macrophages. (a) Markers, cytokines, and chemokines expressed by both reprogrammed phenotypes M1→M2 and M2→M1 are highlighted in purple. iNOS—inducible NO synthase. (b) Heatmap of chemokines produced by BMDMs and 4T1/GFP cancer cell spheroids under 3D free-floating conditions. M0—undifferentiated BMDMs; M1—BMDMs programmed with IFNγ/Pam3SCK4; M2—BMDMs programmed with IL-4; (w/o) M1 and (w/o) M2—pre-programmed macrophages cultivated without (w/o) activation factors IFNγ/Pam3SCK4 and IL-4, respectively; M1→M2: M1 macrophages reprogrammed to M2 with IL-4 (IFNγ/Pam3SCK4 was removed); M2→M1: M2 macrophages reprogrammed to M1 with IFNγ/Pam3SCK4 (IL-4 was removed); S—4T1/GFP cancer cell spheroids; medium—RPMI-1640 medium supplemented with 10% FBS, 50 U/mL penicillin, 50 µg/mL streptomycin, 2 mM L-glutamine, and 10% L929-CM, representing the BMDMs cultivation medium; RPMI—RPMI medium without supplements. Scale: in the case of macrophage markers—the percent of maximal expression (0–100%); in the case of cytokines and chemokines—the normalized amount of secreted cytokine (0–1).
Figure 8
Figure 8
4T1 breast cancer cell spheroids affect macrophages. Macrophages were co-cultivated with breast cancer cell spheroids 24 h before programming or reprogramming and 72 h after programming or reprogramming. M1 phenotype was achieved by the addition of IFNγ/Pam3SCK4, M2 phenotype was achieved by the addition of IL-4. (a) Changes in cell marker levels of macrophages cultivated in the presence (S + M) and absence (M) of 4T1/GFP cancer cell spheroids. Cells have been analyzed using flow cytometry. (b) Flow cytometry analysis of MHC II on the x-axis and CD38 on the y-axis in GFP-negative cell population. (c) Flow cytometry analysis of MHC II on the x-axis and CD11b on the y-axis in GFP-negative cell population. (d) Changes in the levels of secreted cytokines of macrophages cultivated in the presence (S + M) and absence (M) of cancer cell spheroids detected by Luminex/ELISA. Data are shown as the mean of two experiments ± SEM (n = 2, each experiment is a pool of 4 biological replicates). * p < 0.05; ** p < 0.01; *** p < 0.001; ns—non-significant.
Figure 9
Figure 9
The size of the 4T1/GFP cell spheroids (a,b) and cell migration (c,d). (a) The size of the spheroids cultivated with different types of macrophages is determined using fluorometry (n = 6), microscopy (n = 3), and flow cytometry (n = 2, each experiment is a pool of 4 biological replicates). The 4T1/GFP cell spheroids were cocultured with macrophages, as shown in Figure 3a and Figure 4a, and analyzed on Day 6. (b) Representative fluorescent microscopy images and viability (flow cytometry) of cancer cell spheroids cultivated with IFNγ/Pam3SCK4 or IL-4. (c) Representative fluorescent microscopy images and fold change of 4T1/GFP cancer cells migrated towards M0, M1, and M2 macrophages through 8.0 μm pore inserts (n = 3). The cancer cell migration towards respective media (M0, M1, and M2) was used as a control. (d) Representative fluorescent microscopy images and fold change of M0, M1, and M2 macrophages migrated towards 4T1/GFP cancer cells through 8.0 μm pore inserts (n = 3). Macrophages have been labeled with CellTracker™ CM-DiI fluorescent dye (red). The macrophage migration to the 4T1/GFP cell culture medium was used as a control. Data are shown as mean ± SEM. * p < 0.05; ** p < 0.01; *** p < 0.001; ns—non-significant.

Similar articles

Cited by

References

    1. Zhou J., Tang Z., Gao S., Li C., Feng Y., Zhou X. Tumor-Associated Macrophages: Recent Insights and Therapies. Front. Oncol. 2020;10:188. doi: 10.3389/fonc.2020.00188. - DOI - PMC - PubMed
    1. Mills C. M1 and M2 Macrophages: Oracles of Health and Disease. Crit. Rev. Immunol. 2012;32:463–488. doi: 10.1615/CritRevImmunol.v32.i6.10. - DOI - PubMed
    1. Müller E., Speth M., Christopoulos P.F., Lunde A., Avdagic A., Øynebråten I., Corthay A. Both Type I and Type II Interferons Can Activate Antitumor M1 Macrophages When Combined with TLR Stimulation. Front. Immunol. 2018;9:2520. doi: 10.3389/fimmu.2018.02520. - DOI - PMC - PubMed
    1. Müller E., Christopoulos P.F., Halder S., Lunde A., Beraki K., Speth M., Øynebråten I., Corthay A. Toll-like Receptor Ligands and Interferon-γ Synergize for Induction of Antitumor M1 Macrophages. Front. Immunol. 2017;8:1383. doi: 10.3389/fimmu.2017.01383. - DOI - PMC - PubMed
    1. Jablonski K.A., Amici S.A., Webb L.M., De Dios Ruiz-Rosado J., Popovich P.G., Partida-Sanchez S., Guerau-de-Arellano M. Novel Markers to Delineate Murine M1 and M2 Macrophages. PLoS ONE. 2015;10:e0145342. doi: 10.1371/journal.pone.0145342. - DOI - PMC - PubMed