. 2023 Jun 28;24(13):10764.
doi: 10.3390/ijms241310764.

Unraveling the Roles of miR-204-5p and HMGA2 in Papillary Thyroid Cancer Tumorigenesis

Affiliations

Unraveling the Roles of miR-204-5p and HMGA2 in Papillary Thyroid Cancer Tumorigenesis

Cindy Van Branteghem et al. Int J Mol Sci. .

Abstract

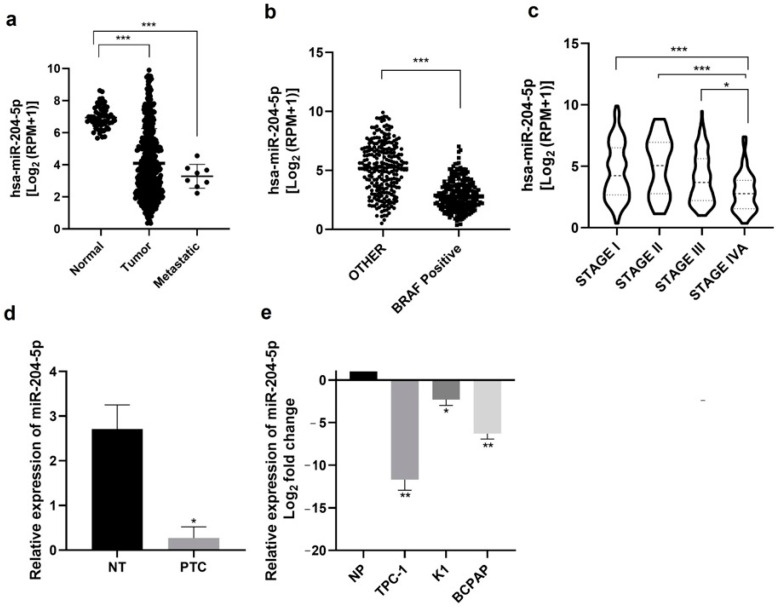
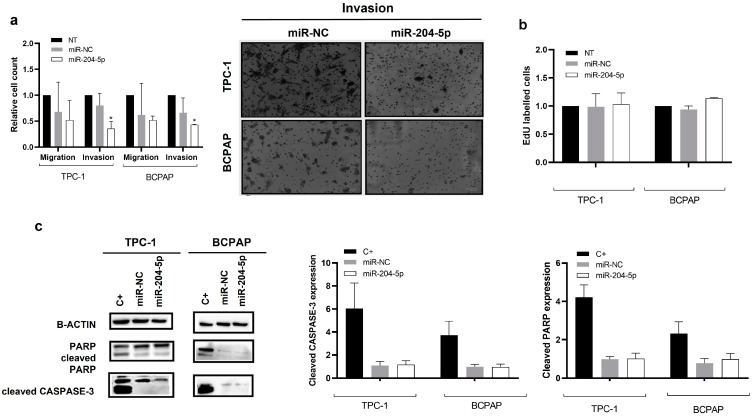
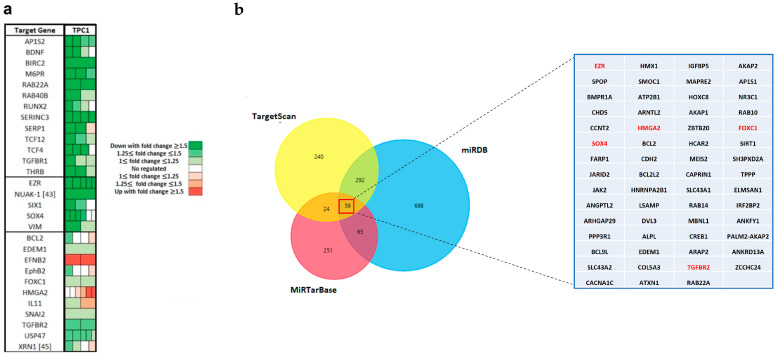
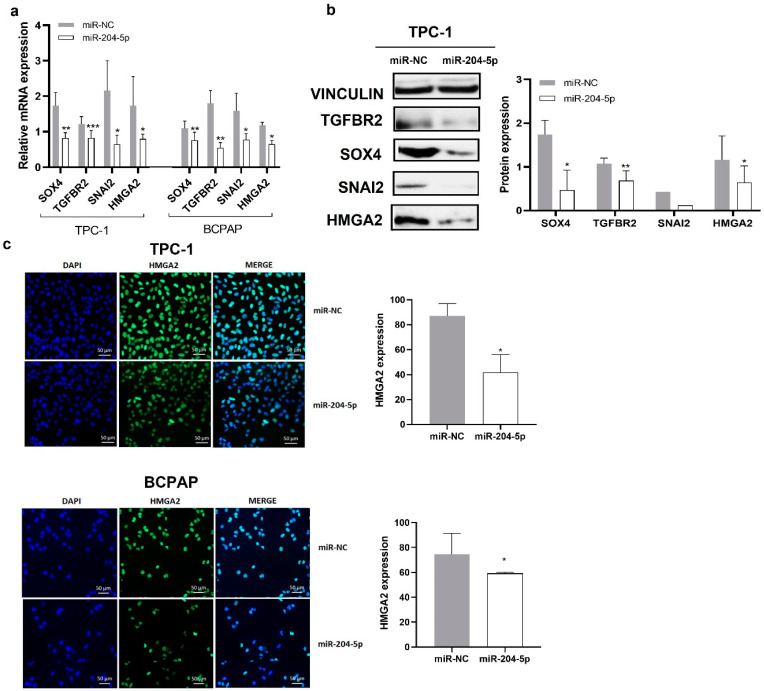
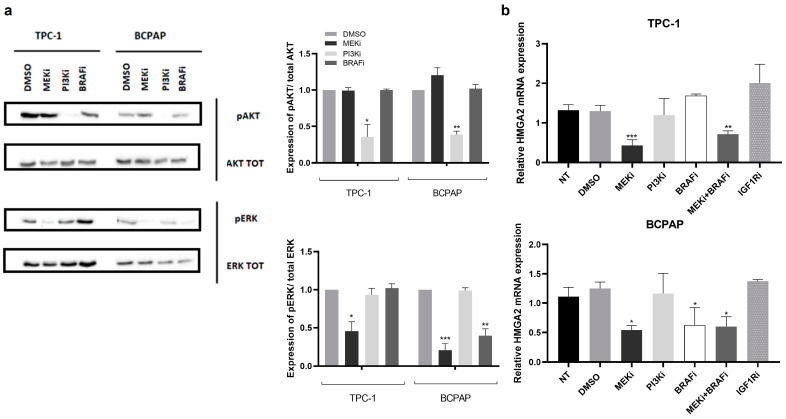
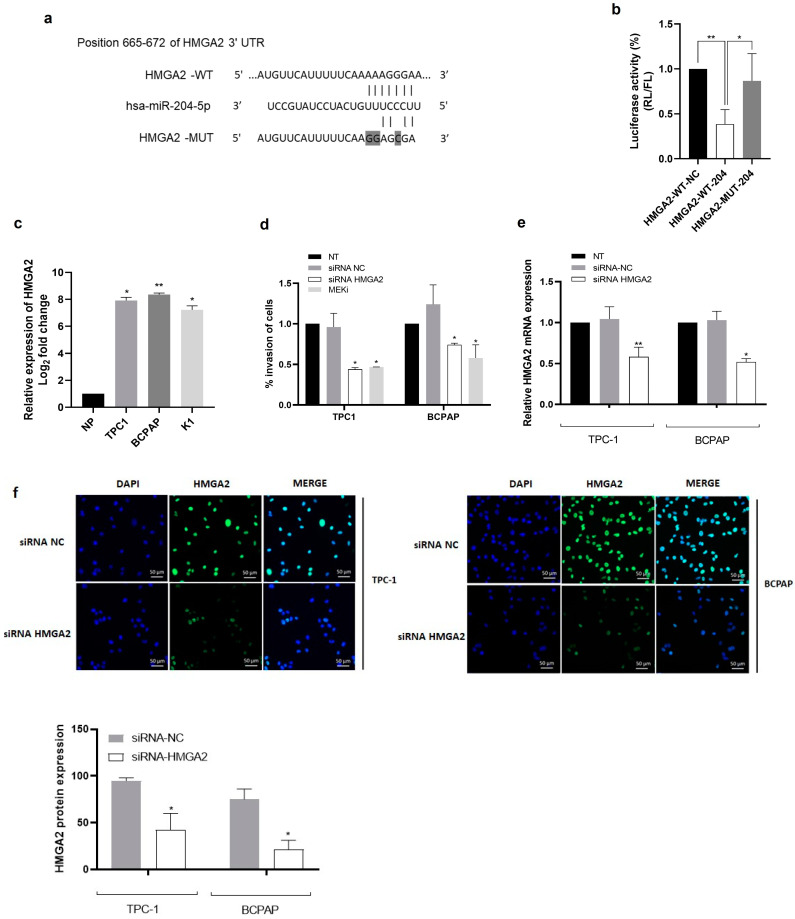
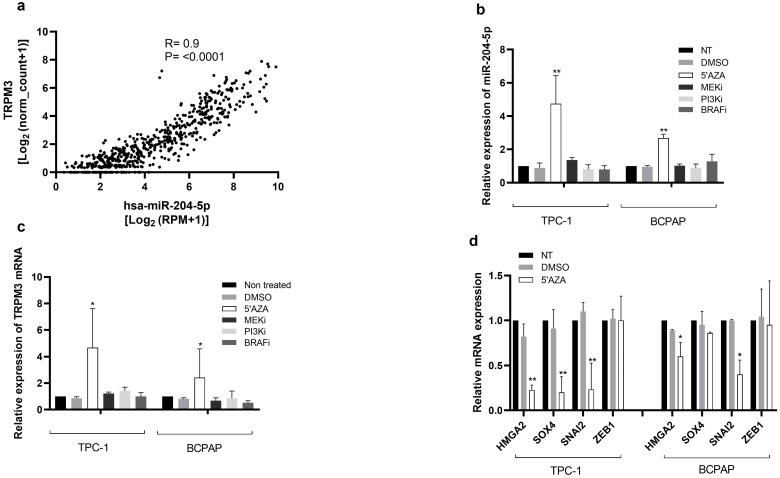
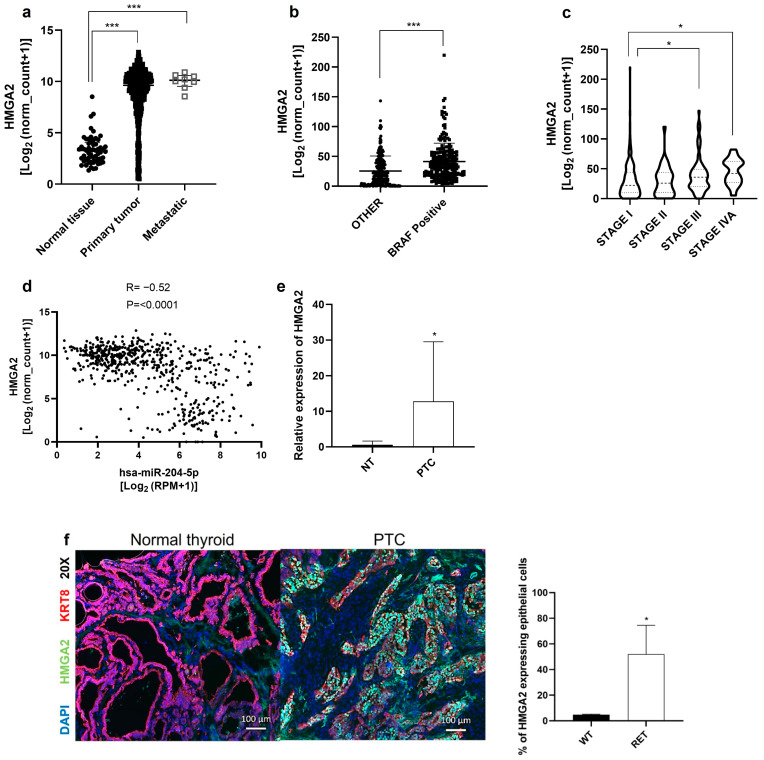
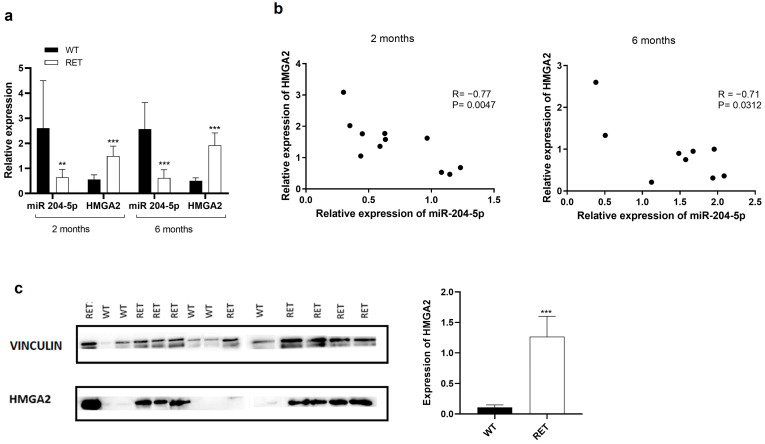
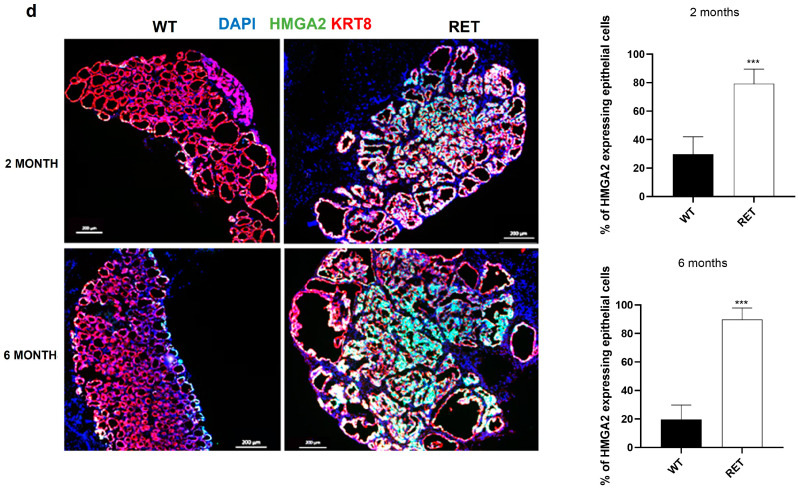
Thyroid cancer is the most common endocrine malignant tumor with an increasing incidence rate. Although differentiated types of thyroid cancer generally present good clinical outcomes, some dedifferentiate into aggressive and lethal forms. However, the molecular mechanisms governing aggressiveness and dedifferentiation are still poorly understood. Aberrant expression of miRNAs is often correlated to tumor development, and miR-204-5p has previously been identified in papillary thyroid carcinoma as downregulated and associated with aggressiveness. This study aimed to explore its role in thyroid tumorigenesis. To address this, gain-of-function experiments were performed by transiently transfecting miR-204-5p in thyroid cancer cell lines. Then, the clinical relevance of our data was evaluated in vivo. We prove that this miRNA inhibits cell invasion by regulating several targets associated with an epithelial-mesenchymal transition, such as SNAI2, TGFBR2, SOX4 and HMGA2. HMGA2 expression is regulated by the MAPK pathway but not by the PI3K, IGF1R or TGFβ pathways, and the inhibition of cell invasion by miR-204-5p involves direct binding and repression of HMGA2. Finally, we confirmed in vivo the relationship between miR-204-5p and HMGA2 in human PTC and a corresponding mouse model. Our data suggest that HMGA2 inhibition offers promising perspectives for thyroid cancer treatment.

Keywords: EMT; HMGA2; MAPK; miR-204-5p; microRNAs; papillary thyroid carcinoma; thyroid cancer.


Conflict of interest statement

The authors declare no conflict of interest.

Figures

Figure 1
Figure 1
miR-204-5p is downregulated in human thyroid cancer and thyroid cancer-derived cell lines. (ac) Analysis of miR-204-5p expression levels using thyroid miR-seq data from The Cancer Genome Atlas (TCGA), (a) in normal samples (n = 59), thyroid cancer tissues (n = 502) and metastatic samples (n = 8). *** p < 0.001 vs. normal; (b) in PTC tumors harboring the BRAFV600E mutation (BRAF Positive, n = 212) and those carrying other types of mutations (other, n = 248), *** p < 0.001; (c) in PTC tumors according to tumor stage, * p < 0.05. (d) Analysis of miR-204-5p expression levels by RT-qPCR in PTC and adjacent normal thyroid tissues (NT) (n = 7). * p < 0.05. (e) and in PTC-derived thyroid cancer cell lines including TPC-1, K1 and BCPAP (n = 3 for each cell line) compared to a pool of 8 normal human thyroid tissues (NP). * p < 0.05 and ** p < 0.01 and *** p < 0.001 vs. NP.
Figure 2
Figure 2
miR-204-5p overexpression inhibits invasion in PTC cell lines: (a) Cell migration and invasion were analyzed in TPC-1 (n = 6) and BCPAP (n = 3) cells three days after transfection, in non-transfected cells (NT), in miR-204-5p overexpressing (miR-204-5p) and mimicked negative control (miR-NC) transfected cells by counting five random fields. (a) Representative image after the invasion assay is shown in the right panel). * p < 0.05 vs. miR-NC. (b) EdU incorporation was analyzed in TPC-1 and BCPAP cells by flow cytometry three days after transfection in non-transfected cells (NT), and cells transfected with miR-204-5p mimic (miR-204-5p) or mimic negative control (miR-NC) cells (n = 3). (c) Cell apoptosis was analyzed by western blotting with cleaved CASPASE-3 and cleaved PARP antibodies and quantified by ImageJ in TPC-1 and BCPAP cells three days after transfection, in cells transfected with miR-204-5p mimic (miR-204-5p) or mimic negative control (miR-NC). TPC-1 and BCPAP cells treated with staurosporine for 20 h were used as a positive control (C+). Cleaved CASPASE-3 expression was normalized with β-ACTIN expression; for PARP, the proportion of cleaved PARP relative to total PARP (cleaved and non-cleaved) was determined.
Figure 3
Figure 3
Gene expression analysis reveals a lot of EMT genes whose expression is dysregulated following miR-204-5p expression. (a) Heatmap of the microarray results showing the genes differentially expressed between TPC-1 cells overexpressing miR-204-5p or mimic negative control (miR-NC) and which were validated by luciferase reporter assay as being miR-204-5p targets. Fold change for each gene was defined using gene expression ratios between miR-204-5p and miR-NC transfected cells. The colors of each probe represent the amplitude of the fold changes, as shown in the legend. (b) Venn diagram of predicted and validated targets of miR-204-5p from three online databases. Genes common between the intersection of the three databases and the microarray results and known to be involved in cell adhesion or invasion are shown in red.
Figure 4
Figure 4
miR-204-5p inhibits SOX4, TGFBR2, SNAI2 and HMGA2 expression in TPC-1 and BCPAP cells. (a,b) TPC-1 and BCPAP cells were transfected with miR-204-5p or mimic negative control (miR-NC), and SOX4, TGFBR2, SNAI2 and HMGA2 mRNA and protein expressions were analyzed by RT-qPCR and western blotting, respectively (n ≥ 3). * p < 0.05, ** p < 0.01 and *** p < 0.001 (c) HMGA2 protein expression was also assessed by immunostaining with DAPI (blue) and HMGA2 antibody (green) 3 days after transfection. Nuclei were stained with DAPI (blue) (n = 3). The right panels represent the quantification of protein expression. * p < 0.05.
Figure 5
Figure 5
HMGA2 expression is regulated by the MAPK signalling pathway (a) Western blot analysis of total AKT and ERK and of the phosphorylated forms 24 h after treatment with trametinib (MEKi), GDC0941 (PI3Ki) and dabrafenib (BRAFi) in TPC-1 and BCPAP cells. Right panel: Quantification of the phosphorylated forms according to the different treatments. * p < 0.05 ** p < 0.01 and *** p < 0.001 vs. DMSO. (b) HMGA2 mRNA expression was analyzed by RT-qPCR in TPC-1 and BCPAP cells treated with different inhibitors during 24 h: trametinib (MEKi), GDC0941 (PI3Ki), dabrafenib (BRAFi), trametinib and dabrafenib (MEKi + BRAFi), BMS-754807 (IGF1Ri) (NT: non treated cells). DMSO treatment was used as a negative control. * p < 0.05; ** p < 0.01 and *** p < 0.001 vs. DMSO.
Figure 6
Figure 6
HMGA2 silencing and MAPK signalling inhibition decrease the invasion capabilities of TPC-1 and BCPAP cells. (a) The predicted binding site of miR-204-5p to HMGA2 3′UTR (HMGA2-WT) and corresponding mutated sequence (HMGA2-MUT). Grey content corresponds to mutated nucleotides. (b) Relative percentage of luciferase activity following co-transfection of TPC-1 cells with HMGA2-WT or HMGA2-MUT vector and miR-204 mimic (HMGA2-WT-204) or mimic negative control (HMGA2-WT-NC). (c) HMGA2 mRNA expression levels were evaluated by RT-qPCR in a pool of 8 normal human thyroid tissues (NP) and three thyroid cancer cell lines: TPC-1, BCPAP and K1 (n = 3). * p < 0.05 and ** p < 0.01 vs. NP. (d) Migration and invasion analysis in TPC-1 and BCPAP cells three days after transfection with a siRNA against HMGA2 (siRNA HMGA2) and a control siRNA (siRNA NC), and in non-transfected TPC-1 and BCPAP cells treated with trametinib (MEKi) for 24 h. The percentage of invasion was defined by the mean of invasion cell count divided by the mean of migration cell count x 100 (n = 3). * p < 0.05. (e,f) HMGA2 mRNA and protein expression analysis by RT-qPCR and immunocytofluorescence, respectively, in TPC-1 (n = 4) and BCPAP (n = 3) cells, three days after transfection with HMGA2 antibody (green) (NT = non-transfected cells). * p < 0.05 and ** p < 0.01 vs. siRNA NC.
Figure 7
Figure 7
Inhibiting DNA methylation increases miR-204-5p and TRPM3 mRNA expression. (a) Correlation analysis between TRPM3 mRNA and miR-204-5p expression levels in the thyroid cancer samples from The Cancer Genome Atlas (TCGA). R = Pearson correlation. (b,c) Expression levels of miR-204-5p (b) and TRPM3 (c) were analyzed in TPC-1 and BCPAP cells by RT-qPCR after treatment with DMSO, 5′-aza-2-deoxycytidine (5′AZA), trametinib (MEKi), GDC0941 (PI3Ki) or dabrafenib (BRAFi) for 24 h and compared to non-treated cells (NT) (n = 5). * p < 0.05 and ** p < 0.01 vs. DMSO. (d) RT-qPCR analysis of mRNA expression of miR-204-5p targets (HMGA2, SOX4, SNAI2) in non-treated (NT) TPC-1 (n = 5) and BCPAP cells (n = 3) and after treatment with 5′-aza-2-deoxycytidine (5′AZA) or DMSO for 24 h. ZEB1 mRNA expression was not a miR-204-5p target and was used as a negative control. * p < 0.05 and ** p < 0.01 vs. DMSO.
Figure 8
Figure 8
HMGA2 is overexpressed in human papillary thyroid cancer. (ad): Analysis of HMGA2 mRNA expression using thyroid RNAseq data from The Cancer Genome Atlas (TCGA) (a) in normal tissues (n = 57), primary tumors (n = 502) and metastatic samples (n = 8), *** p < 0.001 vs. normal tissue; (b) in primary tumors harboring the BRAFV600E mutation (BRAF Positive, n = 216) and those with other mutations (other, n = 211), *** p < 0.001 and (c) according to tumor stage. * p < 0.05. (d) Correlation analysis between HMGA2 mRNA and miR-204-5p expression in the thyroid cancer samples from The Cancer Genome Atlas (TCGA). R = Pearson correlation. (e) HMGA2 mRNA expression analyzed by RT-qPCR in 7 independent PTCs and normal adjacent tissues (NT). * p < 0.05 vs. NT. (f) Immunostaining of HMGA2 (green) in PTC and normal thyroid (n = 3). Epithelial cells were stained with cytokeratin 8 antibody (KRT8, red) and nuclei with DAPI (blue). The % of HMGA2 expressing epithelial cells was evaluated by the ratio: several cells positive for both HMGA2 and KRT8/number of KRT8 positive cells ×100.
Figure 9
Figure 9
miR-204-5p is downregulated while HMGA2 is overexpressed in the thyroid of RET/PTC3 mice. (a) RT-qPCR analysis of miR-204-5p and HMGA2 mRNA expression in 2- and 6-month-old RET/PTC3 (RET) mice thyroids (n = 11 for two months and n = 9 for six months) and a pool of 3 normal thyroids (WT) (n = 6). ** p < 0.01 and *** p < 0.001 vs. WT. (b) Correlation analysis between HMGA2 mRNA and miR-204-5p expression in 2- and 6-months old RET/PTC3 thyroids. R = Pearson correlation. (c) Western blot analysis and quantification of HMGA2 protein expression in 2-month-old wild type (WT) and RET/PTC3 (RET) thyroids (n = 5 for WT and n = 9 for RET). *** p < 0.001 vs. wild-type thyroids. (d) Analysis of HMGA2 expression by immunostaining with HMGA2 antibody (green) and cytokeratin eight antibody (KRT8, red) and DAPI (blue, nuclei staining) in 2- and 6-month-old thyroids (n = 7). The % of HMGA2 expressing cells among the epithelial cells was defined by the ratio: several cells positive for both HMGA2 and KRT8/number of KRT8 positive cells ×100.
Figure 9
Figure 9
miR-204-5p is downregulated while HMGA2 is overexpressed in the thyroid of RET/PTC3 mice. (a) RT-qPCR analysis of miR-204-5p and HMGA2 mRNA expression in 2- and 6-month-old RET/PTC3 (RET) mice thyroids (n = 11 for two months and n = 9 for six months) and a pool of 3 normal thyroids (WT) (n = 6). ** p < 0.01 and *** p < 0.001 vs. WT. (b) Correlation analysis between HMGA2 mRNA and miR-204-5p expression in 2- and 6-months old RET/PTC3 thyroids. R = Pearson correlation. (c) Western blot analysis and quantification of HMGA2 protein expression in 2-month-old wild type (WT) and RET/PTC3 (RET) thyroids (n = 5 for WT and n = 9 for RET). *** p < 0.001 vs. wild-type thyroids. (d) Analysis of HMGA2 expression by immunostaining with HMGA2 antibody (green) and cytokeratin eight antibody (KRT8, red) and DAPI (blue, nuclei staining) in 2- and 6-month-old thyroids (n = 7). The % of HMGA2 expressing cells among the epithelial cells was defined by the ratio: several cells positive for both HMGA2 and KRT8/number of KRT8 positive cells ×100.

Similar articles

Cited by

References

    1. Kruger E., Toraih E.A., Hussein M.H., Shehata S.A., Waheed A., Fawzy M.S., Kandil E. Thyroid Carcinoma: A Review for 25 Years of Environmental Risk Factors Studies. Cancers. 2022;14:6172. doi: 10.3390/cancers14246172. - DOI - PMC - PubMed
    1. Zou M., Baitei E.Y., Alzahrani A.S., BinHumaid F.S., Alkhafaji D., Al-Rijjal R.A., Meyer B.F., Shi Y. Concomitant RAS, RET/PTC, or BRAF Mutations in Advanced Stage of Papillary Thyroid Carcinoma. Thyroid. 2014;24:1256–1266. doi: 10.1089/thy.2013.0610. - DOI - PMC - PubMed
    1. Qiu J., Zhang W., Zang C., Liu X., Liu F., Ge R., Sun Y., Xia Q. Identification of key genes and miRNAs markers of papillary thyroid cancer. Biol. Res. 2018;51:45. doi: 10.1186/s40659-018-0188-1. - DOI - PMC - PubMed
    1. Pamedytyte D., Simanaviciene V., Dauksiene D., Leipute E., Zvirbliene A., Sarauskas V., Dauksa A., Verkauskiene R., Zilaitiene B. Association of microRNA Expression and BRAFV600E Mutation with Recurrence of Thyroid Cancer. Biomolecules. 2020;10:625. doi: 10.3390/biom10040625. - DOI - PMC - PubMed
    1. Nikiforov Y.E. Thyroid carcinoma: Molecular pathways and therapeutic targets. Mod. Pathol. 2008;21:S37–S43. doi: 10.1038/modpathol.2008.10. - DOI - PMC - PubMed