. 2023 Jun 28;24(13):10808.
doi: 10.3390/ijms241310808.

Comparison of Monoamine Oxidase-A, Aβ Plaques, Tau, and Translocator Protein Levels in Postmortem Human Alzheimer's Disease Brain

Affiliations

Comparison of Monoamine Oxidase-A, Aβ Plaques, Tau, and Translocator Protein Levels in Postmortem Human Alzheimer's Disease Brain

Amina U Syed et al. Int J Mol Sci. .

Abstract

Increased monoamine oxidase-A (MAO-A) activity in Alzheimer's disease (AD) may be detrimental to the point of neurodegeneration. To assess MAO-A activity in AD, we compared four biomarkers, Aβ plaques, tau, translocator protein (TSPO), and MAO-A in postmortem AD. Radiotracers were [18F]FAZIN3 for MAO-A, [18F]flotaza and [125I]IBETA for Aβ plaques, [124/125I]IPPI for tau, and [18F]FEPPA for TSPO imaging. Brain sections of the anterior cingulate (AC; gray matter GM) and corpus callosum (CC; white matter WM) from cognitively normal control (CN, n = 6) and AD (n = 6) subjects were imaged using autoradiography and immunostaining. Using competition with clorgyline and (R)-deprenyl, the binding of [18F]FAZIN3 was confirmed to be selective to MAO-A levels in the AD brain sections. Increases in MAO-A, Aβ plaque, tau, and TSPO activity were found in the AD brains compared to the control brains. The [18F]FAZIN3 ratio in AD GM versus CN GM was 2.80, suggesting a 180% increase in MAO-A activity. Using GM-to-WM ratios of AD versus CN, a >50% increase in MAO-A activity was observed (AD/CN = 1.58). Linear positive correlations of [18F]FAZIN3 with [18F]flotaza, [125I]IBETA, and [125I]IPPI were measured and suggested an increase in MAO-A activity with increases in Aβ plaques and tau activity. Our results support the finding that MAO-A activity is elevated in the anterior cingulate cortex in AD and thus may provide a new biomarker for AD in this brain region.

Keywords: Alzheimer’s disease; Aβ plaques; [125I]IPPI; [18F]FEPPA; [18F]flotaza; [18]FAZIN3; human tau; monoamine oxidase-A.


Conflict of interest statement

The authors declare no conflict of interest. The funders had no role in the design of the study; in the collection, analyses, or interpretation of data; in the writing of the manuscript; or in the decision to publish the results.

Figures

Figure 1
Figure 1
Aβ, tau, MAO-A, and TSPO in AD Subjects: Schematic showing four biomarkers for AD. (A). Aβ-plaque (senile plaques, SP) PET imaging agents are currently used in AD subjects. [18F]flotaza and [125I]IBETA, both Aβ plaque imaging agents, were used in this work. (B). Tau (neurofibrillary tangles, NFT) PET imaging agents are currently used for in AD subjects. In this work, [124/125I]IPPI imaging agents were used to evaluate Tau. (C). Translocator protein (TSPO), a biomarker for neuroinflammation, is being studied in AD using radiotracers such as [18F]FEPPA. (D). Monoamine oxidase-A (MAO-A) in AD using [18F]FAZIN3 as a potential new biomarker for neuroinflammation was investigated in this work.
Figure 2
Figure 2
MAO-A Imaging of [18F]FAZIN3: (A,C). Anti-Aβ immunostained brain slices (10 μm) of two AD subjects (AD 12-27 and AD 11-78) showing abundant Aβ plaques (arrows) in the GM regions of the anterior cingulate (inset shows GM with Aβ plaques). (B,D). Binding of [18F]FAZIN3 in AD 12-27 and AD 11-78 brain slice GM is significantly greater compared to the lower levels in corpus callosum, WM. (E,G). Brain slices (10 μm) of CN subjects (CN 12-21 and CN 10-39) show GM regions of anterior cingulate, (F,H). Binding of [18F]FAZIN3 in the CN brain GM and lower levels WM. (I). Plot of GM and WM of all AD and CN subjects. [18F]FAZIN3 binding is seen in all CN and AD subjects, with GM showing higher levels compared to WM. AD brains show greater [18F]FAZIN3 in GM regions compared to control subjects. (J). Plot shows averages of all AD and CN subjects (“**** = p < 0.0001” for AD GM versus CN GM, unpaired two-tailed t-test and p < 0.05 for AD WM versus CN WM; open circles males, solid circles females). Ratio of AD GM/WM = 3.43 whereas CN GM/WM = 2.17. Autoradiography scale bar: 0–500 digital light units (DLU)/mm2.
Figure 3
Figure 3
MAO drug effects on [18F]FAZIN3: (A,B). Anti-Aβ AD 11-27 and AD 13-10, 10 μm brain slice showing abundant Aβ plaques in anterior cingulate (GM). (C,D). MAO-A in GM labeled by [18F]FAZIN3 in brain sections of AD 11-27 and AD 13-10 (arrows indicate Aβ plaques in (A,B); inset shows scan of the same brain slices). (E,F). MAO-A drug clorgyline, 1 μM, displaced >90% [18F]FAZIN3 in adjacent sections of AD 11-27 and AD 13-10. (G,H). MAO-B drug (R)-deprenyl, 1 μM, had little effect on [18F]FAZIN3 binding in of AD 11-27 and AD 13-10. (I). Plot of [18F]FAZIN3 total binding, in the presence of (R)-deprenyl and clorgyline in AD subjects showing no effect of (R)-deprenyl while clorgyline displaced >90% of [18F]FAZIN3 (“*** = p < 0.001” for total versus clorgyline; total versus (R)deprenyl was not significant. Autoradiography scale bar: 0 to 700 DLU/mm2.
Figure 4
Figure 4
Aβ Plaque Imaging with [18F]Flotaza, [125I]IBETA, and MAO-A Imaging with [18F]FAZIN3: (A). AD brain slice of subject AD 11-38 showing anti-Aβ immunostained gray matter (GM) in the anterior cingulate and a lack of Aβ plaques in white matter (WM) in the corpus callosum (inset shows Aβ plaques at arrow at 50 µm); (B). [18F]Flotaza binding to Aβ plaques in the gray matter regions in adjacent slices of subject AD 11-38 (inset shows scan of the brain slice). (C). [125I]IBETA binding to Aβ plaques in the gray matter regions in adjacent slices of subject AD 11-38 (inset shows scan of the brain slice). (D). High levels of [18F]FAZIN3 binding in gray matter in adjacent slice of AD 11-38 subject showing binding to MAO-A in the GM regions (inset shows scan of the brain slice). (E). [125I]IBETA binding to Aβ plaques in the gray matter regions in CN subject CN 12-21 (inset shows scan of the brain slice). (F). Linear correlation plot of [18F]flotaza and [125I]IBETA with [18F]FAZIN3 binding in all 6 AD subjects including the one CN 12-21 subject (dotted circle) shows positive relationship (r2 =0.65, p = 0.01 with [18F]flotaza and r2 =0.73, p = 0.009 with [125I]IBETA). Autoradiography scale bar: 0 to 500 digital light units (DLU)/mm2 for (B,C) and (E) and 0 to 200 digital light units (DLU)/mm2 for (D).
Figure 5
Figure 5
Tau Imaging with [125I]IPPI, TSPO Imaging with 18F]FEPPA, and MAO-A Imaging with [18F]FAZIN3: (A). Anti-tau immunohistochemical staining revealed a presence of NFT in the AD 13-10 subject. Inset at 50 µm magnification shows a presence of NFT in the GM (arrow). (B). [124I]IPPI binding to tau was observed in the gray matter of the adjacent slice of the AD 13-10 subject. Little nonspecific [124I]IPPI binding was seen in WM (inset shows scan of the brain slice). (C). Binding of [18F]FAZIN3 in gray matter in the adjacent slice of the AD 13-10 subject shows extensive binding to MAO-A in the GM regions (inset shows scan of the brain slice). (D). Linear regression plot of [125I]IPPI and [18F]FAZIN3 binding in all 6 AD subjects shows a modest positive correlation (r2 = 0.57) but not significant (p > 0.05). (E). Brain slices of AD subject 13-10 shows high binding of [18F]FEPPA to TSPO in the gray matter regions of the anterior cingulate (inset shows scan of the brain slice). (F). Lower levels of [18F]FEPPA binding are observed in the gray matter of the CN 10-40 subject (inset shows scan of the brain slice). (G). Average of [18F]FEPPA binding in the GM regions of 6 AD subjects was greater than that of the 6 CN subjects (** p < 0.01; open circles males, solid circles females). Ratio of AD GM-to-CN GM = 1.65, suggesting increased TSPO expression in the AD brains. (H). Linear plot of [18F]FEPPA and [18F]FAZIN3 binding in all 6 AD subjects exhibited significant positive correlation (p < 0.01). Autoradiography scale bar: 0 to 3000 digital light units (DLU)/mm2 for (B,E) and (F) and 0 to 500 digital light units (DLU)/mm2 for (C).
Figure 6
Figure 6
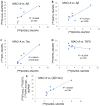
Correlation Plots of GM/WM Ratios of [18F]FAZIN3 with other Biomarkers: (A). GM/WM ratio of [18F]FAZIN3 binding to MAO-A in all the six AD subjects and one CN subject (with positive Aβ) showed a weak positive correlation (r2 = 0.56; p = 0.018) with the [18F]flotaza GM/WM binding ratio to Aβ plaques. (B). A better positive correlation (r2 = 0.70; p = 0.005) of the [18F]FAZIN3 GM/WM ratio was observed with the [125I]IBETA GM/WM binding ratio to Aβ plaques. (C). A good correlation (r2 = 0.84; p > 0.05, NS) of the [18F]FAZIN3 GM/WM ratio was observed with the [125I]IPPI GM/WM binding ratio to tau. (D). Binding of the [18F]FAZIN3 GM/WM ratio did not show a positive correlation with the [18F]FEPPA GM/WM binding ratio to TSPO. The trend appeared to be a negative correlation (r2 = 0.30; p = 0.05). (E). A plot of [18F]flotaza, [125I]IBETA, and [125I]IPPI averages versus the [18F]FAZIN3 GM/WM ratio provides a good linear regression with high significance (r2 = 0.83; p = 0.02).
Figure 7
Figure 7
Radiotracer Binding to Different Braak Stages: Ratios of GM/WM of [18F]FAZIN (for MAO-A), [18F]flotaza (for Aβ plaques), [125I]IBETA (for Aβ plaques), [18F]FEPPA (for TSPO), and [125I]IPPI (for tau) in CN and AD subjects at Braak I, Braak II, Braak V, and Braak VI are shown.

Similar articles

Cited by

References

    1. Braak H., Thal D.R., Ghebremedhin E., Tredici K.D. Stages of the pathologic process in Alzheimer’s disease age categories from 1 to 100 years. J. Neuropathol. Exp. Neurol. 2011;70:960–969. doi: 10.1097/NEN.0b013e318232a379. - DOI - PubMed
    1. Patterson C. World Alzheimer Report 2018: The State of the Art of Dementia Research: New Frontiers. Alzheimer’s Disease International (ADI); London, UK: 2018.
    1. Mendez P.C., Surace E., Bérgamo Y., Calandri I., Vázquez S., Sevlever G., Allegri R.F. Biomarkers for Alzheimers disease. Where we stand and where we are headed. Medicina. 2019;79:546–551. - PubMed
    1. Cummings J., Aisen P., Lemere C., Atri A., Sabbagh M., Salloway S. Aducanumab produced a clinically meaningful benefit in association with amyloid lowering. Alzheimer’s Res. Ther. 2021;13:98. doi: 10.1186/s13195-021-00838-z. - DOI - PMC - PubMed
    1. Thijssen E.H., La Joie R., Wolf A., Strom A., Wang P., Iaccarino L., Bourakova V., Cobigo Y., Heuer H., Spina S., et al. Diagnostic value of plasma phosphorylated tau181 in Alzheimer’s disease and frontotemporal lobar degeneration. Nat. Med. 2020;26:387–397. doi: 10.1038/s41591-020-0762-2. - DOI - PMC - PubMed

MeSH terms