. 2023 Jun 29;24(13):10869.
doi: 10.3390/ijms241310869.

The Slow Progression of Diabetic Retinopathy Is Associated with Transient Protection of Retinal Vessels from Death

Affiliations

The Slow Progression of Diabetic Retinopathy Is Associated with Transient Protection of Retinal Vessels from Death

Yanliang Li et al. Int J Mol Sci. .

Abstract

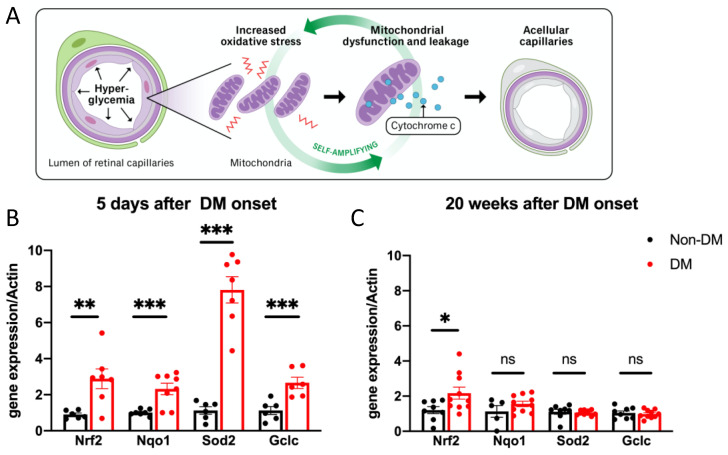
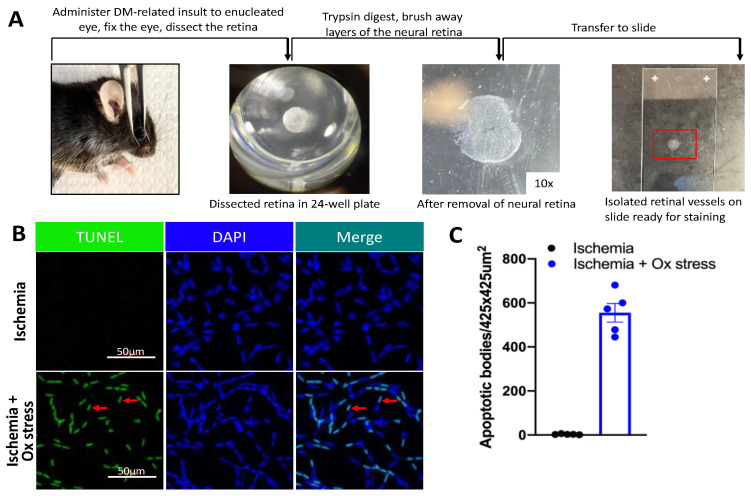
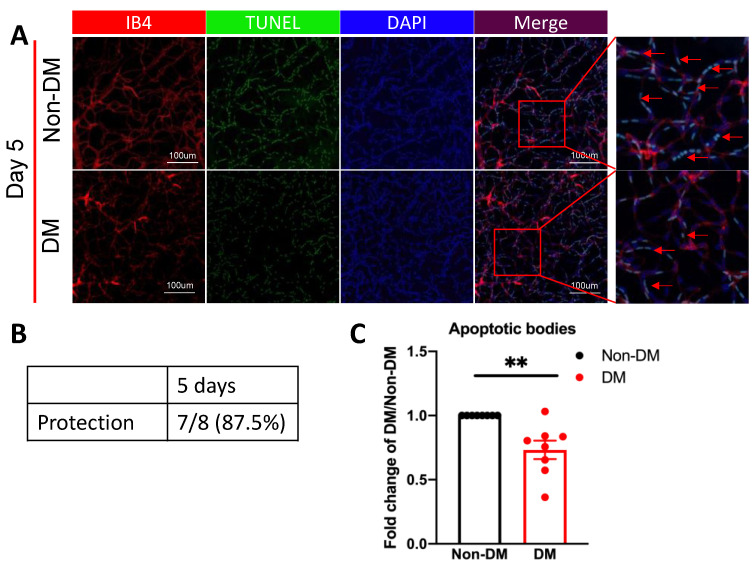
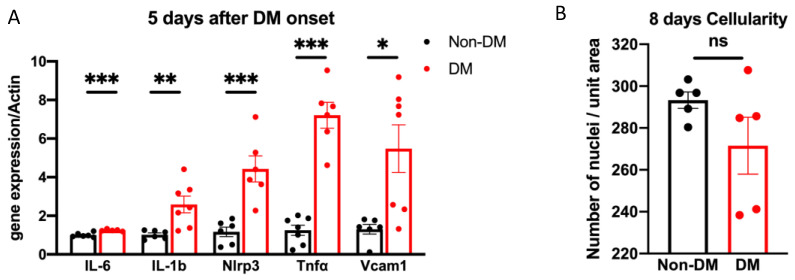
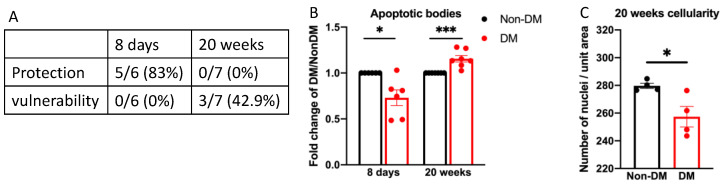
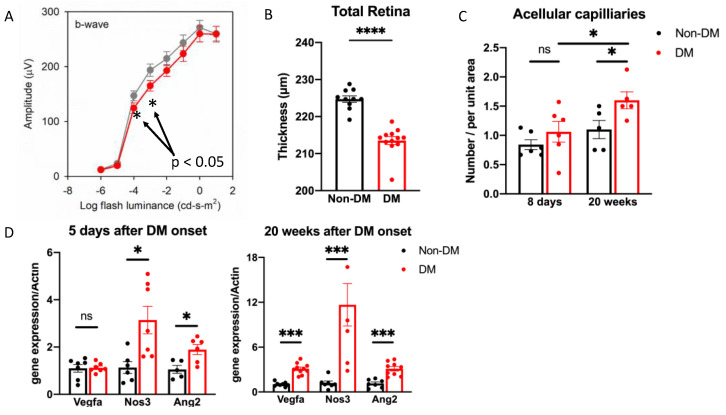
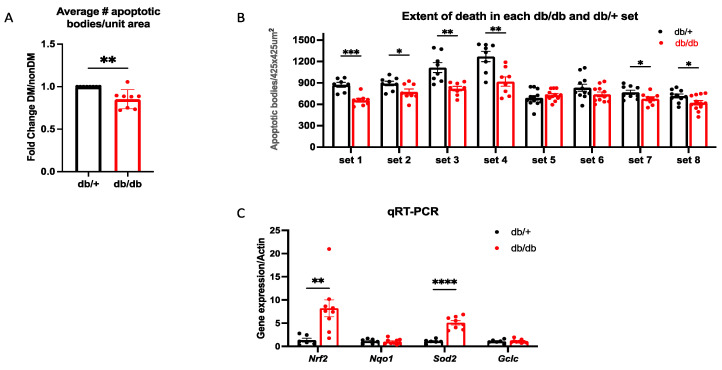
The purpose of this study was to investigate the reason that diabetic retinopathy (DR) is delayed from the onset of diabetes (DM) in diabetic mice. To this end, we tested the hypothesis that the deleterious effects of DM are initially tolerated because endogenous antioxidative defense is elevated and thereby confers resistance to oxidative stress-induced death. We found that this was indeed the case in both type 1 DM (T1D) and type 2 DM (T2D) mouse models. The retinal expression of antioxidant defense genes was increased soon after the onset of DM. In addition, ischemia/oxidative stress caused less death in the retinal vasculature of DM versus non-DM mice. Further investigation with T1D mice revealed that protection was transient; it waned as the duration of DM was prolonged. Finally, a loss of protection was associated with the manifestation of both neural and vascular abnormalities that are diagnostic of DR in mice. These observations demonstrate that DM can transiently activate protection from oxidative stress, which is a plausible explanation for the delay in the development of DR from the onset of DM.

Keywords: diabetic retinopathy; oxidative stress; protection from diabetic retinopathy; retinal capillaries.


Conflict of interest statement

The authors declare no conflict of interest.

Figures

Figure 1
Figure 1
DM induced the transient expression of antioxidant genes within the retina. (A) Diagram of the current dogma for how hyperglycemia increases oxidative stress and thereby causes the death of cells within retinal capillaries. We postulate that DR is delayed from the onset of DM because of an endogenous system that suppresses HG-driven oxidative stress and thereby protects from the deleterious effects of DM. (B) Total retinal tissue was isolated from mice that had been DM for 5 days or age-matched non-DM mice and was subjected to qRT-PCR analysis. Bar graphs represent a change in the message levels of the indicated genes (red bar; the data from each eye from 6–10 mice) and non-DM retinas (black bar; the data from each eye from 6–10 mice), normalized to β-actin. The data are expressed as the fold increase over non-DM mice and represent the mean ± SEM. ** p < 0.01; *** p < 0.005. (C) Same as (B) except that the mice experienced a duration of DM that suffices for the development of DR (20 weeks) [31]. * p < 0.05, “ns” the differences is not statistically different.
Figure 2
Figure 2
An approach to detect ischemia/oxidative stress-induced death within isolated retinal vessels. (A) Key steps of the assay for detecting death within retinal vessels. (B) Representative images of ischemia ± ox stress-induced apoptotic bodies in isolated retinal vessels. The red arrows point to representative TUNEL/DAPI double-positive species. (C) Quantification of results in (B). Five randomly selected regions (425 μm × 425 μm) in the peripheral zone around the optic nerve within a retina were selected and photographed. The number of apoptotic bodies in each region was counted with Image J and is represented by a dot in the bar graph. An apoptotic body is defined as a TUNEL/DAPI double-positive species. The data in panel (C) are from a single mouse. The same results were observed on at least five independent occasions with five additional mice.
Figure 3
Figure 3
The vasculature of diabetic mice was protected from ox stress-induced death. (A) Representative images of ox stress-induced apoptotic bodies in the isolated retinal vasculature 5 days after the onset of DM. The red arrows point to representative IB4/TUNEL/DAPI-positive species. (B) Sets (a pair of eyes from randomly selected non-DM and DM mice) were processed in parallel. Protection: a statistically significant smaller number of apoptotic bodies/unit area in the vasculature of DM versus non-DM eyes within a given set. (C) Within each set of eyes, the average number of apoptotic bodies within six to eight visual fields in one DM eye was divided by that of a non-DM eye to determine the fold change. (n = eight sets.) The fold change of the DM group and age-matched non-DM group is presented. Data shown are the mean ± SEM. ** p < 0.01 with student’s t-test.
Figure 4
Figure 4
The expression of inflammation-related genes was elevated by DM. (A) Total retinal tissue was isolated from mice that had experienced 5 days of DM and then subjected to qRT-PCR analysis. Bar graphs represent changes in the message levels of inflammatory-related gene expression for DM (red bar, n = 10) and non-DM retinas (black bar, n = 8), normalized to β-actin. * p < 0.05; ** p < 0.01; *** p < 0.005. (B) Retinal vessels from mice that had experienced 8 days of DM along with age-matched non-DM control mice were isolated from un-insulted eyes and stained with periodic acid–schiff hematoxylin (PASH). For each eye, 8–10 arbitrarily selected regions (360 μm × 360 μm) within the peri-optic nerve zone were selected and photographed. The number of nuclei was counted with Image J; the average for each eye is shown as a dot in the bar graph. Five non-DM and five DM mice were analyzed. “ns” the differences is not statistically different.
Figure 5
Figure 5
Detection of cytokine-induced death within retinal vessels. (A) Key steps of the assay for observing death of retinal vessels resulting from the intravitreal injection of a cytokine cocktail. (B) Dose-response to cytokines-induced death. 1× cytokines cocktail consisted of a 1:1:1 ratio of 100 ug/mL TNF-α, 100 ug/mL IL-1β and 1500 U/uL IFN-γ. Each mouse was injected intravitreally with PBS in the left eye and cytokines in the right eye. The number of apoptotic bodies (TUNEL/DAPI double-positive species) in the entire retinal vasculature was counted manually. (C) Duration-response to cytokines-induced death. Each mouse was injected intravitreally with PBS in the left eye and 0.01× cytokines in the right eye for 8 h or 24 h, respectively. The extent of cell death was quantified as described in panel (A); pilot experiments shown in panels (B,C) were conducted on two mice. (D) Representative images of a subset of the total retinal vasculature from a single mouse are shown. The red arrows point to representative TUNEL-positive species.
Figure 6
Figure 6
The vasculature of diabetic mice was protected from cytokine-induced death. (A) A total of 5 days after the DM onset, both groups (DM, n = 8; Non-DM, n = 7) were injected intravitreally with PBS in the left eye and 0.01× cytokines in the right eye. After 24 h, the eyes were harvested and analyzed as described in Figure 5. The extent of death was not different in PBS-injected eyes. Each point is the average number of TUNEL+ cells in a single eye. *** p < 0.005. (B) The average cytokine cocktail-induced fold change in the entire group of mice for each experimental condition. The bar graph displays the mean ± SEM. The student’s t-test was used to assess if the differences between groups were statistically significant; ** p < 0.01. (C) The raw data for each non-DM mouse. (D) The raw data for each DM mouse.
Figure 7
Figure 7
Prolonging the duration of DM was associated with a loss of protection and the appearance of vulnerability. (A) Mice that experienced the indicated duration of DM, along with age-mated non-DM control mice, were subjected to the assay described in Figure 2. Six and seven sets of eyes were used for the 8 day and 20 week cohorts, respecitively, where a set consists of two eyes, one from a DM mouse and one from a non-DM mouse. Protection: a statistically significantly smaller number of apoptotic bodies/unit area in the vasculature of DM versus non-DM within a given set. Vulnerability: a statistically significantly larger number of apoptotic bodies/unit area in the vasculature of DM versus non-DM within a given set. (B) The fold change in the number of apoptotic bodies (TUNEL/DAPI double-positive species) for the mice described in panel (A). The 20-week data were corrected for the cellularity by dividing the number of apoptotic bodies by the average decline in cellularity shown in panel (C). The 8-day data were not corrected because the cellularity of the vasculature was unchanged after 8 days of DM (Figure 4B). * p < 0.05; *** p < 0.005. (C) Retinal vessels from the un-insulted eyes were obtained from mice that had experienced 20 weeks of DM along with non-DM controls (n = 4) and processed as described in the legend of Figure 4.
Figure 8
Figure 8
Retinopathy was associated with a loss of protection and increased vulnerability. (A) The b-wave of ERG from mice that experienced DM for 16 weeks (red circle, n = 12) compared with that of age-matched non-DM mice (grey circle, n = 10). (B) The quantification of total retina thicknesses in DM (n = 12) and non-DM (n = 10) mice. In these experiments, mice were DM for 16 weeks. **** p < 0.0001. (C) The number of acellular capillaries was counted manually in retinal vessels from animals that had experienced DM for the indicated duration; “non-DM” indicates age-matched control animals. * p < 0.05. (D) qRT-PCR was performed as described in the legend of Figure 1 to assess the expression of vascular leakage-related genes in the whole retina from mice that experienced the indicated duration of DM (5 days; n = 6–8) and age-matched non-DM mice (n = 8). Note that the y axis scale bar differs in the two graphs. * p < 0.05; *** p < 0.005, “ns” the differences is not statistically different.
Figure 9
Figure 9
Key discoveries in the T1D model were also observed in T2D mice. db/db mice that experienced DM for at least 6 days and age-matched db/+ mice (that were non-DM) (n = 8) were subjected to the protection assay described in Figure 2. (A) The average fold change between all eight sets of db/+ and db/db eyes. ** p < 0.01. (B) The data for each of the eight sets. * p < 0.05; ** p < 0.01; *** p < 0.001. (C) The expression of the indicated genes was assessed as described in the legend of Figure 1; n= 8–10. The bar graphs display the mean ± SEM; t-test for statistical significance. ** p < 0.01; **** p < 0.0001.

Similar articles

Cited by

References

    1. Teo Z.L., Tham Y.-C., Yu M., Chee M.L., Rim T.H., Cheung N., Bikbov M.M., Wang Y.X., Tang Y., Lu Y., et al. Global Prevalence of Diabetic Retinopathy and Projection of Burden through 2045: Systematic Review and Meta-analysis. Ophthalmology. 2021;128:1580–1591. doi: 10.1016/j.ophtha.2021.04.027. - DOI - PubMed
    1. Wong T., Cheung C., Larsen M., Sharma S., Simó R. Diabetic retinopathy. Nat. Rev. Dis. Prim. 2016;2:16012. doi: 10.1038/nrdp.2016.12. - DOI - PubMed
    1. Stitt A.W., Curtis T.M., Chen M., Medina R.J., McKay G.J., Jenkins A., Gardiner T.A., Lyons T.J., Hammes H.P., Simo R., et al. The progress in understanding and treatment of diabetic retinopathy. Prog. Retin. Eye Res. 2016;51:156–186. doi: 10.1016/j.preteyeres.2015.08.001. - DOI - PubMed
    1. Duh E.J., Sun J.K., Stitt A.W. Diabetic retinopathy: Current understanding, mechanisms, and treatment strategies. JCI Insight. 2017;2:e93751. doi: 10.1172/jci.insight.93751. - DOI - PMC - PubMed
    1. Stewart M.W., Grippon S., Kirkpatrick P. Aflibercept. Nat. Rev. Drug Discov. 2012;11:269–270. doi: 10.1038/nrd3700. - DOI - PubMed

MeSH terms