. 2023 Jun 29;24(13):10870.
doi: 10.3390/ijms241310870.

GSK-3 Inhibitor Elraglusib Enhances Tumor-Infiltrating Immune Cell Activation in Tumor Biopsies and Synergizes with Anti-PD-L1 in a Murine Model of Colorectal Cancer

Affiliations

GSK-3 Inhibitor Elraglusib Enhances Tumor-Infiltrating Immune Cell Activation in Tumor Biopsies and Synergizes with Anti-PD-L1 in a Murine Model of Colorectal Cancer

Kelsey E Huntington et al. Int J Mol Sci. .

Abstract

Glycogen synthase kinase-3 (GSK-3) is a serine/threonine kinase that has been implicated in numerous oncogenic processes. GSK-3 inhibitor elraglusib (9-ING-41) has shown promising preclinical and clinical antitumor activity across multiple tumor types. Despite promising early-phase clinical trial results, there have been limited efforts to characterize the potential immunomodulatory properties of elraglusib. We report that elraglusib promotes immune cell-mediated tumor cell killing of microsatellite stable colorectal cancer (CRC) cells. Mechanistically, elraglusib sensitized CRC cells to immune-mediated cytotoxicity and enhanced immune cell effector function. Using western blots, we found that elraglusib decreased CRC cell expression of NF-κB p65 and several survival proteins. Using microarrays, we discovered that elraglusib upregulated the expression of proapoptotic and antiproliferative genes and downregulated the expression of cell proliferation, cell cycle progression, metastasis, TGFβ signaling, and anti-apoptotic genes in CRC cells. Elraglusib reduced CRC cell production of immunosuppressive molecules such as VEGF, GDF-15, and sPD-L1. Elraglusib increased immune cell IFN-γ secretion, which upregulated CRC cell gasdermin B expression to potentially enhance pyroptosis. Elraglusib enhanced immune effector function resulting in augmented granzyme B, IFN-γ, TNF-α, and TRAIL production. Using a syngeneic, immunocompetent murine model of microsatellite stable CRC, we evaluated elraglusib as a single agent or combined with immune checkpoint blockade (anti-PD-1/L1) and observed improved survival in the elraglusib and anti-PD-L1 group. Murine responders had increased tumor-infiltrating T cells, augmented granzyme B expression, and fewer regulatory T cells. Murine responders had reduced immunosuppressive (VEGF, VEGFR2) and elevated immunostimulatory (GM-CSF, IL-12p70) cytokine plasma concentrations. To determine the clinical significance, we then utilized elraglusib-treated patient plasma samples and found that reduced VEGF and BAFF and elevated IL-1 beta, CCL22, and CCL4 concentrations correlated with improved survival. Using paired tumor biopsies, we found that tumor-infiltrating immune cells had a reduced expression of inhibitory immune checkpoints (VISTA, PD-1, PD-L2) and an elevated expression of T-cell activation markers (CTLA-4, OX40L) after elraglusib treatment. These results address a significant gap in knowledge concerning the immunomodulatory mechanisms of GSK-3 inhibitor elraglusib, provide a rationale for the clinical evaluation of elraglusib in combination with immune checkpoint blockade, and are expected to have an impact on additional tumor types, besides CRC.

Keywords: 9-ING-41; GSK-3; elraglusib; immune checkpoint blockade; immunotherapy.


Conflict of interest statement

Elraglusib (9-ING-41) has been licensed to Actuate Therapeutics. K.E.H., P.S., and W.S.E-D. receive research funding for preclinical studies from Actuate Therapeutics, Inc (March 2022- Feb. 2024). B.A.C. received institutional funding for a clinical trial related to 9-ING-41 from Actuate Therapeutics, Inc. F.J.G. has served as a consultant to Actuate Therapeutics, Inc. Daniel Newhouse is an employee and shareholder of NanoString Technologies Inc. All remaining authors report no disclosures.

Figures

Figure 1
Figure 1
Elraglusib enhances pyroptosis and sensitizes tumor cells to increase immune-mediated cytotoxicity in a co-culture model. Co-cultures were treated with drug concentrations as indicated. A 1:1 effector to target (E:T) ratio was used with a 24-h co-culture duration. EthD-1 was used to visualize dead cells; 10× magnification; scale bar indicates 100 µm. (A) Representative SW480 and TALL-104 T cell co-culture assay images at the 24-h timepoint; 24 tumor cell pre-treatment with 5 µM elraglusib, followed by 24-h co-culture. (B) Quantification of the co-culture experiment using the percentage of dead cells out of total cells (N = 3). (C) Quantification normalized by cell death observed with drug treatment alone (N = 3). (D) Representative SW480 and donor-derived CD8+ T cell co-culture assay images at the 24-h timepoint; 24-h tumor cell pre-treatment with 5 µM elraglusib, followed by a 24-h co-culture. (E) Quantification of the co-culture experiment using the percentage of dead cells out of total cells (N = 3). (F) Quantification normalized by cell death observed with drug treatment alone (N = 3). (G) The number of HCT 116 GFP+ cells were quantified after 48 h of culture with DMSO, 5 μM elraglusib, and/or 5000 TALL-104 cells (N = 3). (H) The number of HT-29 GFP+ cells was quantified after 48 h of culture with DMSO, 5 μM elraglusib, and/or 5000 TALL-104 cells (N = 3). (I) The number of HCT 116 GFP+ cells was quantified after 48 h of culture with DMSO, 5 μM elraglusib, and/or 5000 NK-92 cells (N = 3). (J) The number of HT-29 GFP+ cells was quantified after 48 h of culture with DMSO, 5 μM elraglusib, and/or 5000 NK-92 cells (N = 3). (K) Representative 40 × images of HCT-116 GFP+ or HT-29 GFP+ CRC and TALL-104 T cell co-cultures. Black arrows indicate pyroptotic events. Representative images of western blot analysis of (L) HCT-116 and (M) HT-29 CRC cells for expression of indicated proteins after treatment with indicated cytokines or drugs. Quantification of IFN-γ secretion (pg/mL) post-DMSO or elraglusib treatment for 24 h in (N) TALL-104 cells and (O) NK-92 cells (N = 3). Error bars represent the mean +/− standard deviation. Statistical test: one-way ANOVA with Tukey’s test for multiple comparisons. p-value legend: * p < 0.05, ** p < 0.01, *** p < 0.001, **** p < 0.0001.
Figure 2
Figure 2
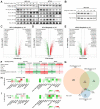
Elraglusib treatment induces PD-L1 expression and suppresses survival pathways in tumor cells. Representative images of western blot analysis of (A) HCT-116 and HT-29 CRC cells for expression of indicated proteins after increasing durations of elraglusib treatment (0–72 h). (B) Representative images of western blot analysis of Mcl-1 expression in HCT-116 CRC cells after increasing durations of elraglusib treatment. CRC cells were treated with 1 μM elraglusib for 24 h and treated versus untreated samples were compared in triplicate. Microarray analysis results were visualized using volcano plots for (C) HCT-116, (D) HT-29, and (E) KM12C CRC cell lines (N = 3). The top down- and up-regulated genes post-elraglusib treatment as compared to controls are shown. Results were calculated using a fold-change cutoff of >1.5, <−1.5, and a p-value of <0.05. (F) The number of genes up- or down-regulated in each of the three cell lines within several signaling pathways of interest (N = 3). Green indicates downregulation and red indicates upregulation of gene expression. (G) A Venn Diagram was used to compare the 3124 genes that were differentially expressed post-treatment with elraglusib in the three colon cancer (HCT-116, HT-29, KM12C) cell lines (N = 3). (H) Tumor cells (HCT-116, HT-29) were treated with 1 μM elraglusib for 48 h and cell culture supernatant was analyzed with the Luminex 200. Fold-change is shown where red indicates a positive fold-change and green indicates a negative fold-change (N = 3). (I) Tumor cells (HCT-116, HT-29) were treated with 5 μM elraglusib for 48 h and cell culture supernatant was analyzed with the Luminex 200. Fold-change is shown where red indicates a positive fold-change and green indicates a negative fold-change (N = 3).
Figure 3
Figure 3
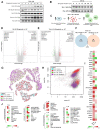
Elraglusib treatment increases effector molecule secretion and induces an energetic shift in cytotoxic immune cells. Representative images of western blot analysis of (A) TALL-104 and (B) HT-29 cytotoxic immune cells for expression of indicated proteins after increasing durations of elraglusib treatment (0–72 h). (C) Proposed model for non-canonical NF-κB pathway activation: increased NIK expression indicates non-canonical NF-κB pathway activation which enhances the expression of chemokines and cytokines (CCL11, TNF-α, GM-CSF) and subsequently leads to increased recruitment and proliferation of cytotoxic immune cells (CD8+ T, CD4+ T, NK cells). Immune cells were treated with 1 μM elraglusib for 24 h and treated versus untreated samples were compared in triplicate. Microarray analysis results were visualized using volcano plots for (D) NK-92 and (E) TALL-104 immune cell lines (N = 3). (F) A Venn diagram was used to compare the 124 genes that were differentially expressed post-treatment with elraglusib in the two immune (TALL-104, NK-92) cell lines (N = 3). (G) 10 × single-cell sequencing analysis of immune cells treated with elraglusib. TALL-104 and NK-92 cells were treated with 1 μM elraglusib for 24 h and aggregate data were visualized using a t-SNE plot. (H) Immune cells show differential expression of mitochondria-encoded genes (MT) and ribosomal genes (RB) after elraglusib treatment. (I) Heatmap comparing gene expression post-elraglusib treatment as compared to control. Fold-change is shown, where red indicates a positive fold-change and green indicates a negative fold-change. (J) Immune cells (TALL-104, NK-92) were treated with 1 μM elraglusib for 48 h and cell culture supernatant was analyzed with the Luminex 200. Fold-change is shown, where red indicates a positive fold-change and green indicates a negative fold-change (N = 3).
Figure 4
Figure 4
Elraglusib enhances immune-cell tumor-infiltration to prolong survival in combination with anti-PD-L1 therapy in a syngeneic murine model of MSS colon carcinoma. (A) Experimental model overview of the syngeneic murine colon carcinoma BALB/c murine model using MSS cell line CT-26. (B) Kaplan-Meier estimator curves for all treatment groups as indicated. Statistical significance was determined using a Log-rank (Mantel-Cox) test. (C) Overview of cell lineage markers used for flow cytometric immunophenotyping analysis. Two weeks after treatment initiation, immune cell subpopulations were analyzed in the spleen and tumor. (D) Splenic T cells, (E) tumor-infiltrating T cells, (F) splenic NK cells, and (G) tumor-infiltrating NK cells were compared between responders (R, N = 3) and non-responders (NR, N = 18), regardless of treatment group. NK cell subsets based on the expression of CD11b and CD27 were compared in the spleen and visualized via (H) bar graph and (I) pie chart. NK cell subsets based on the expression of CD11b and CD27 were also compared in the tumor and visualized via (J) bar graph and (K) pie chart. T cell ratios were compared in the (L) Spleen and (M) Tumor. Statistical significance was determined using two-tailed unpaired T tests. p-value legend: * p < 0.05, ** p < 0.01, *** p < 0.001, **** p < 0.0001. ns: non-significant.
Figure 5
Figure 5
Responders have a more immunostimulatory tumor microenvironment as compared to non-responders. IHC analysis of tumors two weeks post-treatment initiation or tumors from long-term mice. Non-responders (NR, N = 18) and responders (R, N = 3) were compared. 20 × images, scale bar represents 100 μm. (A,B) CD3, (C,D) Granzyme B, (E,F) Ki67, (G,H) PD-L1, and (I,J) cleaved-caspase 3 (CC3) were compared at the two weeks after treatment initiation timepoint, and the long-term timepoint, respectively. Statistical significance was determined using two-tailed unpaired T tests (N = 6). Serum from long-term mice sacrificed was analyzed via cytokine profiling for (K) CCL21, (L) VEGFR2, (M) CCL7, (N) CCL12, (O) BAFF, (P) VEGF, (Q) IL-1 β, (R) IL-6, (S) CCL22, (T) GM-CSF, (U) CCL4, (V) TWEAK, and (W) CCL2. Responders (red, N = 3) and non-responders (black, N = 18) were compared. A Kruskal-Wallis test was used to calculate statistical significance, followed by a Benjamini-Hochberg correction for multiple comparisons. p values are shown for analytes that were significantly different between responders and non-responders and are ordered by significance. p-value legend: * p < 0.05, ** p < 0.01, *** p < 0.001. ns: no significance.
Figure 6
Figure 6
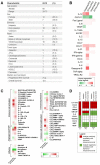
Patient plasma concentrations of cytokines correlate with progression-free survival (PFS), overall survival (OS), and in vivo response to therapy results. Plasma samples from human patients with refractory solid tumors of multiple tissue origins enrolled in a Phase 1 clinical trial investigating a novel GSK-3 inhibitor elraglusib (NCT03678883) were analyzed using a Luminex 200 (N = 19). (A) Table summarizing patient demographics. (B) Baseline and 24-h post-elraglusib plasma concentrations of cytokines, chemokines, and growth factors were plotted against PFS and OS. Simple linear regressions were used to calculate significance. p values less than 0.05 were reported as statistically significant. (C) Cytokines grouped by function. Fold-change is shown where green indicates a negative (<0) fold-change compared to the baseline (pre-dose) value and red indicates a positive (>0) fold-change. (D) Table comparing murine and human circulating biomarker trends. Red boxes indicate that an analyte concentration positively correlated with response to therapy/PFS/OS while green boxes indicate that an analyte concentration negatively correlated with response to therapy/PFS/OS.
Figure 7
Figure 7
Spatial profiling of patient tumor biopsies reveals a more immunostimulatory tumor microenvironment after elraglusib treatment. Patient samples were analyzed using NanoString GeoMx Digital Spatial Profiling (DSP) technology (N = 12 biopsies). (A) Pie charts showing biopsy timepoint, primary tumor type, metastatic biopsy tissue type, and paired/unpaired biopsy sample information breakdowns. (B) A representative region of interest (ROI) showing PanCK+ and CD45+ masking. Green indicates CK, red indicates CD45, and blue indicates DAPI staining. (C) A Sankey diagram was used to visualize the study design where the width of a cord in the figure represents how many segments are in common between the two annotations they connect. The scale bar represents 50 segments. Blue cords represent CD45+ segments and yellow cords represent panCK+ segments. (D) Heatmap of all areas of interest (AOIs). Patient IDs, immune cell locations, biopsy timepoint, biopsy tissue, primary tumor location, and segment identity information are color coded as indicated in the legend. (E) PanCK+ ROI CD39 expression plotted against time-on-study (TOS). Points are color-coded by time on study (TOS)/time on treatment with darker blue points indicating a shorter TOS or time on treatment. (F) CD45+ ROI CD163 expression plotted against TOS. (G) Volcano plot showing a comparison of CD45+ region protein expression in post-treatment biopsies and pre-treatment biopsies regardless of timepoint. Grey points are non-significant (NS), blue points have p values <0.05, and red points have false discovery rate (FDR) values less than 0.05. The size of the point represents the log2 UQ Signal-to-noise ratio (SNR). (H) Volcano plot showing a comparison of tumor-infiltrating CD45+ immune cell segment protein expression in pre- versus post-treatment biopsies. Grey points are non-significant (NS), blue points have p values <0.05, and red points have false discovery rate (FDR) values less than 0.05. The size of the point represents the log2 UQ Signal-to-noise ratio (SNR).

Update of

Similar articles

Cited by

References

    1. Ding L., Madamsetty V.S., Kiers S., Alekhina O., Ugolkov A., Dube J., Zhang Y., Zhang J.S., Wang E., Dutta S.K., et al. Glycogen Synthase Kinase-3 Inhibition Sensitizes Pancreatic Cancer Cells to Chemotherapy by Abrogating the TopBP1/ATR-Mediated DNA Damage Response. Clin. Cancer Res. 2019;25:6452–6462. doi: 10.1158/1078-0432.CCR-19-0799. - DOI - PMC - PubMed
    1. Force T., Woodgett J.R. Unique and overlapping functions of GSK-3 isoforms in cell differentiation and proliferation and cardiovascular development. J. Biol. Chem. 2009;284:9643–9647. doi: 10.1074/jbc.R800077200. - DOI - PMC - PubMed
    1. Zhang J.S., Herreros-Villanueva M., Koenig A., Deng Z., de Narvajas A.A.M., Gomez T.S., Meng X., Bujanda L., Ellenrieder V., Li X.K., et al. Differential activity of GSK-3 isoforms regulates NF-κB and TRAIL- or TNFα induced apoptosis in pancreatic cancer cells. Cell Death Dis. 2014;5:e1142. doi: 10.1038/cddis.2014.102. - DOI - PMC - PubMed
    1. Augello G., Emma M.R., Cusimano A., Azzolina A., Montalto G., McCubrey J.A., Cervello M. The Role of GSK-3 in Cancer Immunotherapy: GSK-3 Inhibitors as a New Frontier in Cancer Treatment. Cells. 2020;9:1427. doi: 10.3390/cells9061427. - DOI - PMC - PubMed
    1. Cohen P., Frame S. The renaissance of GSK3. Nat. Rev. Mol. Cell Biol. 2001;2:769–776. doi: 10.1038/35096075. - DOI - PubMed