. 2023 Jun 30;24(13):10969.
doi: 10.3390/ijms241310969.

Association of Differentially Altered Liver Fibrosis with Deposition of TGFBi in Stabilin-Deficient Mice

Affiliations

Association of Differentially Altered Liver Fibrosis with Deposition of TGFBi in Stabilin-Deficient Mice

Jessica Krzistetzko et al. Int J Mol Sci. .

Abstract

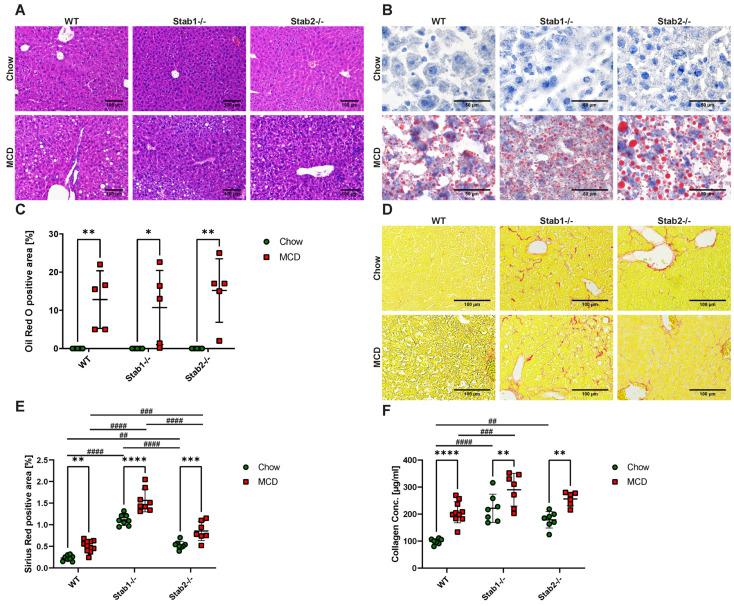
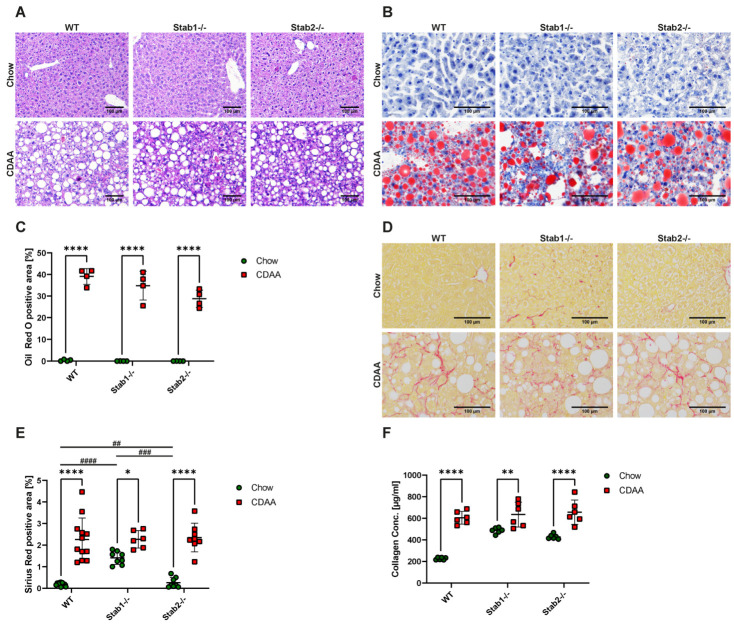
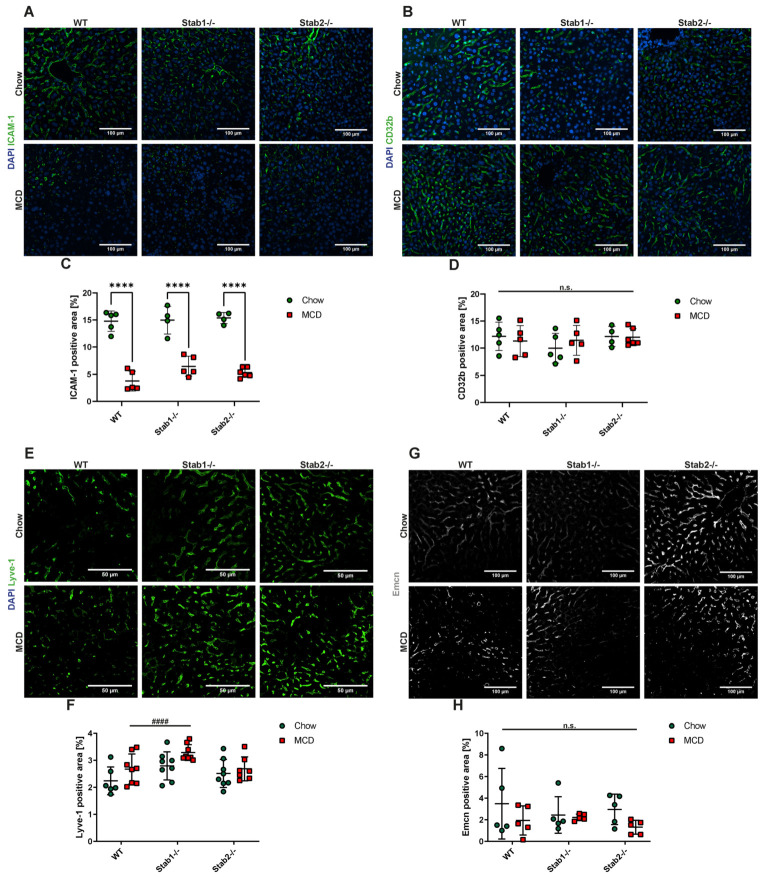
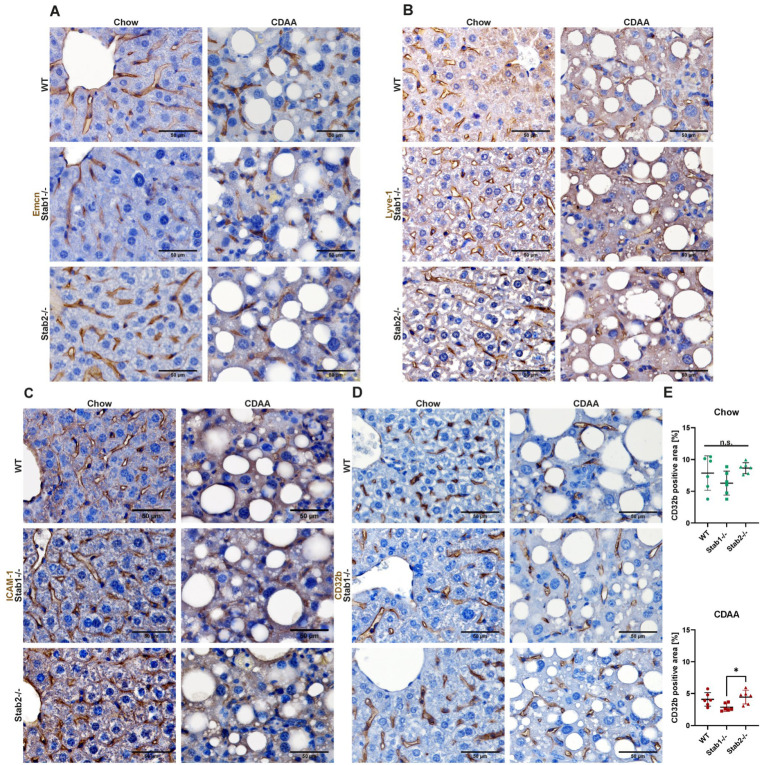
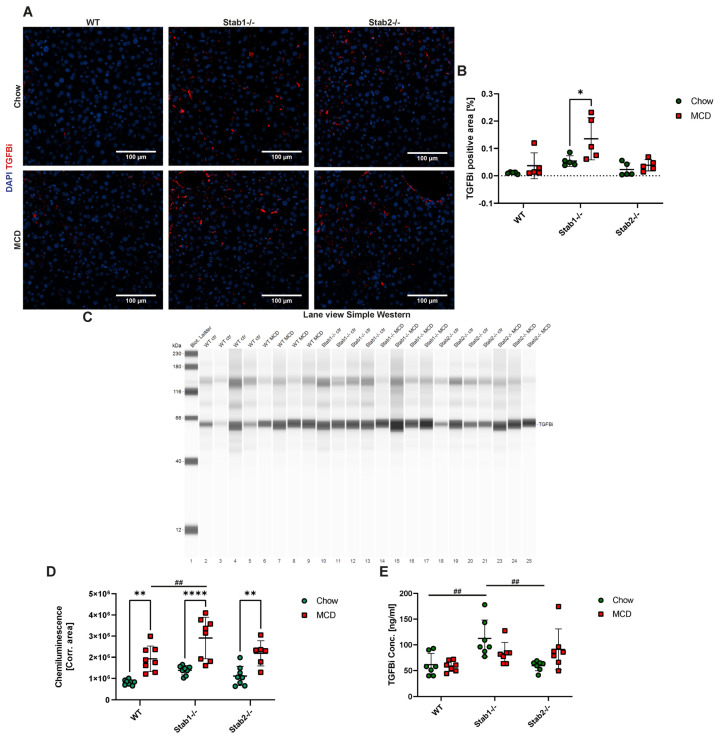
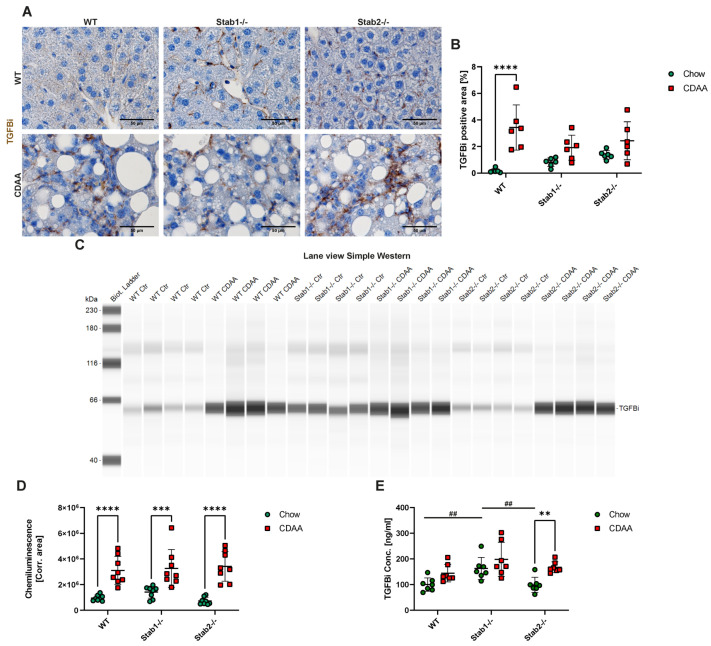
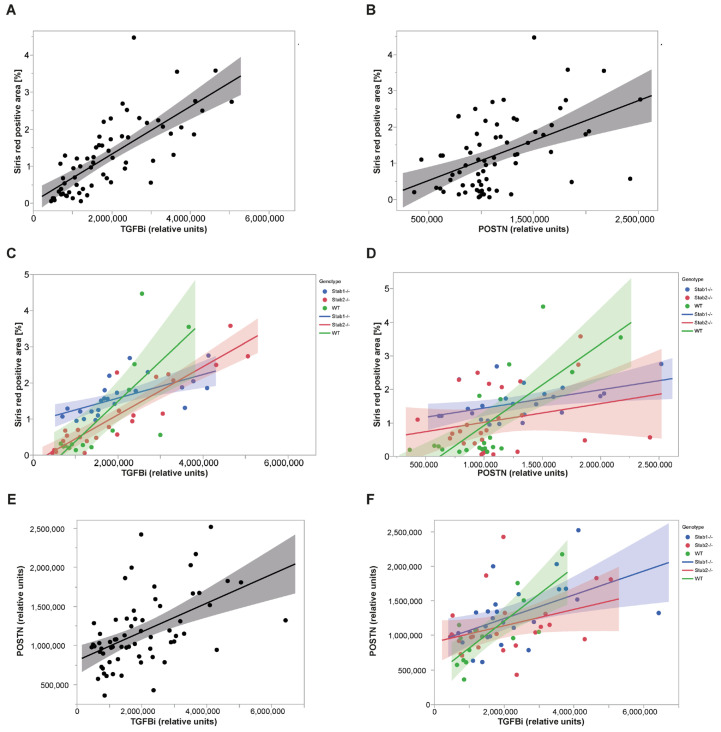
Liver sinusoidal endothelial cells (LSECs) control clearance of Transforming growth factor, beta-induced, 68kDa (TGFBi) and Periostin (POSTN) through scavenger receptors Stabilin-1 (Stab1) and Stabilin-2 (Stab2). Stabilin inhibition can ameliorate atherosclerosis in mouse models, while Stabilin-double-knockout leads to glomerulofibrosis. Fibrotic organ damage may pose a limiting factor in future anti-Stabilin therapies. While Stab1-deficient (Stab1-/-) mice were shown to exhibit higher liver fibrosis levels upon challenges, fibrosis susceptibility has not been studied in Stab2-deficient (Stab2-/-) mice. Wildtype (WT), Stab1-/- and Stab2-/- mice were fed experimental diets, and local ligand abundance, hepatic fibrosis, and ligand plasma levels were measured. Hepatic fibrosis was increased in both Stab1-/- and Stab2-/- at baseline. A pro-fibrotic short Methionine-Choline-deficient (MCD) diet induced slightly increased liver fibrosis in Stab1-/- and Stab2-/- mice. A Choline-deficient L-amino acid-defined (CDAA) diet induced liver fibrosis of similar distribution and extent in all genotypes (WT, Stab1-/- and Stab2-/-). A hepatic abundance of Stabilin ligand TGFBi correlated very highly with liver fibrosis levels. In contrast, plasma levels of TGFBi were increased only in Stab2-/- mice after the CDAA diet but not the MCD diet, indicating the differential effects of these diets. Here we show that a single Stabilin deficiency of either Stab1 or Stab2 induces mildly increased collagen depositions under homeostatic conditions. Upon experimental dietary challenge, the local abundance of Stabilin ligand TGFBi was differentially altered in Stabilin-deficient mice, indicating differentially affected LSEC scavenger functions. Since anti-Stabilin-directed therapies are in clinical evaluation for the treatment of diseases, these findings bear relevance to treatment with novel anti-Stabilin agents.

Keywords: TGFBi; liver fibrosis; scavenger receptors.


Conflict of interest statement

The authors declare no conflict of interest.

Figures

Figure 1
Figure 1
Effects of MCD diet on hepatic steatosis and fibrosis. (A) H&E staining of representative liver sections (scale bar = 100 µm). (B) Oil Red O staining of representative liver sections (scale bar = 50 µm). (C) Quantification of Oil Red O positive staining. (D) Sirius Red staining of representative liver sections (scale bar = 100 µm). (E) Quantification of Sirius Red positive staining. (F) Collagen assay of liver tissue of control mice and MCD mice. * show significances between treatments and # show significances between genotypes. The symbols show the following significances: p ≤ 0.05 = *; p < 0.01 = **/##; p < 0.001 = ***/###; p < 0.0001 = ****/####; n.s. means not significant.
Figure 2
Figure 2
Effects of CDAA diet on hepatic steatosis and fibrosis. (A) H&E staining of representative liver sections (scale bar = 100 µm). (B) Oil Red O staining of representative liver sections (scale bar = 100 µm). (C) Quantification of Oil Red O positive staining. (D) Sirius Red staining of representative liver sections (scale bar = 100 µm). (E) Quantification of Sirius Red positive staining. (F) Collagen assay of liver tissue of control mice and CDAA mice. * show significances between treatments and # show significances between genotypes. The symbols show the following significances: p ≤ 0.05 = *; p < 0.01 = **/##; p < 0.001 = ###; p < 0.0001 = ****/####; n.s. means not significant.
Figure 3
Figure 3
Effects of MCD diet on liver endothelial cells. (A,B) IF staining and quantification of ICAM-1 positive staining (scale bar = 100 µm). (C,D) IF staining and quantification of CD32b positive staining (scale bar = 100 µm). (E,F) IF staining and quantification of Lyve-1 positive staining (scale bar = 50 µm). (G,H) IF staining and quantification of Emcn positive staining (scale bar = 100 µm). * show significances between treatments and # show significances between genotypes. The symbols show the following significances: p < 0.0001 = ****/####; n.s. means not significant.
Figure 4
Figure 4
Effects of CDAA diet on liver endothelial cells. (A) IHC staining of Emcn (scale bar = 50 µm). (B) IHC staining of Lyve-1 (scale bar = 50 µm). (C) IHC staining of ICAM-1 (scale bar = 50 µm). (D) IHC staining of CD32b (scale bar = 50 µm). (E) Quantification of CD32b positive staining, separated to chow (upper panel) and CDAA treated (lower panel) mice. * show significances between treatments. The symbols show the following significances: p ≤ 0.05 = *; n.s. means not significant.
Figure 5
Figure 5
Effects of MCD diet on Stabilin ligand TGFBi. (A) TGFBi IF staining of representative liver sections (scale bar = 100 µm). (B) Quantification of TGFBi positive staining. (C) Lane view of TGFBi Simple Western from liver protein. (D) Quantification of TGFBi Simple Western. (E) Quantification of TGFBi ELISA from plasma. * show significances between treatments and # show significances between genotypes. The symbols show the following significances: p ≤ 0.05 = *; p < 0.01 = **/##; p < 0.0001 = ****; n.s. means not significant.
Figure 6
Figure 6
Effects of CDAA diet on Stabilin ligand TGFBi. (A) TGFBi IF staining of representative liver sections (scale bar = 100 µm). (B) Quantification of TGFBi positive staining. (C) Lane view of TGFBi Simple Western from liver protein. (D) Quantification of TGFBi Simple Western. (E) Quantification of TGFBi ELISA from plasma. * show significances between treatments and # show significances between genotypes. The symbols show the following significances: p < 0.01 = **/##; p < 0.001 = ***; p < 0.0001 = ****; n.s. means not significant.
Figure 7
Figure 7
Correlation of Stabilin ligands TGFBi, POSTN, and liver fibrosis. (A) Overall correlation of TGFBi levels (Simple Western) and Sirius Red positive area across all genotypes and experiments. (B) Overall correlation of POSTN levels (Simple Western) and Sirius Red positive area across all genotypes and experiments. (C) Overall correlation of TGFBi levels (Simple Western) and Sirius Red positive area separated by genotypes. (D) Overall correlation of POSTN levels (Simple Western) and Sirius Red positive area separated by genotypes. (E) Correlation of POSTN levels (Simple Western) and TGFBi levels (Simple Western) across all genotypes and experiments. (F) Correlation of POSTN levels (Simple Western) and TGFBi levels (Simple Western) separated by genotypes.

References

    1. Koch P.S., Lee K.H., Goerdt S., Augustin H.G. Angiodiversity and organotypic functions of sinusoidal endothelial cells. Angiogenesis. 2021;24:289–310. doi: 10.1007/s10456-021-09780-y. - DOI - PMC - PubMed
    1. Bhandari S., Larsen A.K., McCourt P., Smedsrød B., Sørensen K.K. The Scavenger Function of Liver Sinusoidal Endothelial Cells in Health and Disease. Front. Physiol. 2021;12:757469. doi: 10.3389/fphys.2021.757469. - DOI - PMC - PubMed
    1. PrabhuDas M.R., Baldwin C.L., Bollyky P.L., Bowdish D.M.E., Drickamer K., Febbraio M., Herz J., Kobzik L., Krieger M., Loike J., et al. A Consensus Definitive Classification of Scavenger Receptors and Their Roles in Health and Disease. J. Immunol. 2017;198:3775–3789. doi: 10.4049/jimmunol.1700373. - DOI - PMC - PubMed
    1. Goerdt S., Walsh L.J., Murphy G.F., Pober J.S. Identification of a novel high molecular weight protein preferentially expressed by sinusoidal endothelial cells in normal human tissues. J. Cell Biol. 1991;113:1425–1437. doi: 10.1083/jcb.113.6.1425. - DOI - PMC - PubMed
    1. Goerdt S., Bhardwaj R., Sorg C. Inducible expression of MS-1 high-molecular-weight protein by endothelial cells of continuous origin and by dendritic cells/macrophages in vivo and in vitro. Am. J. Pathol. 1993;142:1409–1422. - PMC - PubMed