

Salivary miRNA Profiles in COVID-19 Patients with Different Disease Severities
- PMID: 37446170
- PMCID: PMC10341682
- DOI: 10.3390/ijms241310992
Salivary miRNA Profiles in COVID-19 Patients with Different Disease Severities
Abstract
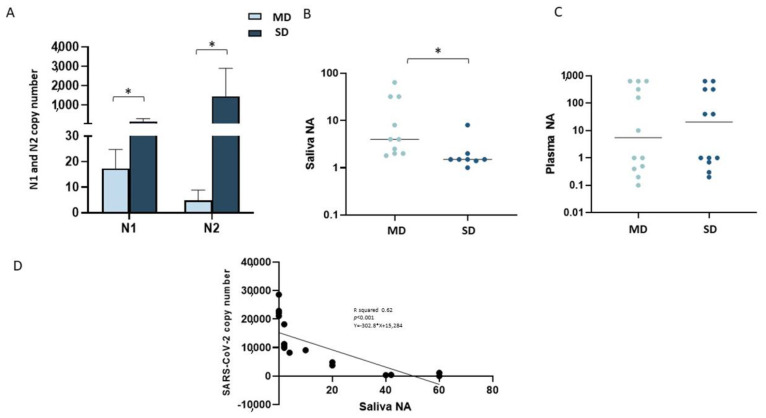
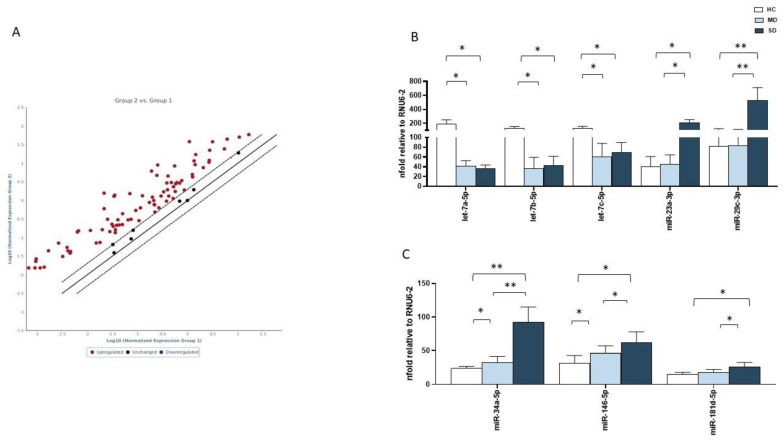
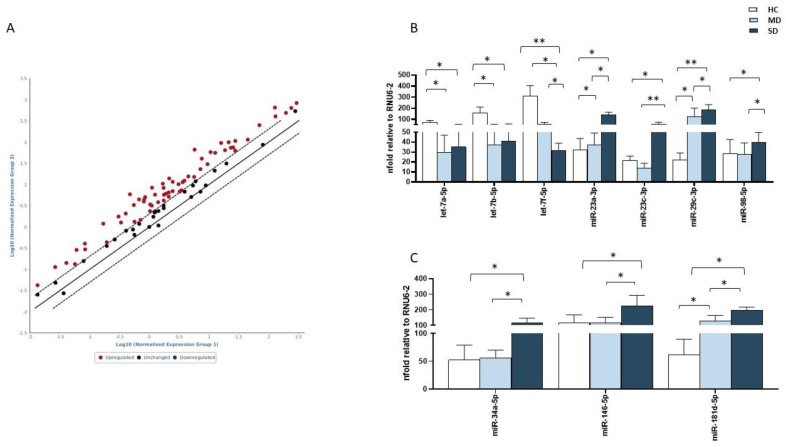
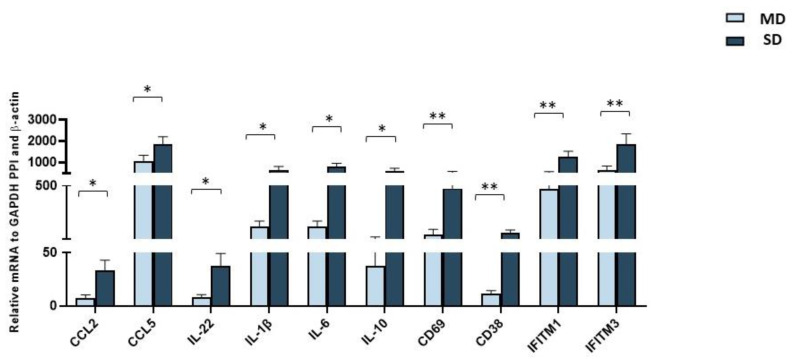
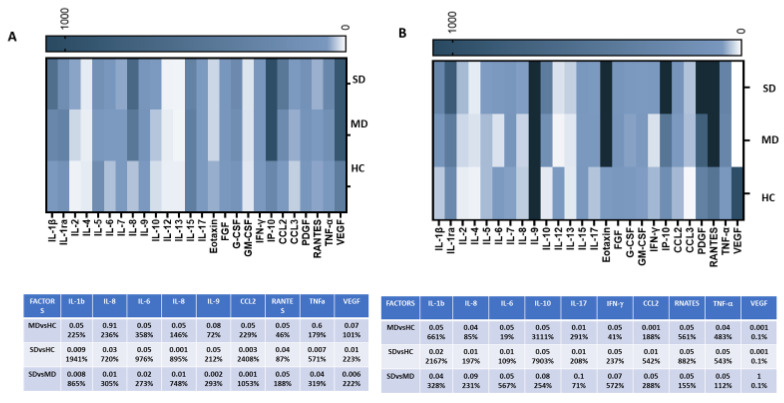
The oral mucosa is the first site of SARS-CoV-2 entry and replication, and it plays a central role in the early defense against infection. Thus, the SARS-CoV-2 viral load, miRNAs, cytokines, and neutralizing activity (NA) were assessed in saliva and plasma from mild (MD) and severe (SD) COVID-19 patients. Here we showed that of the 84 miRNAs analyzed, 8 were differently expressed in the plasma and saliva of SD patients. In particular: (1) miRNAs let-7a-5p, let-7b-5p, and let-7c-5p were significantly downregulated; and (2) miR-23a and b and miR-29c, as well as three immunomodulatory miRNAs (miR-34a-5p, miR-181d-5p, and miR-146) were significantly upregulated. The production of pro-inflammatory cytokines (IL-1β, IL-2, IL-6, IL-8, IL-9, and TNFα) and chemokines (CCL2 and RANTES) increased in both the saliva and plasma of SD and MD patients. Notably, disease severity correlated with NA and immune activation. Monitoring these parameters could help predict disease outcomes and identify new markers of disease progression.
Keywords: COVID-19; SARS-CoV-2; epigenetic profile; miRNA; non-coding RNA.
Conflict of interest statement
The authors declare no conflict of interest.
Figures
Similar articles
-
Cellular miR-150-5p may have a crucial role to play in the biology of SARS-CoV-2 infection by regulating nsp10 gene.RNA Biol. 2022;19(1):1-11. doi: 10.1080/15476286.2021.2010959. Epub 2021 Dec 31. RNA Biol. 2022. PMID: 34904915 Free PMC article.
-
SARS-COV-2 as potential microRNA sponge in COVID-19 patients.BMC Med Genomics. 2022 Apr 23;15(Suppl 2):94. doi: 10.1186/s12920-022-01243-7. BMC Med Genomics. 2022. PMID: 35461273 Free PMC article.
-
Saliva microRNA Profile in Children with and without Severe SARS-CoV-2 Infection.Int J Mol Sci. 2023 May 3;24(9):8175. doi: 10.3390/ijms24098175. Int J Mol Sci. 2023. PMID: 37175883 Free PMC article.
-
MicroRNAs as Potential Tools for Predicting Cancer Patients' Susceptibility to SARS-CoV-2 Infection and Vaccination Response.Cells. 2022 Jul 23;11(15):2279. doi: 10.3390/cells11152279. Cells. 2022. PMID: 35892576 Free PMC article. Review.
-
Alterations in Circulating miRNA Levels after Infection with SARS-CoV-2 Could Contribute to the Development of Cardiovascular Diseases: What We Know So Far.Int J Mol Sci. 2023 Jan 25;24(3):2380. doi: 10.3390/ijms24032380. Int J Mol Sci. 2023. PMID: 36768701 Free PMC article. Review.
Cited by
-
The relationship between microRNAs and COVID-19 complications.Noncoding RNA Res. 2024 Aug 22;10:16-24. doi: 10.1016/j.ncrna.2024.08.007. eCollection 2025 Feb. Noncoding RNA Res. 2024. PMID: 39296641 Free PMC article. Review.
-
Telomere Length, Oxidative Stress Markers, and Related miRNAs in Non-Invasive Samples of Mild COVID-19 Cases.Int J Mol Sci. 2025 May 21;26(10):4934. doi: 10.3390/ijms26104934. Int J Mol Sci. 2025. PMID: 40430074 Free PMC article.
-
Immune Stimulation with Imiquimod to Best Face SARS-CoV-2 Infection and Prevent Long COVID.Int J Mol Sci. 2024 Jul 12;25(14):7661. doi: 10.3390/ijms25147661. Int J Mol Sci. 2024. PMID: 39062904 Free PMC article. Review.
-
Sample-to-answer salivary miRNA testing: New frontiers in point-of-care diagnostic technologies.Wiley Interdiscip Rev Nanomed Nanobiotechnol. 2024 May-Jun;16(3):e1969. doi: 10.1002/wnan.1969. Wiley Interdiscip Rev Nanomed Nanobiotechnol. 2024. PMID: 38783564 Free PMC article. Review.
References
MeSH terms
Substances
LinkOut - more resources
Full Text Sources
Medical
Molecular Biology Databases
Miscellaneous
