. 2023 Jul 3;24(13):11034.
doi: 10.3390/ijms241311034.

Humanization of the Reaction Specificity of Mouse Alox15b Inversely Modified the Susceptibility of Corresponding Knock-In Mice in Two Different Animal Inflammation Models

Affiliations

Humanization of the Reaction Specificity of Mouse Alox15b Inversely Modified the Susceptibility of Corresponding Knock-In Mice in Two Different Animal Inflammation Models

Marjann Schäfer et al. Int J Mol Sci. .

Abstract

Mammalian arachidonic acid lipoxygenases (ALOXs) have been implicated in the pathogenesis of inflammatory diseases, and its pro- and anti-inflammatory effects have been reported for different ALOX-isoforms. Human ALOX15B oxygenates arachidonic acid to its 15-hydroperoxy derivative, whereas the corresponding 8-hydroperoxide is formed by mouse Alox15b (Alox8). This functional difference impacts the biosynthetic capacity of the two enzymes for creating pro- and anti-inflammatory eicosanoids. To explore the functional consequences of the humanization of the reaction specificity of mouse Alox15b in vivo, we tested Alox15b knock-in mice that express the arachidonic acid 15-lipoxygenating Tyr603Asp and His604Val double mutant of Alox15b, instead of the arachidonic acid 8-lipoxygenating wildtype enzyme, in two different animal inflammation models. In the dextran sodium sulfate-induced colitis model, female Alox15b-KI mice lost significantly more bodyweight during the acute phase of inflammation and recovered less rapidly during the resolution phase. Although we observed significant differences in the colonic levels of selected pro- and anti-inflammatory eicosanoids during the time-course of inflammation, there were no differences between the two genotypes at any time-point of the disease. In Freund's complete adjuvant-induced paw edema model, Alox15b-KI mice were less susceptible than outbred wildtype controls, though we did not observe significant differences in pain perception (Hargreaves-test, von Frey-test) when the two genotypes were compared. our data indicate that humanization of the reaction specificity of mouse Alox15b (Alox8) sensitizes mice for dextran sodium sulfate-induced experimental colitis, but partly protects the animals in the complete Freund's adjuvant-induced paw edema model.

Keywords: atherosclerosis; eicosanoids; fatty acids; inflammation; lipids; metabolism.


Conflict of interest statement

The authors declare no conflict of interest.

Figures

Figure 1
Figure 1
Ex vivo activity assays performed using homogenates of PMA-treated mouse skin as an enzyme source. The epidermis of phorbol myristate (PMA)-treated mouse tails were prepared from Alox15b-KI mice and outbred wildtype controls, they were homogenized and the homogenate supernatant was incubated in vitro with 100 µM AA (see Section 4). After lipid extraction, the conjugated dienes formed were prepared via RP-HPLC and further analyzed via combined NP/CP-HPLC, as described in Section 4. The absorbance at 235 nm was recorded, and the retention times of authentic standards are indicated above the chromatographic traces. (A) wildtype mice, (B) Alox15b-KI mice. Three different individuals of either genotype were analyzed, and representative NP/CP-HPLC chromatograms are shown.
Figure 2
Figure 2
DSS-induced colitis in Alox15b-KI mice and outbred wildtype controls. Colonies of Alox15b-KI mice expressing an Alox15b mutant with humanized reaction specificity and outbred wildtype controls were established (see Section 4), and these animals were tested in the DSS-induced experimental colitis model. The experimental approach, animal grouping and quantification of the readout parameters are explained in detail in Section 4. (A) Body weight kinetics of Alox15-KI mice and outbred wildtype controls. Statistical analysis of the experimental raw data was performed via a two-way ANOVA; *** p < 0.001. (B) Colon lengths determined at different time points of the experimental protocol. Statistical evaluation of the experimental raw data was carried out via the Mann–Whitney U-test; ** p < 0.01, **** p < 0.0001. (C) Representative histological cross sections of the colon at different time points during the experimental protocol. Left panel, wildtype mice; right panel, Alox15b-KI mice. Solid arrows indicate infiltrations of inflammatory cells. Dotted arrows indicate mucosal ulcerations.
Figure 3
Figure 3
Quantification of hydroxy polyenoic fatty acids in colon tissue at different time points during DSS-induced colitis. Experimental colitis was induced in Alox15b-KI mice and outbred wildtype controls, as described in Section 4. At different time points, animals were sacrificed, colon was prepared, total lipids were extracted, extracts were hydrolyzed and the resulting free fatty acid derivatives were analyzed via LC-MS (see Section 4). The hydroxy fatty acids specified in Table S1 were separately quantified and summed up. Experimental raw data were evaluated via the Mann–Whitney U-test. Five representatives (n = 5) of the different experimental groups were analyzed. For the Alox15b-KI animals, 10 days after DSS removal, only 3 animals were analyzed (n = 3.) ns—statistically not significant, **—p < 0.01, ****—p < 0.0001.
Figure 4
Figure 4
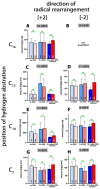
Quantification of arachidonic acid oxygenation products in colon tissue at different time points during DSS-induced colitis. Experimental colitis was induced in Alox15b-KI mice and outbred wildtype controls, as described in Section 4. At different time points, animals were sacrificed, colon was prepared, total lipids were extracted, extracts were hydrolyzed and the resulting free arachidonic acid oxygenation products were analyzed via LC-MS (see Section 4). The carbon atom, from which a hydrogen radical is abstracted during biosynthesis (left part of the image), and the direction of radical rearrangement ([n + 2] radical rearrangement in the direction of the methyl end of the fatty acid, [n − 2] radical rearrangement in the direction of the carboxylic group of the fatty acid) are indicated (upper part of the image). Experimental raw data were evaluated via the Mann–Whitney U-test. Five representatives (n = 5) of the different experimental groups were analyzed. For the Alox15b-KI animals, 10 days after DSS removal, only 3 animals were analyzed (n = 3). ns—statistically not significant, *—p < 0.05, **—p < 0.01, ***—p < 0.001, ****—p < 0.0001. (A) 15-HETE, (B) 11-HETE, (C) 12-HETE, (D) 8-HETE, (E) 9-HETE, (F) 5-HETE.
Figure 5
Figure 5
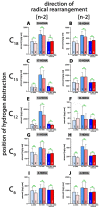
Quantification of eicosapentaenoic acid oxygenation products in colon tissue at different time points during DSS-induced colitis. Experimental colitis was induced in Alox15b-KI mice and outbred wildtype controls, as described in Section 4. At different time points, animals were sacrificed, colon was prepared, total lipids were extracted, extracts were hydrolyzed and the resulting free 5,8,11,14,17-eicosapentaenoic acid oxygenation products were analyzed via LC-MS (see Section 4). The carbon atom, from which a hydrogen radical is abstracted during biosynthesis (left part of the image), and the direction of radical rearrangement ([n + 2] radical rearrangement in the direction of the methyl end of the fatty acid, [n − 2] radical rearrangement in the direction of the carboxylic group of the fatty acid) are indicated (upper part of the image). Experimental raw data were evaluated via the Mann–Whitney U-test. Five representatives (n = 5) of the different experimental groups were analyzed. For the Alox15b-KI animals, 10 days after DSS removal, only 3 animals were analyzed (n = 3.) ns—statistically not significant. (A) 18-HEPE, (B) 14-HEPE (not quantified), (C) 15-HEPE, (D) 11-HEPE, (E) 12-HEPE, (F) 8-HEPE, (G) 9-HEPE, (H) 5-HEPE.
Figure 6
Figure 6
Quantification of docosahexaenoic acid oxygenation products in colon tissue at different time points during DSS-induced colitis. Experimental colitis was induced in Alox15b-KI mice and outbred wildtype controls, as described in Section 4. At different time points, animals were sacrificed, colon was prepared, total lipids were extracted, extracts were hydrolyzed and the resulting free docosahexaenoic acid oxygenation products were analyzed via LC-MS (see Section 4). The carbon atom, from which a hydrogen radical is abstracted during biosynthesis (left part of the image), and the direction of radical rearrangement ([n + 2] radical rearrangement in the direction of the methyl end of the fatty acid, [n − 2] radical rearrangement in the direction of the carboxylic group of the fatty acid) are indicated (upper part of the image). Experimental raw data were evaluated via the Mann–Whitney U-test. Five representatives (n = 5) of the different experimental groups were analyzed. For the Alox15b-KI animals, 10 days after DSS removal, only 3 animals were analyzed (n = 3). ns—statistically not significant, *—p < 0.05, **—p < 0.01. (A) 20-HDHA, (B) 16-HDHA, (C) 17-HDHA, (D) 13-HDHA, (E) 14-HDHA, (F) 10-HDHA, (G) 11-HDHA, (H) 7-HDHA, (I) 8-HDHA, (J) 4-HDHA.
Figure 7
Figure 7
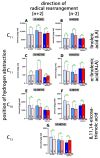
Quantification of the oxygenation products of different polyenoic fatty acids in colon tissue at different time points of DSS-induced colitis. Experimental colitis was induced in Alox15b-KI mice and outbred wildtype controls, as described in Section 4. At different time points, animals were sacrificed, the colon was prepared, total lipids were extracted, extracts were hydrolyzed and the resulting free polyenoic fatty acid oxygenation products were analyzed through LC-MS (see Section 4). The carbon atom, from which a hydrogen radical is abstracted during biosynthesis (left part of the image), and the direction of radical rearrangement ([n + 2] radical rearrangement in the direction of the methyl end of the fatty acid, [n − 2] radical rearrangement in the direction of the carboxylic group of the fatty acid) are indicated (upper part of the image). Experimental raw data were evaluated via the Mann–Whitney U-test. Five representatives (n = 5) of the different experimental groups were analyzed. For the Alox15b-KI animals, 10 days after DSS removal, only 3 animals were analyzed (n = 3). ns—statistically not significant, ***—p < 0.001. (A) 13-HODE, (B) 9-HODE, (C) 13-HOTrE, (D) 9-HOTrE, (E) 12-HETrE, (F) 8-HETrE, (G) 15-HETrE.
Figure 8
Figure 8
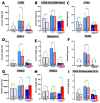
Quantification of complex oxygenation products of different polyenoic fatty acids in colon tissue at different time points of DSS-induced colitis. Experimental colitis was induced in Alox15b-KI mice and in outbred wildtype controls as described in Section 4. At different time points animals were sacrificed, colon was prepared, total lipids were extracted, extracts were hydrolyzed and the resulting complex polyenoic fatty acid oxygenation products were analyzed via LC-MS/MS (see Section 4). The carbon atom, from which a hydrogen radical is abstracted during biosynthesis (left part of the image) and the direction of radical rearrangement ([n + 2]—radical rearrangement in the direction of the methyl end of the fatty acid, [n − 2] radical rearrangement in the direction of the carboxylic group of the fatty acid) are indicated (upper part of the image). Experimental raw data were evaluated with the Mann-Whitney U-test. Five representatives (n = 5) of the different experimental groups were analyzed. For the Alox15b-KI animals 10 days after DSS removal only 3 animals were analyzed (n = 3). ns—statistically not significant. *—p < 0.05, **—p < 0.01. (A) LTB4, (B) LTB4 18-COOH-dinor, (C) LTB3, (D) NPD-1, (E) Maresin-2, (F) RvD5, (G) PGB2, (H) PGB3, (I) PGJ2 15-deoxy delta 12, 14.
Figure 9
Figure 9
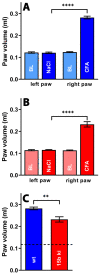
Freund’s complete adjuvant-induced paw edema inflammation model. Inflammation of mouse paw was induced via subcutaneous injection of Freund’s complete adjuvant, as described in the Section 4. After two days, the paw volume was measured (see Section 4) as the clinical readout parameter for the intensity of the inflammatory reaction. A Mann–Whitney U-test with n = 10 was performed in each experimental group. ns—statistically not significant; **** p < 0.0001, ** p < 0.01. (A) Comparison between paw volumes in wildtype mice. (B) Comparison between paw volumes in Alox15b-KI mice. (C) Comparison between paw volumes in wildtype and Alox15b-KI mice two days after CFA injection.
Figure 10
Figure 10
Quantification of pain perception in the Freund’s complete adjuvant-induced paw edema inflammation model. Inflammation of mouse paw was induced through subcutaneous injection of Freund’s complete adjuvant, as described in the Section 4. After two days, the paw withdrawal latency (see Section 4), Hargreaves test, panels (AC) and the withdrawal threshold (see Section 4), von Frey test, panels (DF) were measured as clinical readout parameters for pain perception. A Mann–Whitney U-test with n = 10 was performed in each experimental group. ns—statistically not significant; **** p < 0.0001. (A) Paw withdrawal latency of wildtype mice, (B) paw withdrawal latency of Alox15b-KI mice, (C) comparison between paw withdrawal latency of wildtype and Alox15b-KI mice two days after FCA injection (D) paw withdrawal threshold of wildtype mice, (E) paw withdrawal threshold of Alox15b-KI mice, and (F) comparison between paw withdrawal threshold of wildtype and Alox15b-KI mice two days after FCA injection.

Similar articles

Cited by

References

    1. Medzhitov R. Origin and physiological roles of inflammation. Nature. 2008;454:428–435. doi: 10.1038/nature07201. - DOI - PubMed
    1. Barton G.M. A calculated response: Control of inflammation by the innate immune system. J. Clin. Investig. 2008;118:413–420. doi: 10.1172/JCI34431. - DOI - PMC - PubMed
    1. Nathan C. Points of control in inflammation. Nature. 2002;420:846–852. doi: 10.1038/nature01320. - DOI - PubMed
    1. Nathan C., Ding A. Nonresolving inflammation. Cell. 2010;140:871–882. doi: 10.1016/j.cell.2010.02.029. - DOI - PubMed
    1. Serhan C.N., Savill J. Resolution of inflammation: The beginning programs the end. Nat. Immunol. 2005;6:1191–1197. doi: 10.1038/ni1276. - DOI - PubMed

LinkOut - more resources