. 2023 Jul 5;24(13):11129.
doi: 10.3390/ijms241311129.

A C57BL/6J Fancg-KO Mouse Model Generated by CRISPR/Cas9 Partially Captures the Human Phenotype

Affiliations

A C57BL/6J Fancg-KO Mouse Model Generated by CRISPR/Cas9 Partially Captures the Human Phenotype

Ronak Shah et al. Int J Mol Sci. .

Abstract

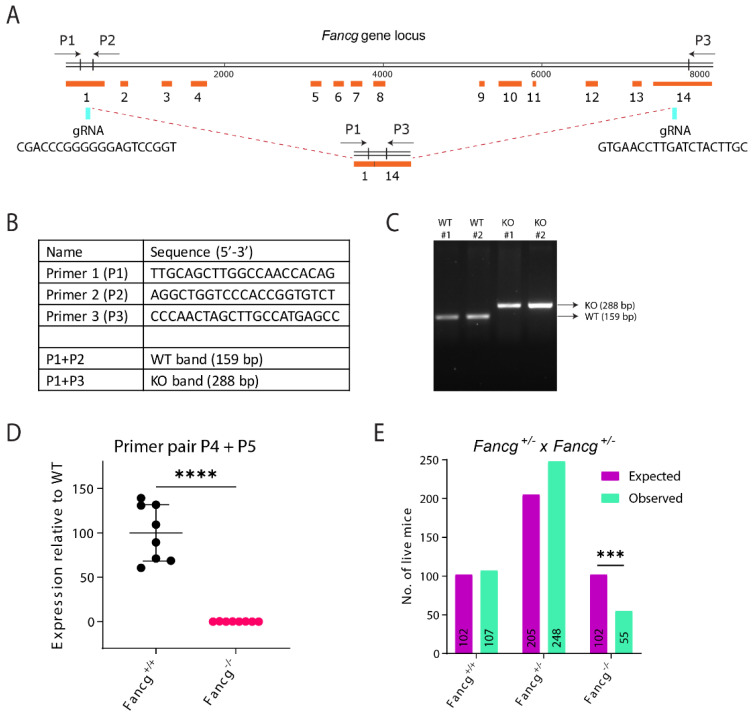
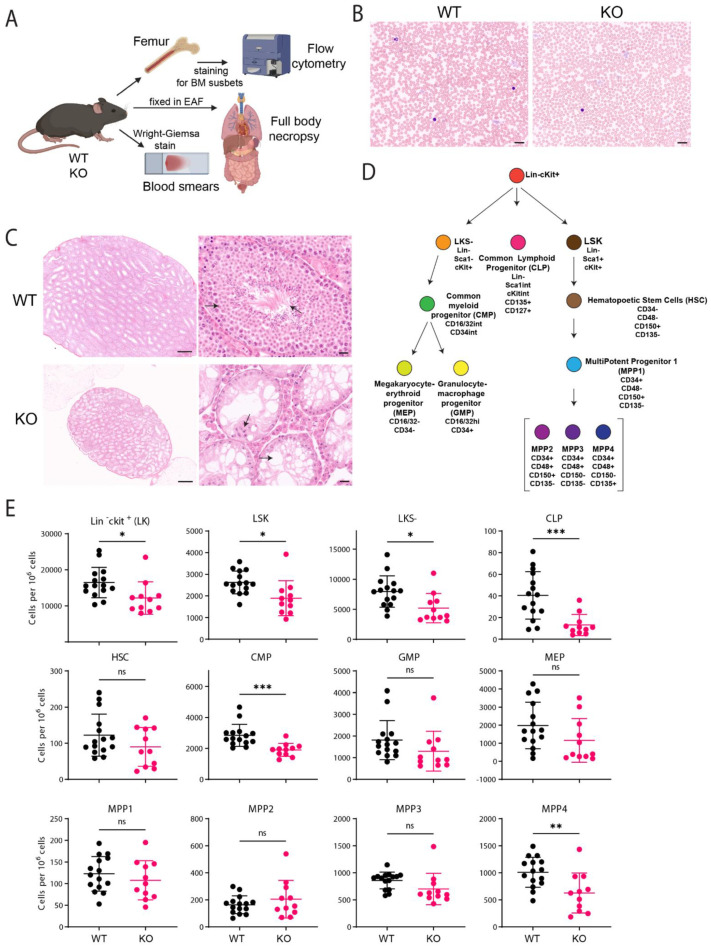
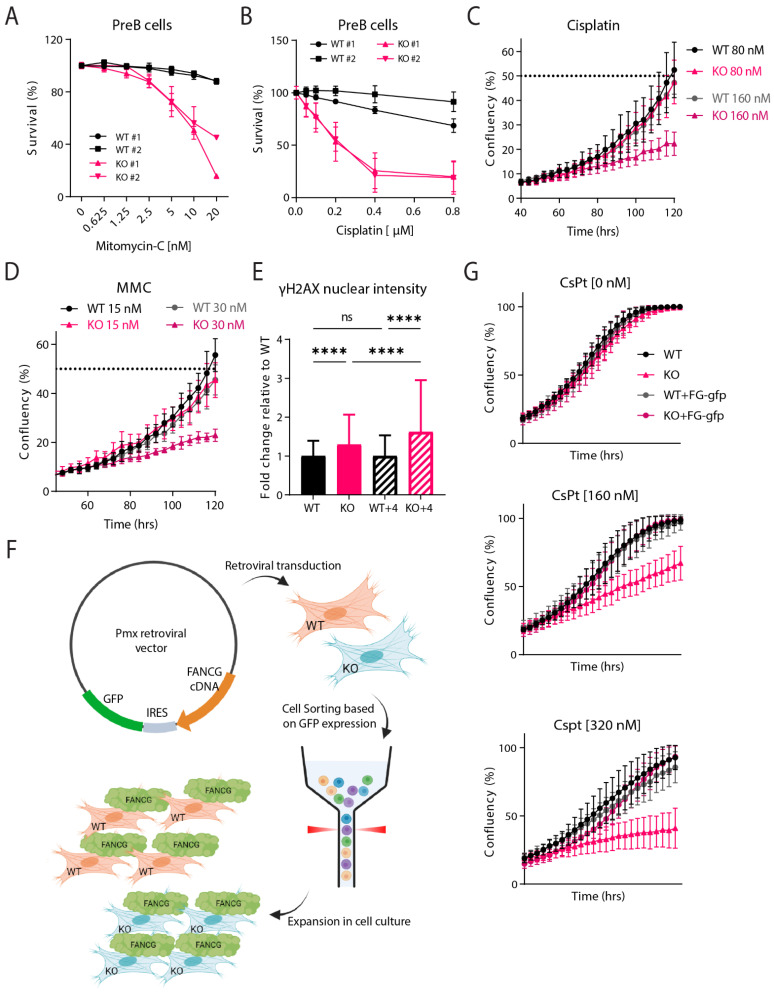
Fanconi anemia (FA) develops due to a mutation in one of the FANC genes that are involved in the repair of interstrand crosslinks (ICLs). FANCG, a member of the FA core complex, is essential for ICL repair. Previous FANCG-deficient mouse models were generated with drug-based selection cassettes in mixed mice backgrounds, leading to a disparity in the interpretation of genotype-related phenotype. We created a Fancg-KO (KO) mouse model using CRISPR/Cas9 to exclude these confounders. The entire Fancg locus was targeted and maintained on the immunological well-characterized C57BL/6J background. The intercrossing of heterozygous mice resulted in sub-Mendelian numbers of homozygous mice, suggesting the loss of FANCG can be embryonically lethal. KO mice displayed infertility and hypogonadism, but no other developmental problems. Bone marrow analysis revealed a defect in various hematopoietic stem and progenitor subsets with a bias towards myelopoiesis. Cell lines derived from Fancg-KO mice were hypersensitive to the crosslinking agents cisplatin and Mitomycin C, and Fancg-KO mouse embryonic fibroblasts (MEFs) displayed increased γ-H2AX upon cisplatin treatment. The reconstitution of these MEFs with Fancg cDNA corrected for the ICL hypersensitivity. This project provides a new, genetically, and immunologically well-defined Fancg-KO mouse model for further in vivo and in vitro studies on FANCG and ICL repair.

Keywords: CRISPR/Cas9; DNA damage response; FANCG; Mitomycin C (MMC); cisplatin (CsPt); fanconi anemia (FA); genetically engineered mouse model (GEMM); hematopoiesis; interstrand crosslink (ICL).


Conflict of interest statement

The authors declare no conflict of interest.

Figures

Figure 1
Figure 1
Establishing a genetically and immunologically defined C57BL/6J Fancg-KO mouse model. (A) Schematic representation of the Fancg locus in the mouse and its CRISPR/Cas9 based inactivation. Cas9 activity targeted by the two gRNAs at Fancg locus in exon 1 and 14 is indicated (blue flashes). The product after the 7.5kb DNA fragment deletion is also displayed and can be detected and distinguished from wild type using the three primers P1, P2 and P3 (black arrows). (B) The table lists the sequence of primers used to screen for the knockout of Fancg allele and the primer combinations used to detect WT and Fancg-KO band simultaneously in one PCR reaction. (C) Genotype PCR distinguished WT (P1+P2) from KO(P1+P3) alleles. (D) Using qRT-PCR the lack of exons 2, 3 and 4 in the mutant cDNA of Fancg was confirmed using the primer pair id 253735709c1 from PrimerBank database. GAPDH was used as internal control and expression was plotted upon normalizing to expression of GAPDH and WT allele. p value was calculated using Welch’s t test, **** p < 0.0001. (E) Observed and expected numbers of offspring obtained from Fancg+/− intercrosses. Fancg-KO mice were born at sub-Mendelian frequencies. p values were calculated using Pearson’s Chi square test, *** p < 0.001.
Figure 2
Figure 2
C57BL/6J Fancg-KO mice display stem cell defects. (A) WT and KO mice were sacrificed, and various tissues were harvested. Femur and tibia were flushed and used to isolate hematopoietic progenitors that were characterized using a special cocktail described in D using flowcytometry. Other tissues such as the reproductive organs, sternum and spleen were fixed in EAF, processed and stained for H&E. Blood smears were performed by puncturing the heart and stained with the Wright–Giemsa protocol. (B) Representative Wright–Giemsa-stained blood smears from WT and KO adult mice. Scale bar: 20 um. (C) Sections of testis from WT and KO mice. Wild type testis are much larger in size than knockout mice (left panel). On zooming in, black arrows indicate normal spermatogenesis (black arrow) in wild type mice, while knockout mice, filled only by vacuoles (black arrow) and sertoli cells, indicate severe testicular degeneration and impaired spermatogenesis. Scale bar: 100 um. (D) Schematic representation of the different hematopoietic subsets identified using defined cell surface markers. (E) Numbers of different hematopoietic subsets as defined in Figure 2A. The graphs indicate specific cell counts per 1 * 106 live cells. In each graph the bar represents the mean ± sd. WT (n = 15) and KO (n = 11). p values were calculated using one-way ANOVA. * p< 0.05, ** p < 0.01, *** p < 0.001, ns indicates non-significance.
Figure 3
Figure 3
Fancg-KO cells are hypersensitive to crosslinking agents. (A,B) PreB cells cultured from independent WT or KO fetal livers were exposed to increasing concentrations of (A) Mitomycin C or (B) cisplatin and measured after three days by flowcytometry. Graph displays survival for two independent clones for each genotype, normalized to its untreated condition. Experiments were performed twice. Bar represents mean ± sd. (C) Trp53kd WT and KO MEFs were seeded at 250 cells/well in a 96-well plate and treated with two different doses of cisplatin (80 and 160 nM) a day later. Cell confluency was measured every 4 h using IncuCyte live cell imaging system from two independent experiments. Analysis was performed for the timepoint when WT samples reached 50% confluency. Dots at each timepoint indicate mean and bars represent sd. (D) Trp53kd WT and KO MEFs were seeded at 250 cells/well in a 96-well plate and treated with two different doses of MMC (15 and 30 nM) a day later. Cell confluency was measured every 4 h using IncuCyte live cell imaging system from two independent experiments. The analysis was performed for timepoints when WT samples reached 50% confluency. Dots at each timepoint indicate mean and bars represent sd. (E) Trp53kd WT and KO MEFs were seeded on coverslips and treated with 20 μM cisplatin. After 1 h, one batch of cells was fixed while the other batch was refreshed with medium and fixed 4 h later. Cells were stained for γ-H2AX and nuclear intensity was measured using a microscope. Graphs display the intensity as fold change relative to WT. p values were calculated using a Brown–Forsythe and Welch ANOVA test. **** p < 0.0001, ns indicates non-significance (F) Schematic displaying the protocol utilized to obtain stable WT/KO MEFs expressing the Fancg-flag-gfp overexpression construct. Trp53kd MEFs were retrovirally transfected with the pmx vector, sorted for GFP expression and expanded for further use. (G) TP53kd WT, KO, WT+FG-gfp and KO+FG-gfp MEFs were seeded at 250 cells/well in a 96-well plate. Cell confluency was measured with/without cisplatin (CsPt) every 4 h using IncuCyte live cell imaging system from two independent experiments. Dots at each timepoint indicate mean and bars represent sd.

Similar articles

Cited by

References

    1. Yamashita T., Nakahata T. Current Knowledge on the Pathophysiology of Fanconi Anemia: From Genes to Phenotypes. Int. J. Hematol. 2001;74:33–41. doi: 10.1007/BF02982547. - DOI - PubMed
    1. Guitton-Sert L., Gao Y., Masson J.-Y. Animal models of Fanconi anemia: A developmental and therapeutic perspective on a multifaceted disease. Semin. Cell. Dev. Biol. 2021;113:113–131. doi: 10.1016/j.semcdb.2020.11.010. - DOI - PubMed
    1. Ceccaldi R., Sarangi P., D’Andrea A.D. The Fanconi anaemia pathway: New players and new functions. Nat. Rev. Mol. Cell. Biol. 2016;17:337–349. doi: 10.1038/nrm.2016.48. - DOI - PubMed
    1. Errazquin R., Page A., Suñol A., Segrelles C., Carrasco E., Peral J., Garrido-Aranda A., Del Marro S., Ortiz J., Lorz C., et al. Development of a mouse model for spontaneous oral squamous cell carcinoma in Fanconi anemia. Oral Oncol. 2022;134:106184. doi: 10.1016/j.oraloncology.2022.106184. - DOI - PubMed
    1. Nalepa G., Clapp D.W. Fanconi anaemia and cancer: An intricate relationship. Nat. Rev. Cancer. 2018;18:168–185. doi: 10.1038/nrc.2017.116. - DOI - PubMed

LinkOut - more resources