

Chronotoxicity of Acrylamide in Mice Fed a High-Fat Diet: The Involvement of Liver CYP2E1 Upregulation and Gut Leakage
- PMID: 37446793
- PMCID: PMC10343525
- DOI: 10.3390/molecules28135132
Chronotoxicity of Acrylamide in Mice Fed a High-Fat Diet: The Involvement of Liver CYP2E1 Upregulation and Gut Leakage
Abstract
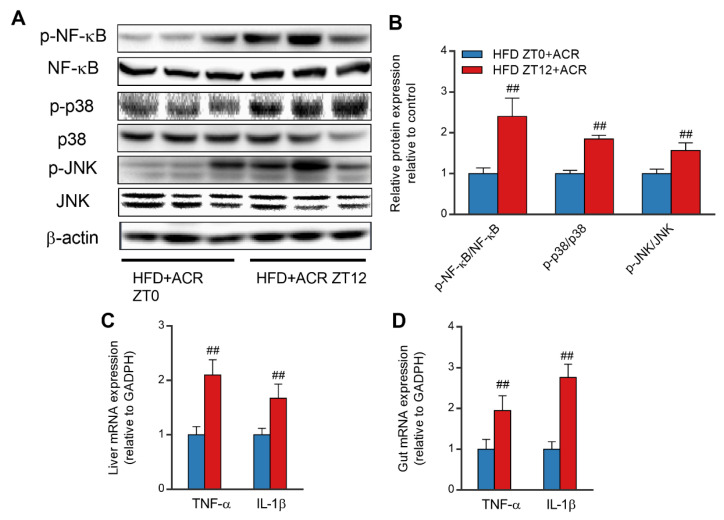
Acrylamide (ACR) is produced under high-temperature cooking of carbohydrate-rich foods via the Maillard reaction. It has been reported that ACR has hepatic toxicity and can induce liver circadian disorder. A high fat diet (HFD) could dysregulate liver detoxification. The current study showed that administration of ACR (100 mg/kg) reduced the survival rate in HFD-fed mice, which was more pronounced when treated during the night phase than during the day phase. Furthermore, ACR (25 mg/kg) treatment could cause chronotoxicity in mice fed a high-fat diet, manifested as more severe mitochondrial damage of liver during the night phase than during the day phase. Interestingly, HFD induced a higher CYP2E1 expressions for those treated during the night phase, leading to more severe DNA damage. Meanwhile, the expression of gut tight junction proteins also significantly decreases at night phase, leading to the leakage of LPSs and exacerbating the inflammatory response at night phase. These results indicated that a HFD could induce the chronotoxicity of ACR in mice liver, which may be associated with increases in CYP2E1 expression in the liver and gut leak during the night phase.
Keywords: CYP2E1; acrylamide; chronotoxicity; high-fat diet.
Conflict of interest statement
The authors declare no competing interest.
Figures


Similar articles
-
Acrylamide aggravates cognitive deficits at night period via the gut-brain axis by reprogramming the brain circadian clock.Arch Toxicol. 2019 Feb;93(2):467-486. doi: 10.1007/s00204-018-2340-7. Epub 2018 Oct 29. Arch Toxicol. 2019. PMID: 30374679
-
Hepatoprotective Effect of Seed Coat ofEuryale ferox Extract in Non-alcoholic Fatty Liver Disease Induced by High-fat Diet in Mice by Increasing IRs-1 and Inhibiting CYP2E1.J Oleo Sci. 2019 Jun 6;68(6):581-589. doi: 10.5650/jos.ess19018. Epub 2019 May 16. J Oleo Sci. 2019. PMID: 31092797
-
Role of CYP2E1 in the epoxidation of acrylamide to glycidamide and formation of DNA and hemoglobin adducts.Toxicol Sci. 2005 Dec;88(2):311-8. doi: 10.1093/toxsci/kfi307. Epub 2005 Sep 1. Toxicol Sci. 2005. PMID: 16141435
-
The genetic consequences of paternal acrylamide exposure and potential for amelioration.Mutat Res. 2015 Jul;777:91-100. doi: 10.1016/j.mrfmmm.2015.04.008. Epub 2015 Apr 17. Mutat Res. 2015. PMID: 25989052 Review.
-
Intestinal CYP2E1: A mediator of alcohol-induced gut leakiness.Redox Biol. 2014;3:40-6. doi: 10.1016/j.redox.2014.10.002. Epub 2014 Oct 19. Redox Biol. 2014. PMID: 25462064 Free PMC article. Review.
Cited by
-
Dietary Exposure to Acrylamide Has Negative Effects on the Gastrointestinal Tract: A Review.Nutrients. 2024 Jun 26;16(13):2032. doi: 10.3390/nu16132032. Nutrients. 2024. PMID: 38999779 Free PMC article. Review.
-
The antioxidant protective effect of resveratrol on long-term exposure to acrylamide-induced skeletal toxicity in female mice.Toxicol Res (Camb). 2024 Jul 18;13(4):tfae109. doi: 10.1093/toxres/tfae109. eCollection 2024 Aug. Toxicol Res (Camb). 2024. PMID: 39036523 Free PMC article.
-
Red Rice Seed Coat Targeting SPHK2 Ameliorated Alcoholic Liver Disease via Restored Intestinal Barrier and Improved Gut Microbiota in Mice.Nutrients. 2023 Sep 27;15(19):4176. doi: 10.3390/nu15194176. Nutrients. 2023. PMID: 37836459 Free PMC article.
-
Harnessing gold nanomaterials for advanced multicolor colorimetric biosensors in food hazards detection.J Food Drug Anal. 2024 Sep 13;32(3):274-295. doi: 10.38212/2224-6614.3511. J Food Drug Anal. 2024. PMID: 39636771 Free PMC article. Review.
References
-
- Song G., Liu Z., Liu Q., Liu X. Lipoic acid prevents acrylamide-induced neurotoxicity in CD-1 mice and BV2 microglial cells via maintaining redox homeostasis. J. Funct. Foods. 2017;35:363–375. doi: 10.1016/j.jff.2017.05.058. - DOI
MeSH terms
Substances
Grants and funding
LinkOut - more resources
Full Text Sources
