. 2023 Jul 4;28(13):5190.
doi: 10.3390/molecules28135190.

Broad-Spectrum, Potent, and Durable Ceria Nanoparticles Inactivate RNA Virus Infectivity by Targeting Virion Surfaces and Disrupting Virus-Receptor Interactions

Affiliations

Broad-Spectrum, Potent, and Durable Ceria Nanoparticles Inactivate RNA Virus Infectivity by Targeting Virion Surfaces and Disrupting Virus-Receptor Interactions

Candace R Fox et al. Molecules. .

Abstract

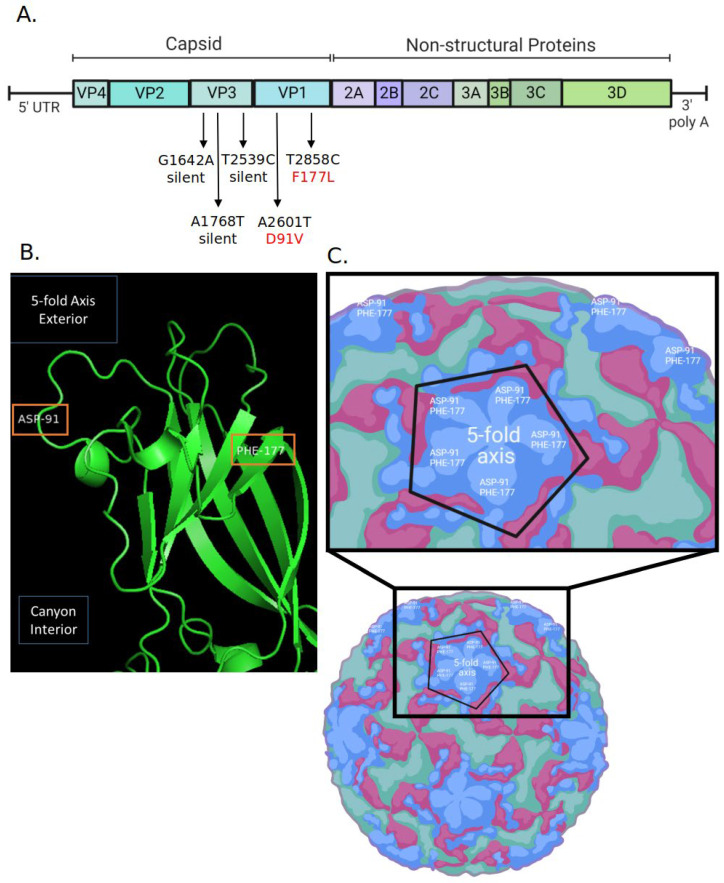
There is intense interest in developing long-lasting, potent, and broad-spectrum antiviral disinfectants. Ceria nanoparticles (CNPs) can undergo surface redox reactions (Ce3+ ↔ Ce4+) to generate ROS without requiring an external driving force. Here, we tested the mechanism behind our prior finding of potent inactivation of enveloped and non-enveloped RNA viruses by silver-modified CNPs, AgCNP1 and AgCNP2. Treatment of human respiratory viruses, coronavirus OC43 and parainfluenza virus type 5 (PIV5) with AgCNP1 and 2, respectively, prevented virus interactions with host cell receptors and resulted in virion aggregation. Rhinovirus 14 (RV14) mutants were selected to be resistant to inactivation by AgCNP2. Sequence analysis of the resistant virus genomes predicted two amino acid changes in surface-located residues D91V and F177L within capsid protein VP1. Consistent with the regenerative properties of CNPs, surface-applied AgCNP1 and 2 inactivated a wide range of structurally diverse viruses, including enveloped (OC43, SARS-CoV-2, and PIV5) and non-enveloped RNA viruses (RV14 and feline calicivirus; FCV). Remarkably, a single application of AgCNP1 and 2 potently inactivated up to four sequential rounds of virus challenge. Our results show broad-spectrum and long-lasting anti-viral activity of AgCNP nanoparticles, due to targeting of viral surface proteins to disrupt interactions with cellular receptors.

Keywords: anti-viral; coronavirus; disinfectant; nanoparticles; norovirus; parainfluenza; rhinovirus; virucidal.


Conflict of interest statement

C.D. commercialization of AgCNPs through Kismet Technologies.

Figures

Figure 1
Figure 1
Silver-modified nanoceria inactivates enveloped RNA viruses OC43 and PIV5 and disrupts receptor binding. (A) Reactions of OC43 were prepared with buffer or with 0.2 mg/mL of AgCNP1. After a 4 h incubation, remaining infectivity was quantified by TCID50 assay. A sample taken immediately upon the addition of nanoparticles is indicated as time zero. (B) PIV5 was incubated with buffer (blue line), 0.2 mg/mL AgCNP1 (green line), or 0.2 mg/mL AgCNP2 (red line) for 0, 2, 4, and 6 h. Remaining infectivity was determined by plaque assays. (C) OC43 was combined with 0, 0.02, 0.075, and 0.2 mg/mL AgCNP1, followed by assaying for hemagglutination activity with red blood cells to determine virus–receptor binding. The same concentrations of AgCNP1 incubated with red blood cells alone were included as control reactions (yellow bars). (D) Reactions of PIV5 were prepared with 0, 0.02, 0.075, and 0.2 mg/mL AgCNP2, and hemagglutination assays were performed. For all graphs, values are the mean of three independent samples, with error bars representing the standard deviation. Un denotes undetectable infectivity and **, and *** indicate p-values of <0.01, and <0.001, respectively, comparing untreated to indicated treatment.
Figure 2
Figure 2
Silver-modified nanoceria induces PIV5 and OC43 virion aggregation. (A) Possible outcomes of the sucrose gradient assay diagram. Virus layered on the top of the gradient (panel I) will migrate to a certain position in the sucrose gradient (example panel II), depending on virus type. Virion aggregates pellet to the bottom of the gradient (example panel III), whereas lysed or disrupted virions remain near the top of the gradient (example panel IV). (B) PIV5 virions were treated with buffer alone (top panel) or treated with 0.4 mg/mL AgCNP2 (bottom panel) for 4 h before loading onto pre-equilibrated sucrose gradients. After centrifugation, fractions were collected from the bottom of the tube and the pellet was resuspended. Samples were analyzed by western blotting for PIV5 viral protein P. (C) OC43 was treated with buffer alone (top panel) or treated with 0.6 mg/mL AgCNP1 (bottom panel). After 4 h incubation, reactions were centrifuged on sucrose gradients as described above for panel B, with fractions being analyzed by western blotting for OC43 viral protein NP. For both B and C, negative (−) and positive (+) cell lysate controls for western blotting were also analyzed. Respective cell lysate controls included H1299 cells either mock infected or infected with PIV5 (B) or H1299 cells either mock infected or infected with OC43 (C).
Figure 3
Figure 3
Selection for RV14 that has gained resistance to AgCNP2 inactivation. (A) Liquid solution reactions of RV14 were incubated at room temperature for 5 min or 2 h with buffer alone or with 0.3 mg/mL AgCNP2. Remaining infectivity was determined by TCID50 assay. (B) Schematic diagram of approach to generate AgCNP2-resistant RV14 by sequential rounds of partial inactivation with AgCNP2 as detailed in materials and methods, * indicates times 6 selection cycles. (C) Parental and AgCNP2-selected RV14 were incubated for 2 h with buffer alone, 0.1 mg/mL AgCNP2, or with 0.15 mg/mL AgCNP2. Infectivity was determined by TCID50 assay. For all graphs, values are the mean of three independent samples, with error bars representing the standard deviation. Un denotes undetectable and ns indicates no significance. * and ** indicate p-values of <0.05 and <0.01, respectively.
Figure 4
Figure 4
Predicted amino acid changes between parental and AgCNP2-resistant RV14 RNA map to the external surface of the RV14 capsid. (A) Schematic diagram of the RV14 genome, showing the location of nucleotide sequence differences between parental and AgCNP2-resistant RV14. Three of the five RNA sequence differences were found in the VP3 gene, but did not change the predicted coding of the AA. By contrast, 2 out of the 5 RNA sequence changes were in the VP1 gene and resulted in AA alterations F177L and D91V, as denoted in red. UTR: untranslated region. (B) The predicted tertiary amino acid ribbon structure of parental RV14 VP1 is shown with the location of the two amino acid changes between parental and AgCNP2-resistant RV14, shown with orange boxes. (C) A schematic of the RV14 virion showing the predicted location of the 5-fold axis with 5 copies of the aspartic acid 91 (ASP-91) and phenylalanine 177 (PHE-177) changes on the exterior surface of VP1.
Figure 5
Figure 5
Surface-dried silver-modified nanoceria inactivates enveloped RNA viruses OC43, SARS-CoV-2, and PIV5. (AC) Glass slides were left uncoated (blue bars) or coated with 0.1 mg of either AgCNP1 (green bars) or AgCNP2 (red bars) and then dried. Slides were inoculated with the indicated doses of the individual viruses OC43 (A), SARS-CoV-2 (B), and PIV5 (C), and virus was either recovered immediately after inoculation (time zero, black bars) or incubated at room temperature for two hrs. Remaining infectious virus was recovered from the slides and quantified by either TCID50 assay (OC43) or plaque assay (SARS-CoV-2, PIV5). Values are the mean of three independent samples, with error bars representing the standard deviation. * and *** indicate p-values of <0.05 and <0.001, respectively, comparing untreated to indicated treatment.
Figure 6
Figure 6
A single coating of AgCNP2 can inactivate multiple rounds of RV14 re-challenge. (A) Slides were left uncoated or coated with 0.1 mg of either AgCNP1 or AgCNP2 and then dried. Slides were inoculated with 5 × 10⁴ TCID50 units of RV14 and incubated at room temperature for two hrs. Remaining infectious virus was recovered from the slides and quantified by TCID50 assay. (B) Slides were left uncoated or coated with 0.0425 mg of AgCNP2 and dried. Slides were challenged with 5 × 10⁵ TCID50 units of RV14, and remaining infectivity on slides after 15, 30, 60, and 120 min was determined by TCID50 assays. (C) Media and slide surfaces collected after 2 h incubation were treated with protein lysis buffer and samples were analyzed by western blotting for RV14 viral protein VP3. (D) Sets of slides were left uncoated or treated with 0.1 mg of AgCNP2 and dried. Approximately 1 × 10⁶ TCID50 units of RV14 were applied to all slides as denoted by the cartoon viruses and arrows. One set of slides was processed immediately upon RV14 application (time zero). After 2 h incubation, a second set of slides was processed and associated RV14 infectivity was determined by TCID50 assay. The third set of unprocessed slides received a new re-application challenge with ~1 × 10⁶ TCID50 units of RV14. Slides processed immediately upon the second application of RV14 are indicated. Slides were then incubated for an additional 2 h, processed, and remaining RV14 infectivity on the slides was quantified and expressed as the 4 h time point. (E) Slides were treated and challenged with RV14 for 2 rounds as described in panel (D) (not shown, but indicated by arrows). At 4 h, slides were processed and remaining infectious RV14 was determined. Slides were further re-challenged a third and a fourth time with approximately 1 × 10⁶ TCID50 units of RV14, with incubation times after each challenge of an additional 2 h, followed by processing and quantifying remaining RV14 infectivity. For all figures, values are the mean of three independent samples, with error bars representing the standard deviation. * and ** indicate p-values of <0.05 and <0.01, respectively, comparing untreated to indicated treatment.
Figure 7
Figure 7
A single coating of AgCNP1 completely inactivates four sequential rounds of FCV challenge. (A) Slides were left uncoated or coated with 0.1 mg of either AgCNP1 or AgCNP2 and then dried. Slides were inoculated with 5 × 10⁵ of FCV and incubated at room temperature for two hr. Remaining infectious virus was recovered from the slides and quantified by plaque assay. (B,C) Slides were left uncoated or coated with 0.1 mg AgCNP1 and dried. Approximately 8 × 10⁴ PFU of FCV was applied to the slides and incubated for 0 and 15 min (B) or 30 and 60 min (C). After the indicated incubation time, slides were washed, vortexed in media, and remaining infectious FCV was quantified. (D) Three sets of slides were left uncoated or coated with 0.1 mg AgCNP1. After drying, ~1 × 10⁵ PFU of FCV was applied to the slides as denoted by the cartoon virus and arrow and incubated for 30 min. Slides were then challenged with a second round of FCV and incubated for an additional 30 min. One set of slides was processed, remaining infectious FCV was quantified by plaque assay, and data are expressed as the 60 min time point. The second set of unprocessed slides were challenged for a third time with FCV and slides were immediately processed and expressed as 60 min. Slides were incubated for an additional 30 min, followed by processing, and infectious FCV was determined and expressed as the 90 min time point. Slides were then re-challenged for a fourth time with FCV and slides were immediately processed and expressed as 120 min time point. Values are the mean of three independent samples, with error bars representing the standard deviation. *, **, and *** indicate p-values of <0.05, <0.01, and <0.001, respectively, comparing untreated to indicated treatment.
Figure 8
Figure 8
AgCNP2-coated slides inactivate both FCV and RV14 in a mixed virus inoculum as effectively as in individual virus challenges. (A,B) Three sets of slides were left uncoated or coated with 0.1 mg AgCNP2 and dried. One set of slides was challenged individually with ~5 × 10⁴ PFU of FCV, and a second set was challenged individually with ~1 × 10⁵ TCID50 units of RV14. A third slide set received a mixed inoculum of both FCV and RV14 at the above doses. After 2 h at room temperature, slides were vortexed in media and remaining infectious virus was collected. FCV titers were determined by plaque assay on CRFK which do not support RV14 infections. Remaining RV14 infectivity was determined by TCID50 assays on HeLa cells which do not support FCV infections. Individual FCV- and RV14-only virus controls were performed as single samples. Mixed inoculum values are the mean of three independent samples, with error bars representing the standard deviation. Un denotes undetectable and ** indicates p-value < 0.01 comparing untreated to indicated treatment.

Similar articles

Cited by

References

    1. Fendrick A.M., Monto A.S., Nightengale B., Sarnes M. The economic burden of non-influenza-related viral respiratory tract infection in the United States. Arch. Intern. Med. 2003;163:487–494. doi: 10.1001/archinte.163.4.487. - DOI - PubMed
    1. Knipe D.M., Howley P. Fields Virology. Volumes 1 and 2 LWW; Philadelphia, PA, USA: 2013.
    1. Lin Q., Lim J.Y.C., Xue K., Yew P.Y.M., Owh C., Chee P.L., Loh X.J. Sanitizing agents for virus inactivation and disinfection. View (Beijing) 2020;1:e16. doi: 10.1002/viw2.16. - DOI - PMC - PubMed
    1. Perry K.A., Coulliette A.D., Rose L.J., Shams A.M., Edwards J.R., Noble-Wang J.A. Persistence of Influenza A (H1N1) Virus on Stainless Steel Surfaces. Appl. Environ. Microbiol. 2016;82:3239–3245. doi: 10.1128/AEM.04046-15. - DOI - PMC - PubMed
    1. Ikonen N., Savolainen-Kopra C., Enstone J.E., Kulmala I., Pasanen P., Salmela A., Salo S., Nguyen-Van-Tam J.S., Ruutu P., PANDHUB consortium Deposition of respiratory virus pathogens on frequently touched surfaces at airports. BMC Infect. Dis. 2018;18:437. doi: 10.1186/s12879-018-3150-5. - DOI - PMC - PubMed