. 2023 Jun 23;12(13):2422.
doi: 10.3390/plants12132422.

The Sweet Potato K+ Transporter IbHAK11 Regulates K+ Deficiency and High Salinity Stress Tolerance by Maintaining Positive Ion Homeostasis

Affiliations

The Sweet Potato K+ Transporter IbHAK11 Regulates K+ Deficiency and High Salinity Stress Tolerance by Maintaining Positive Ion Homeostasis

Hong Zhu et al. Plants (Basel). .

Abstract

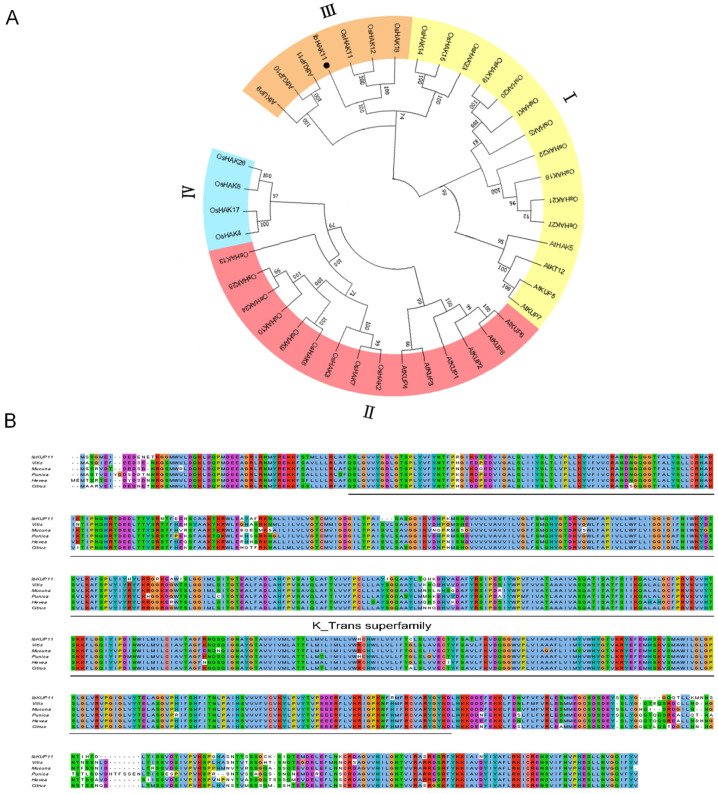
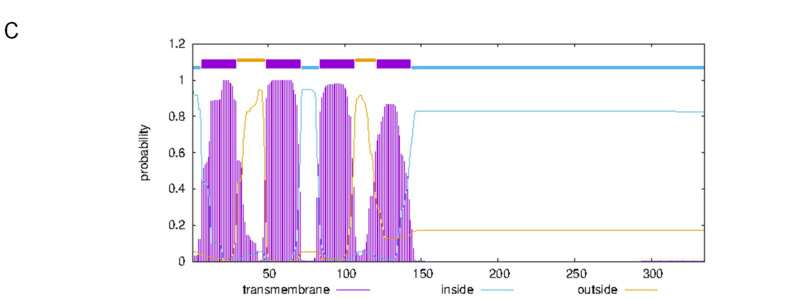
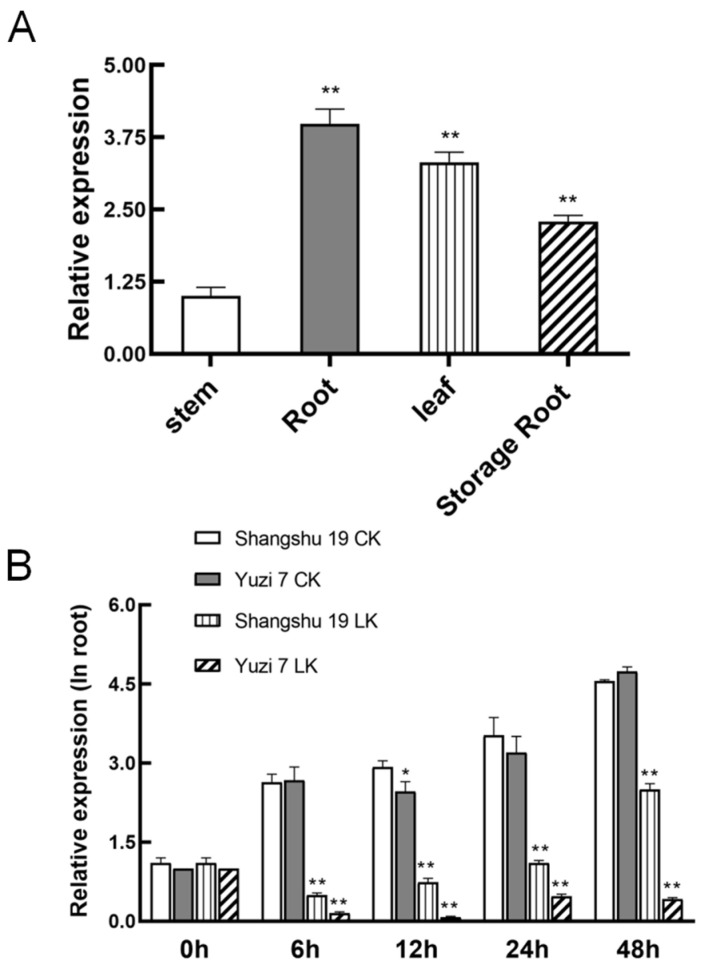
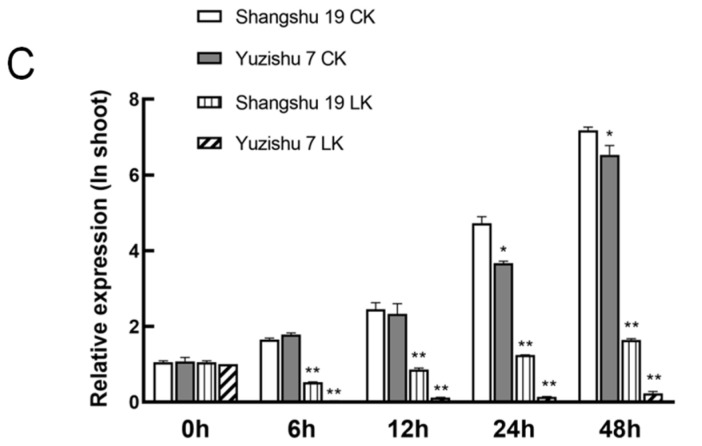
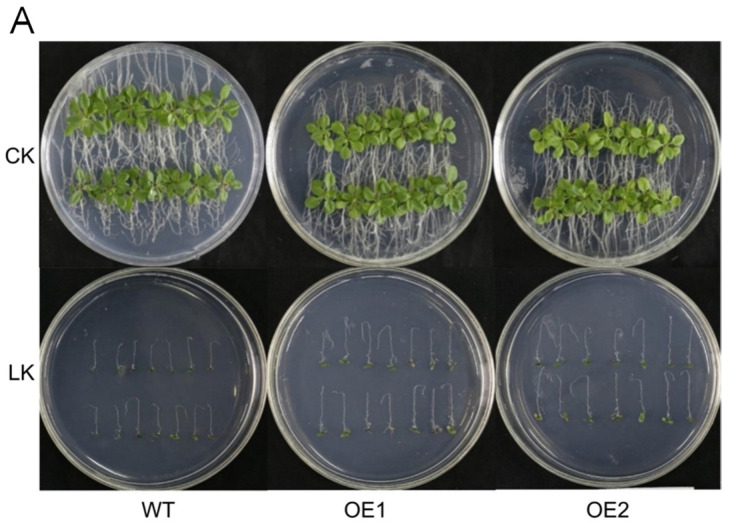
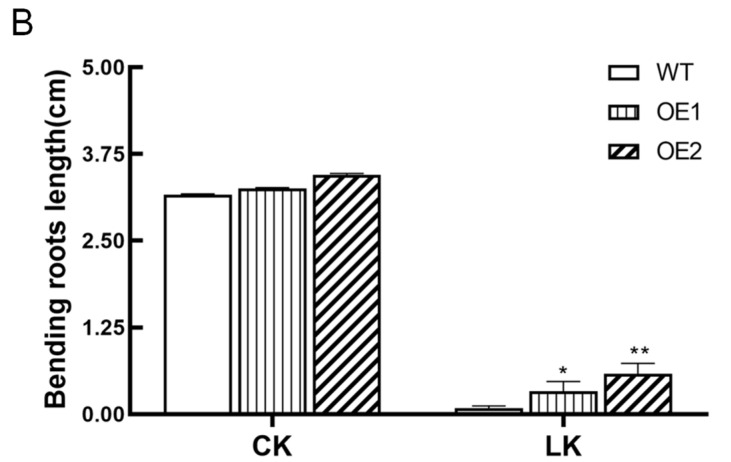
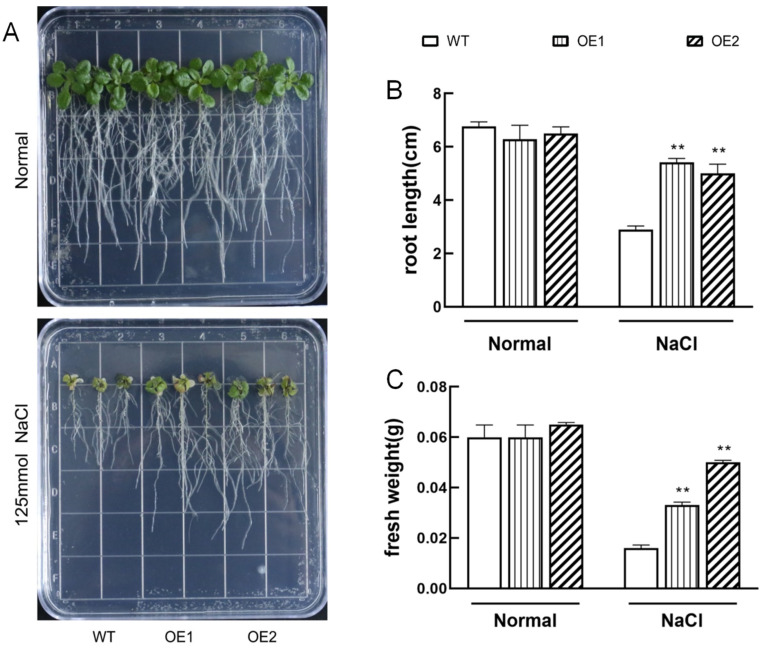
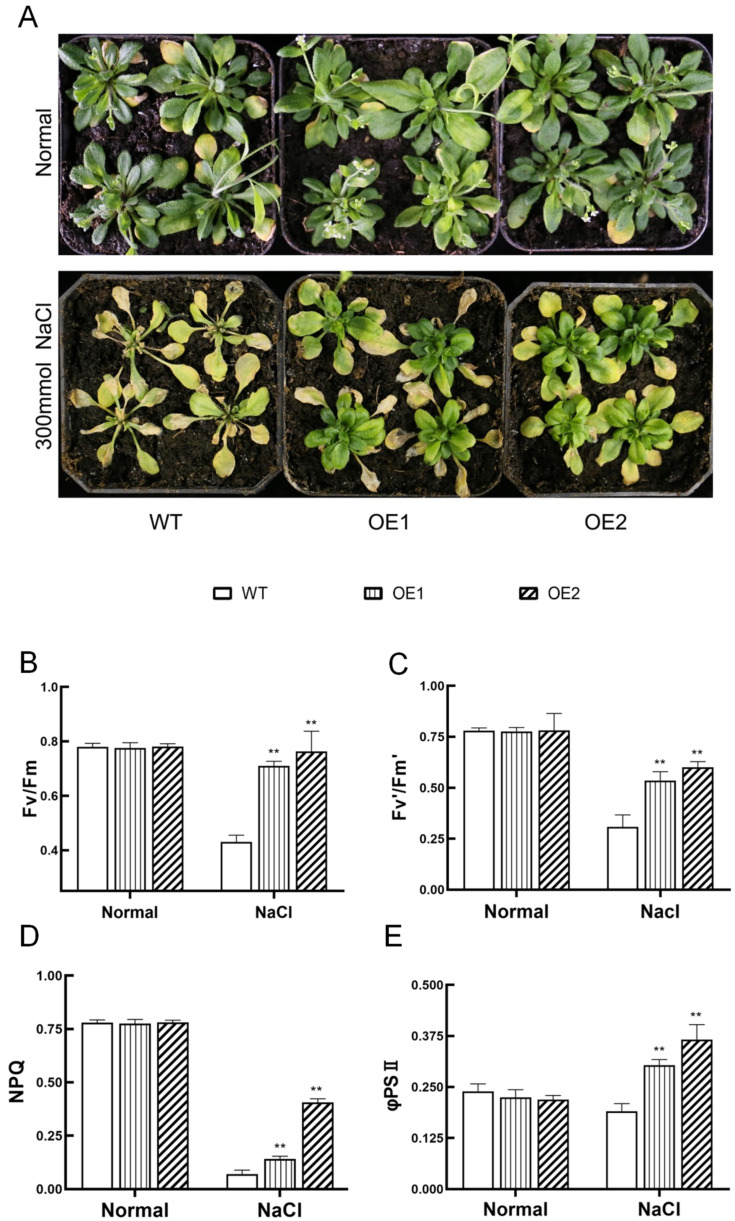
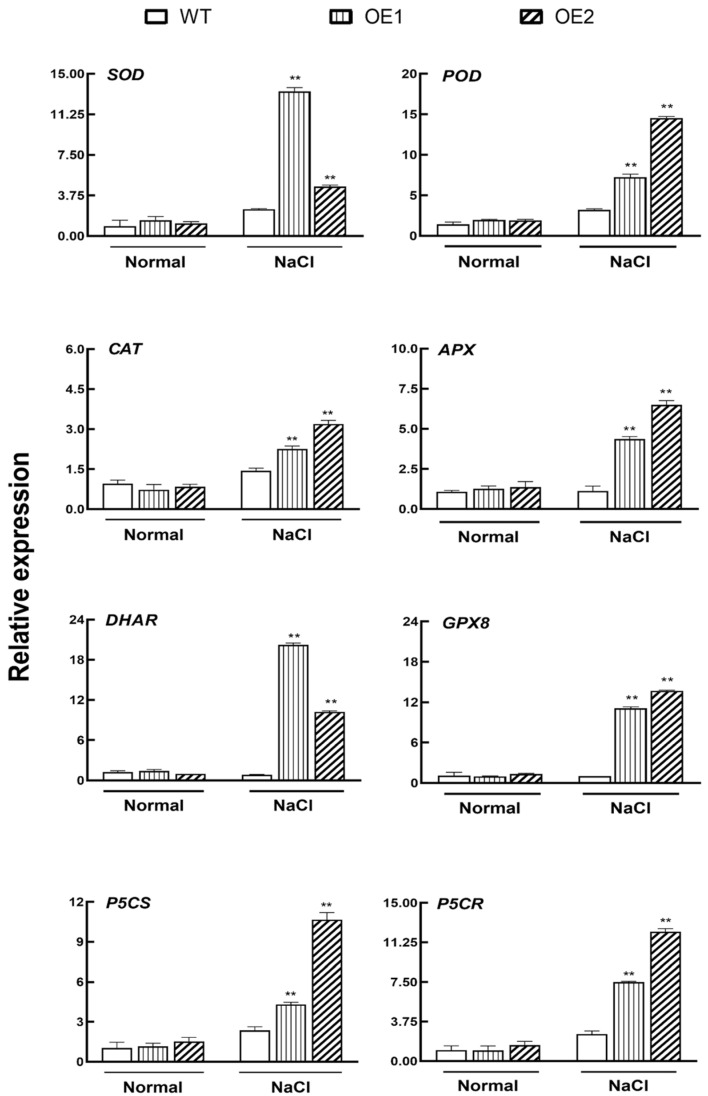
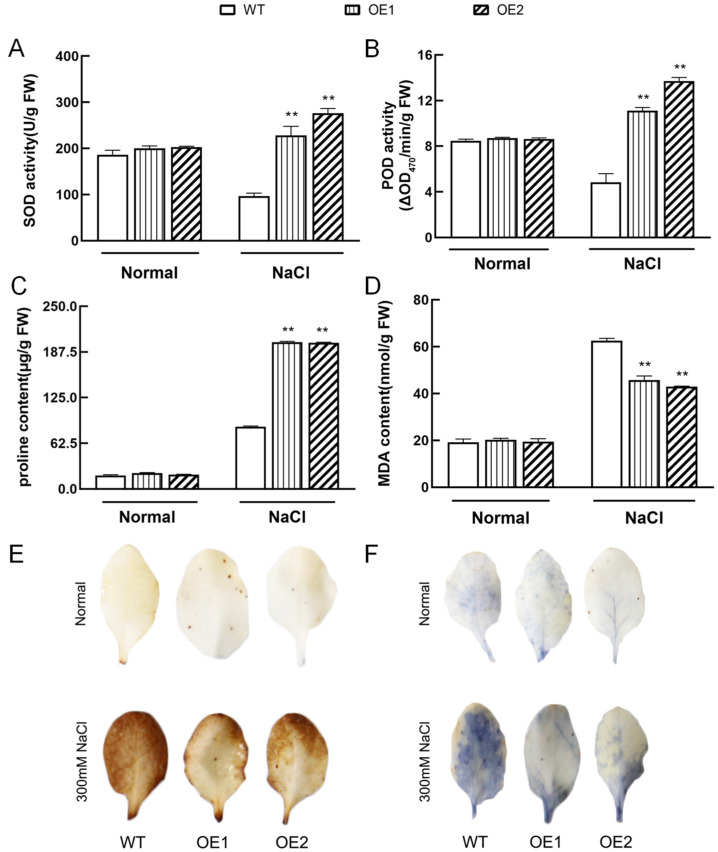
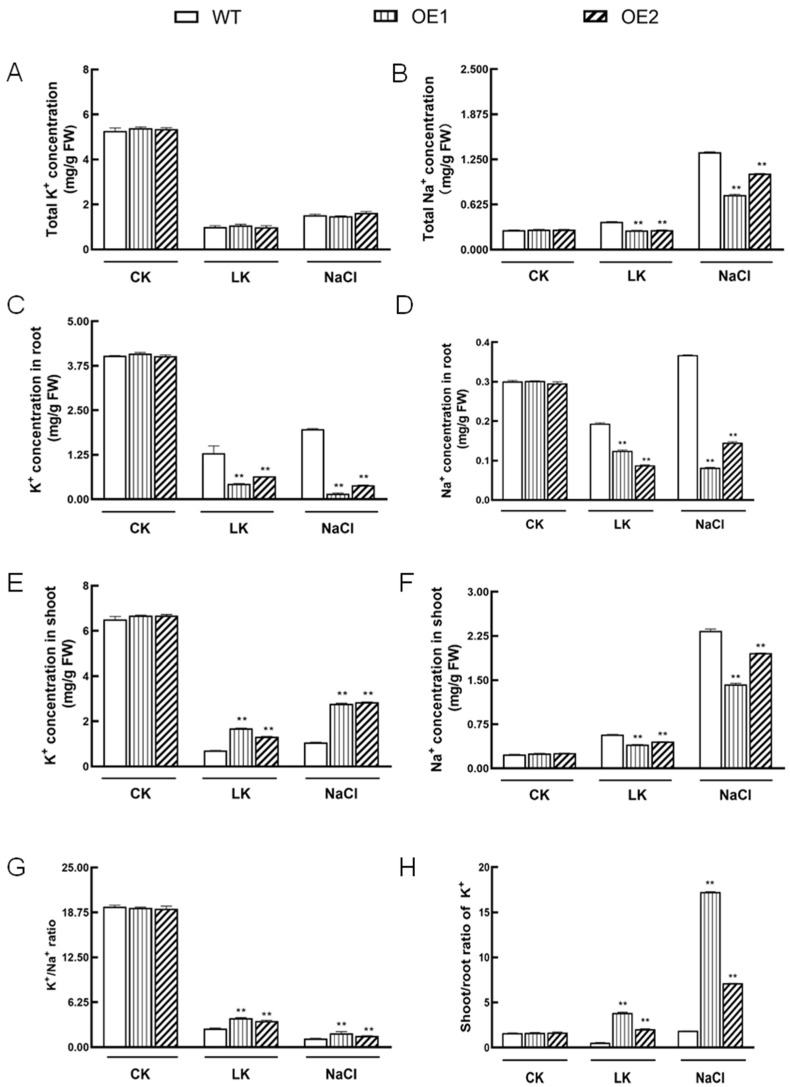
The K+ transporter KT/HAK/KUP (K+ transporter/high-affinity K+/K+ uptake) family has a critical effect on K+ uptake and translocation in plants under different environmental conditions. However, the functional analysis of KT/HAK/KUP members in sweet potatoes is still limited. The present work reported the physiological activity of a new gene, IbHAK11, in the KT/HAK/KUP family in sweet potatoes. IbHAK11 expression increased significantly in the low K+-tolerant line compared with the low K+-sensitive line following treatment with low K+ concentrations. IbHAK11 upregulation promoted root growth in Arabidopsis under low K+ conditions. Under high saline stress, transgenic lines had superior growth and photosynthetic characteristics compared with the wild-type (WT). As for IbHAK11-overexpressing plants, activation of both the non-enzymatic and enzymatic reactive oxygen species (ROS) scavenging systems was observed. Therefore, IbHAK11-overexpressing plants had lower malondialdehyde (MDA) and ROS levels (including H2O2 and O2-) compared with WT under salt-induced stress. We also found that under both low K+ and high salinity conditions, overexpression of IbHAK11 enhanced K+ translocation from the root to the shoot and decreased Na+ absorption in Arabidopsis. Consequently, IbHAK11 positively regulated K+ deficiency and high salinity stresses by regulating K+ translocation and Na+ uptake, thus maintaining K+/Na+ homeostasis in plants.

Keywords: IbHAK11; K+ deficiency tolerance; K+ transporter; K+/Na+ homeostasis; high salinity tolerance; sweet potato.


Conflict of interest statement

The authors declare no conflict of interest.

Figures

Figure 1
Figure 1
Phylogenetic and amino acid sequence analysis of IbHAK11. (A) Phylogenetic analysis of IbHAK11, 13 KT/HAK/KUP members from Arabidopsis and 27 KT/HAK/KUP members from rice. (B) Alignment of IbHAK11 amino acid sequence against NCBI-derived homologs. (C) Transmembrane domain prediction in IbHAK11.
Figure 1
Figure 1
Phylogenetic and amino acid sequence analysis of IbHAK11. (A) Phylogenetic analysis of IbHAK11, 13 KT/HAK/KUP members from Arabidopsis and 27 KT/HAK/KUP members from rice. (B) Alignment of IbHAK11 amino acid sequence against NCBI-derived homologs. (C) Transmembrane domain prediction in IbHAK11.
Figure 2
Figure 2
Analysis of IbHAK11 expression. (A) Expression profiles of IbHAK11 in different tissues. Expression patterns of IbHAK11 in (B) roots and (C) shoots following treatment with low or normal K+ concentrations. Results are presented as mean ± SE (n = 3). * p < 0.05 and ** p < 0.01 represent statistical significance.
Figure 2
Figure 2
Analysis of IbHAK11 expression. (A) Expression profiles of IbHAK11 in different tissues. Expression patterns of IbHAK11 in (B) roots and (C) shoots following treatment with low or normal K+ concentrations. Results are presented as mean ± SE (n = 3). * p < 0.05 and ** p < 0.01 represent statistical significance.
Figure 3
Figure 3
Responses in WT and transgenic seedlings cultivated under low K+ and normal conditions for 10 days. (A) WT and transgenic plant phenotypes. (B) Bending root lengths in WT and transgenic plants. Results are presented as mean ± SE (n = 3). * p < 0.05 and ** p < 0.01 represent statistical significance.
Figure 3
Figure 3
Responses in WT and transgenic seedlings cultivated under low K+ and normal conditions for 10 days. (A) WT and transgenic plant phenotypes. (B) Bending root lengths in WT and transgenic plants. Results are presented as mean ± SE (n = 3). * p < 0.05 and ** p < 0.01 represent statistical significance.
Figure 4
Figure 4
Responses in WT and transgenic seedlings cultivated for 15 days in 1/2 MS medium in the absence of stress or in the presence of 125 mM NaCl. (A) Morphologies of WT and transgenic lines. (B) Primary root lengths. (C) Fresh weight. Results are presented as mean ± SE (n = 3). ** p < 0.01 represents statistical significance.
Figure 5
Figure 5
Responses in WT and transgenic lines cultured in pots under high-salinity and normal conditions. (A) Morphologies of plants exposed to different conditions. Plant photosynthetic parameters such as (B) Fv/Fm, (C) Fv’/Fm’, (D) NPQ and (E) φPSII. Results are presented as mean ± SE (n = 3). ** p < 0.01 represent statistical significance.
Figure 6
Figure 6
Expression of ROS scavenging-related gene transcripts in WT and transgenic lines. Results are presented as mean ± SE (n = 3). ** p < 0.01 represents statistical significance.
Figure 7
Figure 7
Expression of ROS scavenging-related gene transcripts in WT and transgenic lines. (A) SOD activity. (B) POD activity. (C) Proline levels. (D) MDA levels. Results are presented as mean± SD (n = 3). ** p < 0.01 represents statistical significance in WT plants compared with transgenic plants. (E) DAB and (F) NBT staining of leaf samples following exposure to normal and high salinity conditions.
Figure 8
Figure 8
K+ and Na+ concentrations in WT and transgenic lines following exposure to normal, low K+ and high salinity conditions. K+ (A) and Na+ (B) contents in entire plantlets. K+ (C) and Na+ (D) contents in roots. K+ (E) and Na+ (F) contents in shoots. K+/Na+ ratio (G) in all plants. Shoot/root K+ ratio (H). The results are presented as mean ± SD (n = 3). ** p < 0.01 represents statistical significance in WT plants compared with transgenic plants.

Similar articles

References

    1. Gong Z., Xiong L., Shi H., Yang S., Herrera-Estrella L.R., Xu G., Chao D., Li J., Wang P.Y., Qin F., et al. Plant abiotic stress response and nutrient use efficiency. Sci. China Life Sci. 2020;63:635–674. doi: 10.1007/s11427-020-1683-x. - DOI - PubMed
    1. Kumari P., Rastogi A., Yadav S. Effects of Heat stress and molecular mitigation approaches in orphan legume, Chickpea. Mol. Biol. Rep. 2020;47:4659–4670. doi: 10.1007/s11033-020-05358-x. - DOI - PubMed
    1. Kul R. Integrated application of plant growth promoting rhizobacteria and biochar improves salt tolerance in eggplant seedlings. Turk. J. Agric. For. 2022;46:677–702. doi: 10.55730/1300-011X.3035. - DOI
    1. Addique M., Kausar A., Iqra I., Akhter N., Mujahid N., Parveen A., Zaman Q., Hussain S. Amino acids application alleviated salinity stress in spinach (Spinacia oleracea L.) by improving oxidative defense, osmolyte accumulation, and nutrient balance. Turk. J. Agric. For. 2022;46:875–887. doi: 10.55730/1300-011X.3049. - DOI
    1. Zhu J. Abiotic stress signaling and responses in plants. Cell. 2016;167:313–324. doi: 10.1016/j.cell.2016.08.029. - DOI - PMC - PubMed