. 2023 Jun 25;12(13):2442.
doi: 10.3390/plants12132442.

Photosynthesis in the Biomass Model Species Lemna minor Displays Plant-Conserved and Species-Specific Features

Affiliations

Photosynthesis in the Biomass Model Species Lemna minor Displays Plant-Conserved and Species-Specific Features

Monique Liebers et al. Plants (Basel). .

Abstract

Lemnaceae are small freshwater plants with extraordinary high growth rates. We aimed to test whether this correlates with a more efficient photosynthesis, the primary energy source for growth. To this end, we compared photosynthesis properties of the duckweed Lemna minor and the terrestrial model plant Arabidopsis thaliana. Chlorophyll fluorescence analyses revealed high similarity in principle photosynthesis characteristics; however, Lemna exhibited a more effective light energy transfer into photochemistry and more stable photosynthesis parameters especially under high light intensities. Western immunoblot analyses of representative photosynthesis proteins suggested potential post-translational modifications in Lemna proteins that are possibly connected to this. Phospho-threonine phosphorylation patterns of thylakoid membrane proteins displayed a few differences between the two species. However, phosphorylation-dependent processes in Lemna such as photosystem II antenna association and the recovery from high-light-induced photoinhibition were not different from responses known from terrestrial plants. We thus hypothesize that molecular differences in Lemna photosynthesis proteins are associated with yet unidentified mechanisms that improve photosynthesis and growth efficiencies. We also developed a high-magnification video imaging approach for Lemna multiplication which is useful to assess the impact of external factors on Lemna photosynthesis and growth.

Keywords: Arabidopsis thaliana; Lemna minor; photoinhibition; photosynthesis; photosystem antenna; post-translational modifications.


Conflict of interest statement

The authors declare no conflict of interest.

Figures

Figure 1
Figure 1
Imaging of Lemna minor growth characteristics in sugar-free liquid medium. (A) Sterile mass pre-culture of Lemna minor cultivated in flasks with standard growth medium. (BLemna minor fronds from exponential growth phase placed in vessel for detection of Chl fluorescence from top. (C) Set-up for time lapse movies recording Lemna minor growth. M: Objective of the digital microscope; L: Cold-white light source (D) Time series of growth of Lemna minor fronds taken by a digital microscope with automatic z-axis zoom and software-based image construction. Red scale bar in bottom right corner of images represents 1 mm. White arrows indicate the stalk connecting mother and daughter fronds. The complete time lapse video of this series is available in the supplement. (E) Growth curves of Lemna minor in sugar-free liquid medium determined as determined by the increase in leaf area detected in the time lapse video. The growth follows an exponential function (function of exponential regression: f(x) = 16.477e0.0125x). The inset in the upper left corner displays a semi-logarhythmic representation. ption.
Figure 2
Figure 2
Photosynthesis characteristics of Lemna minor in comparison to Arabidopsis thaliana. Detection of Chl fluorescence in standard light quenching analyses of dark-adapted plants upon illumination using a Junior-PAM device operating in the saturation pulse mode. (A) Measurements in 90 µmol photons m−2 s−1 of actinic light. (B) Measurements in 285 µmol photons m−2 s−1 of actinic light. Fluorescence (F) is given in arbitrary units (rel. units). For direct comparison, fluorescence values of Arabidopsis thaliana at initiation of measurement were normalized to corresponding values of Lemna minor. Peaks in the records indicate maximal fluorescence upon application of saturation light pulses. Light and dark phases of actinic illumination are indicated on the top by white and black bars, the corresponding time scale is given on the bottom. The first 25 min of dark adaptation are not shown. One representative curve for each plant is given. For biological variations of parameters see Figure 3. Blue traces: Chl fluorescence of Lemna minor (L.m.). Red traces: Chl fluorescence of Arabidopsis thaliana (A.t.). Fm: Maximal fluorescence in the dark; Fm’: Maximal fluorescence in the light; Ft: Fluorescence in dependency of time t; Fs: Steady state fluorescence. For details see text.
Figure 3
Figure 3
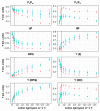
Comparison of photosynthesis parameters of Lemna minor and Arabidopsis thaliana under increasing actinic light intensities. Chl fluorescence of plants grown under identical light intensities was detected and analyzed with a Junior-PAM device as shown in Figure 2. Plants were measured consecutively in increasing actinic light intensities (given on the bottom). Dashed lines mark the growth light intensity. Identities of calculated photosynthesis parameters are indicated on the top of each graph, fluorescence is given in arbitrary units (left margin). Blue traces: Chl fluorescence of Lemna minor. Red traces: Chl fluorescence of Arabidopsis thaliana. For further details see text.
Figure 4
Figure 4
Comparison of total and photosynthesis proteins from Arabidopsis thaliana and Lemna minor. (A) SDS gel (12%) electrophoresis of total protein extracts isolated from white-light-grown plants (identities indicated on the top) stained with Coomassie. Marker (M) sizes are given in kDa in the right panel. (B) Western immunoblot analyses of selected photosynthesis proteins. Protein identities are indicated in the left margin using both gene-based and common (in parentheses) abbreviations, apparent molecular weight is given in the right margin. Loading of gel lanes was conducted as shown in A. Equality of loading was checked by Ponceau S staining of the membrane before immuno detection.
Figure 5
Figure 5
Phosphorylation state of thylakoid membrane proteins of Lemna minor in comparison to Arabidopsis thaliana. Protein amounts corresponding to 1 µg chlorophyll were separated by SDS PAGE and transferred to a nitrocellulose membrane via Western blot. The membranes were incubated with anti-phospho-threonine antibodies to detect phosphorylated thylakoid membrane proteins using enhanced chemiluminescence (ECL). Signal detection was conducted for 7 s (left panel, short) or 1 min (middle panel, long). Equal protein loading was tested by amido black staining of the membrane after ECL detection (loading, right panel). Sizes of marker proteins are given in the right margin in kDa. Phosphorylated LHCII and PSII core proteins are indicated in the right margin, differences in the phosphorylation signals arrows are indicated by arrows in the left margin.
Figure 6
Figure 6
77K fluorescence spectra of Lemna minor. Lemna minor fronds were analyzed for Chl fluorescence emission in the range of 650–850 nm excitation in liquid nitrogen. Measured plant materials were harvested at the end of the dark phase of the growth light regime or 50 min after the onset of white-light illumination. All spectra were normalized to the fluorescence emission peak at 686 nm. (A) Representative spectra for both conditions. (B) Mean ratio of the fluorescence emission peaks at 735 and 686 nm (F735/F686) obtained from three independent replicates. SD is given.
Figure 7
Figure 7
Recovery of photosynthesis in Lemna minor and Arabidopsis thaliana after high-light treatment. Lemna minor (L.m.) and Arabidopsis thaliana (A.t.) were exposed to high light (HL) (1800 µmol m−2 s−1 PPFD) and tested for recovery from photoinhibition. Note that this setup is different from the light intensity treatment given in Figure 3. (A,B) Representative images of the Fv/Fm values recorded before (A, reference) and directly after (B) high-light (HL) treatment. Duration of illumination for the HL treatment is indicated by the numbers in B. Fv/Fm values are color-coded from black indicating Fv/Fm = 0 to purple indicating Fv/Fm = 1 (see color gradient bar below the images). (C) Duration of HL stress is indicated on the x-axis beginning with the strongest stress. Fv/Fm was measured before the HL treatment (as reference) and immediately (0 h, black bars), 2 h (light grey bars) and 19 h (dark grey bars) after return to growth light intensity. Recovery (rec. %) is expressed relative to the reference Fv/Fm measured on an individual leaf/frond base. Results are averages of three biological independent replicates. Small black vertical bars indicate the standard error of the mean (SEM).

References

    1. Bog M., Appenroth K.-J., Sree K.S. Duckweed (Lemnaceae): Its Molecular Taxonomy. Front. Sustain. Food Syst. 2019;3:117. doi: 10.3389/fsufs.2019.00117. - DOI
    1. Ziegler P., Adelmann K., Zimmer S., Schmidt C., Appenroth K.-J. Relative in vitro growth rates of duckweeds (Lemnaceae)—The most rapidly growing higher plants. Plant Biol. 2014;17:33–41. doi: 10.1111/plb.12184. - DOI - PubMed
    1. Acosta K., Appenroth K.J., Borisjuk L., Edelman M., Heinig U., Jansen M.A.K., Oyama T., Pasaribu B., Schubert I., Sorrels S., et al. Return of the Lemnaceae: Duckweed as a model plant system in the genomics and postgenomics era. Plant Cell. 2021;33:3207–3234. doi: 10.1093/plcell/koab189. - DOI - PMC - PubMed
    1. Baek G., Saeed M., Choi H.-K. Duckweeds: Their utilization, metabolites and cultivation. Appl. Biol. Chem. 2021;64:73. doi: 10.1186/s13765-021-00644-z. - DOI - PMC - PubMed
    1. Demmig-Adams B., López-Pozo M., Polutchko S.K., Fourounjian P., Stewart J.J., Zenir M.C., Adams W.W., III Growth and Nutritional Quality of Lemnaceae Viewed Comparatively in an Ecological and Evolutionary Context. Plants. 2022;11:145. doi: 10.3390/plants11020145. - DOI - PMC - PubMed

LinkOut - more resources