

On the Possible Trade-Off between Shoot and Root Biomass in Wheat
- PMID: 37447071
- PMCID: PMC10346711
- DOI: 10.3390/plants12132513
On the Possible Trade-Off between Shoot and Root Biomass in Wheat
Abstract
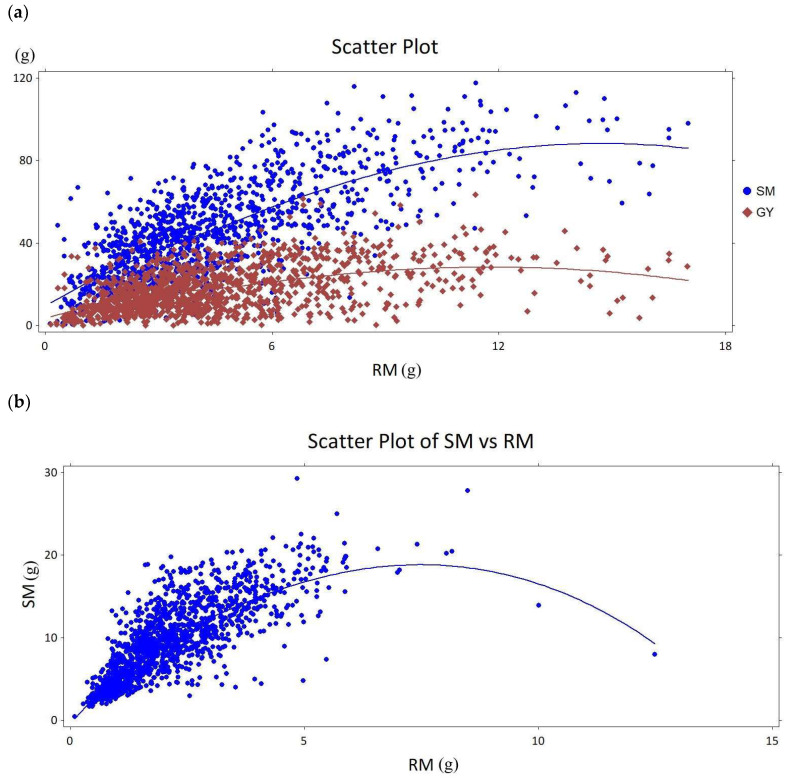
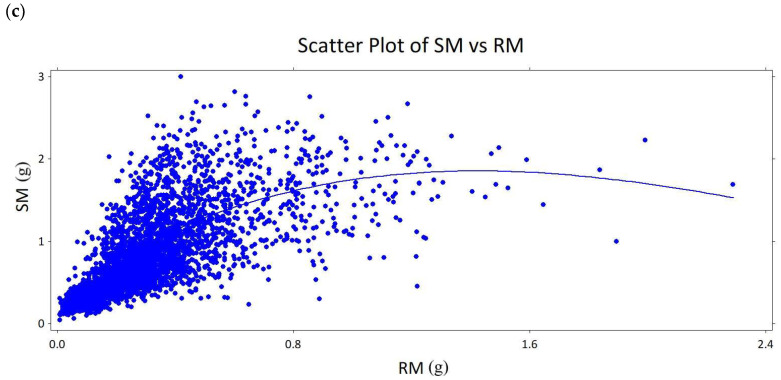
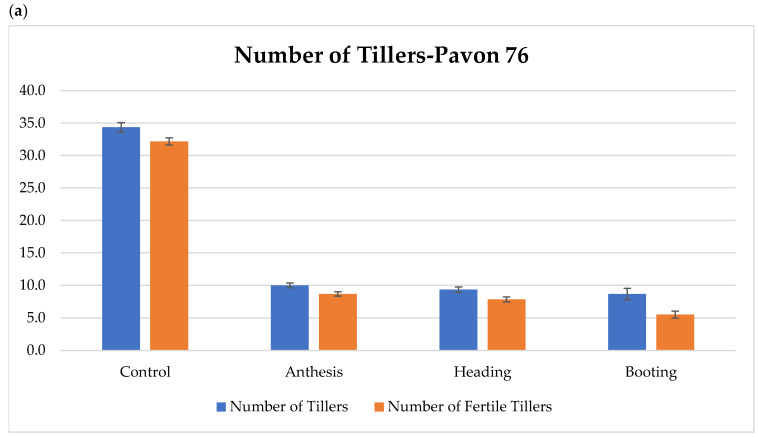
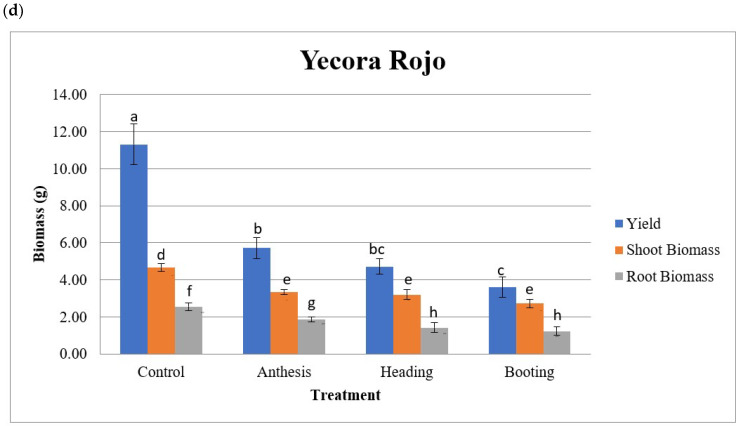
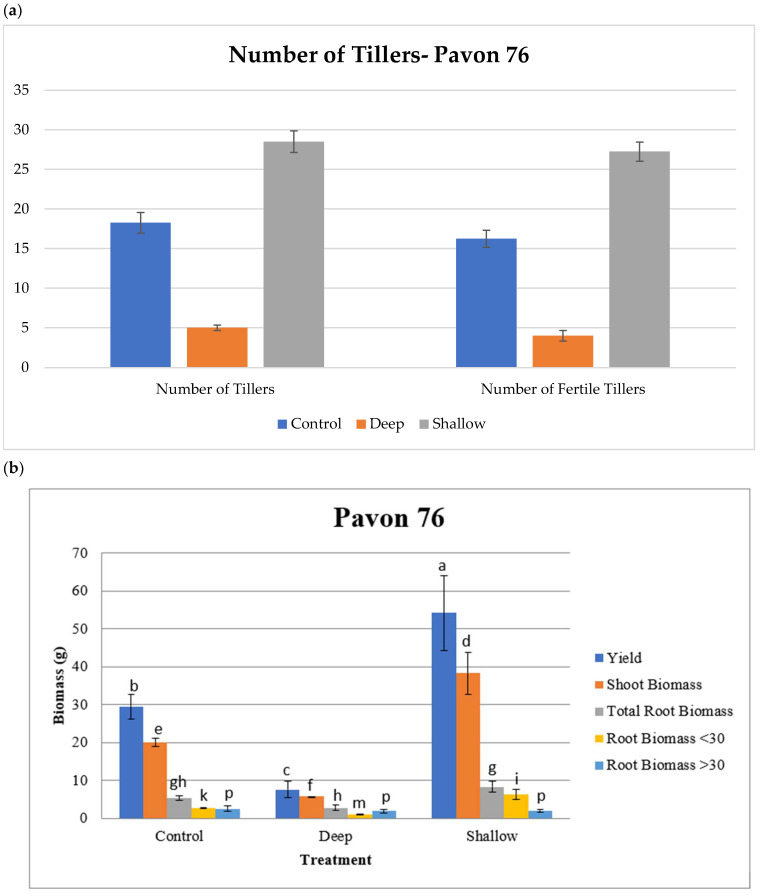
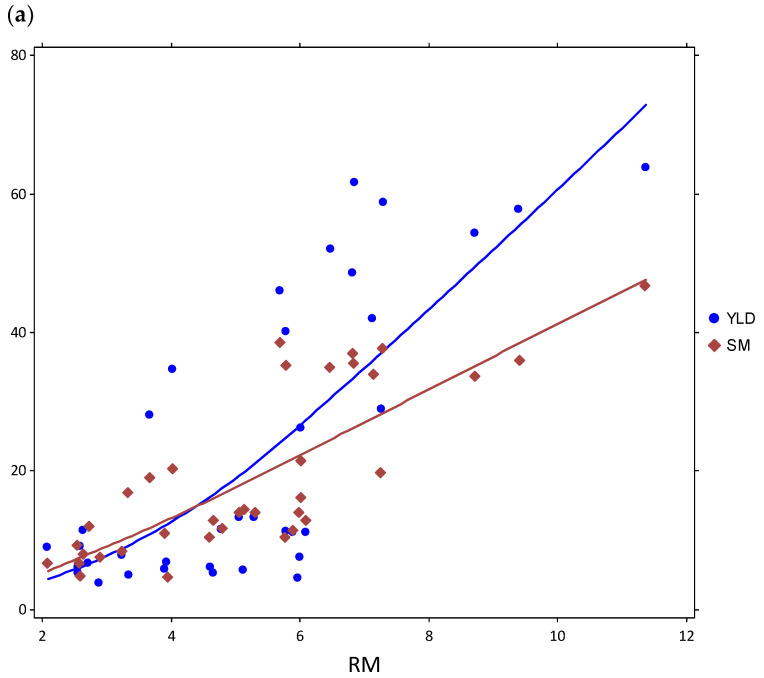
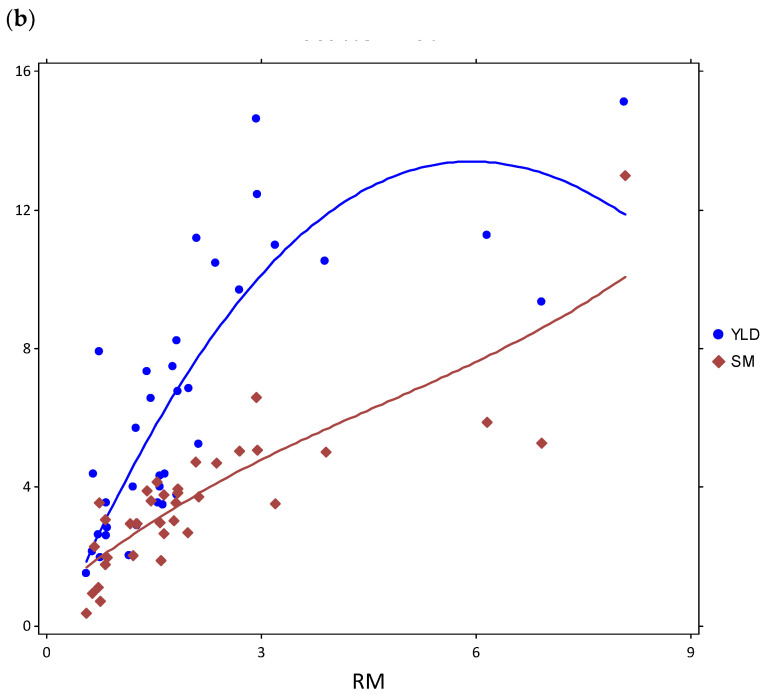
Numerous studies have shown that under a limited water supply, a larger root biomass is associated with an increased above-ground biomass. Root biomass, while genetically controlled, is also greatly affected by the environment with varying plasticity levels. In this context, understanding the relationship between the biomass of shoots and roots appears prudent. In this study, we analyze this relationship in a large dataset collected from multiple experiments conducted up to different growth stages in bread wheat (Triticum aestivum L.) and its wild relatives. Four bread wheat mapping populations as well as wild and domesticated members of the Triticeae tribe were evaluated for the root and shoot biomass allocation patterns. In the analyzed dataset the root and shoot biomasses were directly related to each other, and to the heading date, and the correlation values increased in proportion to the length of an experiment. On average, 84.1% of the observed variation was explained by a positive correlation between shoot and root biomass. Scatter plots generated from 6353 data points from numerous experiments with different wheats suggest that at some point, further increases in root biomass negatively impact the shoot biomass. Based on these results, a preliminary study with different water availability scenarios and growth conditions was designed with two cultivars, Pavon 76 and Yecora Rojo. The duration of drought and water level significantly affected the root/shoot biomass allocation patterns. However, the responses of the two cultivars were quite different, suggesting that the point of diminishing returns in increasing root biomass may be different for different wheats, reinforcing the need to breed wheats for specific environmental challenges.
Keywords: biomass allocation; bread wheat; drought stress; root/shoot ratio; trade-off.
Conflict of interest statement
The authors declare no conflict of interest.
Figures
Similar articles
-
Path Coefficient and Principal Component Analyses for Biomass Allocation, Drought Tolerance and Carbon Sequestration Potential in Wheat.Plants (Basel). 2022 May 26;11(11):1407. doi: 10.3390/plants11111407. Plants (Basel). 2022. PMID: 35684180 Free PMC article.
-
Domestication and crop physiology: roots of green-revolution wheat.Ann Bot. 2007 Nov;100(5):991-8. doi: 10.1093/aob/mcm180. Ann Bot. 2007. PMID: 17940075 Free PMC article.
-
Bottom-up redistribution of biomass optimizes energy allocation, water use and yield formation in dryland wheat improvement.J Sci Food Agric. 2022 Jun;102(8):3336-3349. doi: 10.1002/jsfa.11680. Epub 2021 Dec 10. J Sci Food Agric. 2022. PMID: 34820841
-
The effects of domestication on the scaling of below- vs. aboveground biomass in four selected wheat (Triticum; Poaceae) genotypes.Am J Bot. 2012 Jun;99(6):1112-7. doi: 10.3732/ajb.1100366. Epub 2012 May 29. Am J Bot. 2012. PMID: 22645097
-
Effects of Soil Water Shortage on Seedling Shoot and Root Growth of Saragolle Lucana Tetraploid Wheat (Triticum durum Desf.) Landrace.Plants (Basel). 2022 Dec 13;11(24):3492. doi: 10.3390/plants11243492. Plants (Basel). 2022. PMID: 36559604 Free PMC article.
Cited by
-
Enhancing drought resilience in durum wheat: effect of root architecture and genotypic performance in semi-arid rainfed regions.PeerJ. 2025 Mar 27;13:e19096. doi: 10.7717/peerj.19096. eCollection 2025. PeerJ. 2025. PMID: 40161347 Free PMC article.
-
Precrop-treated soil influences wheat (Triticum aestivum L.) root system architecture and its response to drought.Front Plant Sci. 2024 Jun 4;15:1389593. doi: 10.3389/fpls.2024.1389593. eCollection 2024. Front Plant Sci. 2024. PMID: 38895614 Free PMC article.
-
A maize landrace introgression library reveals a negative effect of root-to-shoot ratio on water-use efficiency.Plant Genome. 2025 Jun;18(2):e70036. doi: 10.1002/tpg2.70036. Plant Genome. 2025. PMID: 40281664 Free PMC article.
References
-
- Manske G.G.B., Vlek P.L.G. Root architecture-wheat as a model plant. In: Waisel Y., Eshel A., Beeckman T., Kafkafi U., editors. Plant Roots: The Hidden Half. 3rd ed. Routledge; Milton Park, UK: 2002. p. 249.
-
- Richards R.A. Genetic Opportunities to Improve Cereal Root Systems for Dryland Agriculture. Plant Prod. Sci. 2008;11:12–16. doi: 10.1626/pps.11.12. - DOI
