

Alterations in Faecal and Serum Metabolic Profiles in Patients with Neovascular Age-Related Macular Degeneration
- PMID: 37447310
- PMCID: PMC10346323
- DOI: 10.3390/nu15132984
Alterations in Faecal and Serum Metabolic Profiles in Patients with Neovascular Age-Related Macular Degeneration
Abstract
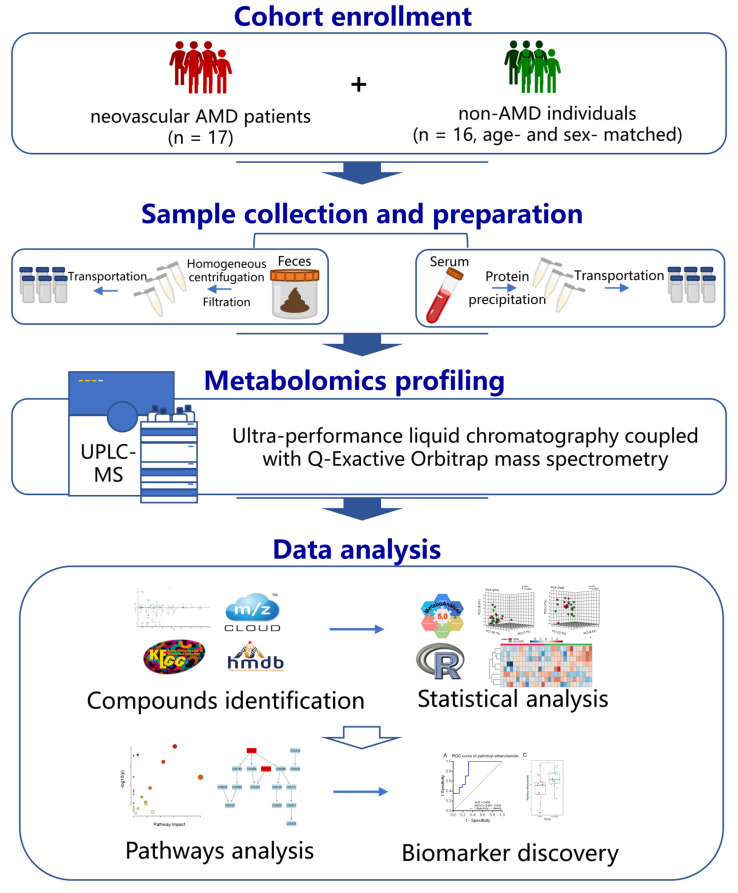
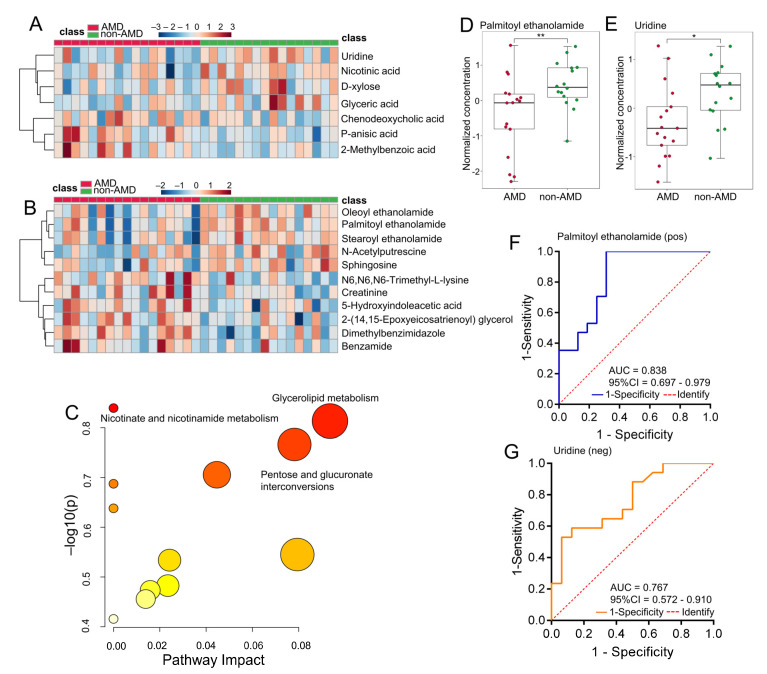
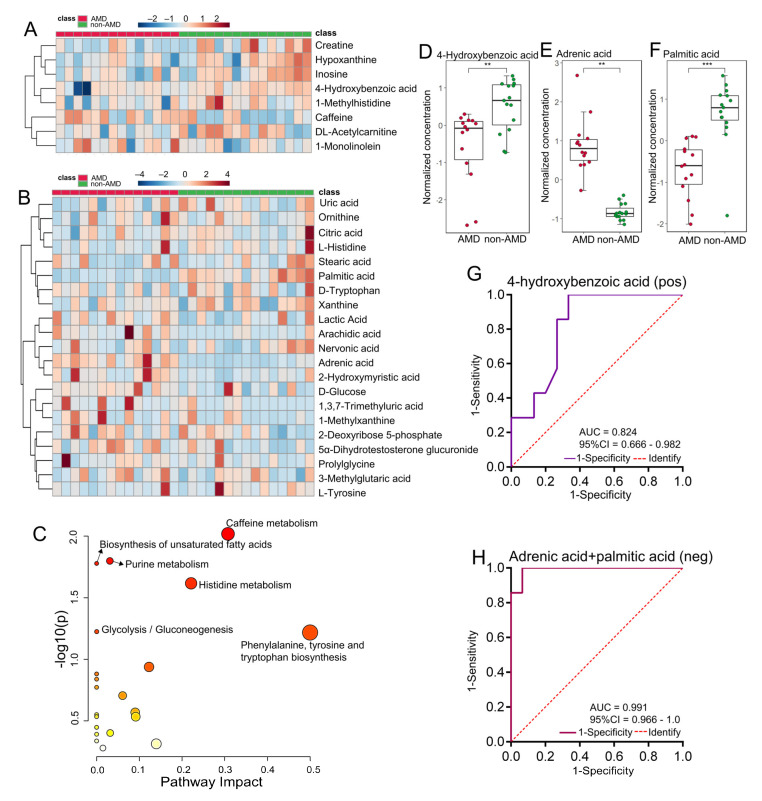
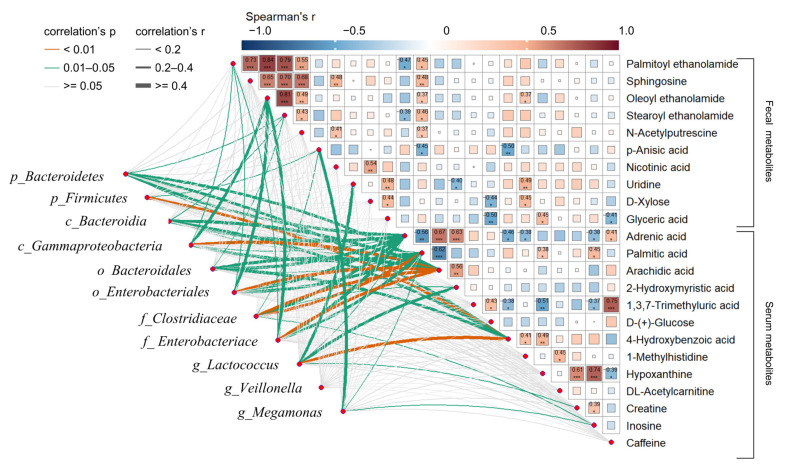
Neovascular age-related macular degeneration (nAMD) is a common and multifactorial disease in the elderly that may lead to irreversible vision loss; yet the pathogenesis of AMD remains unclear. In this study, nontargeted metabolomics profiling using ultra-performance liquid chromatography coupled with Q-Exactive Orbitrap mass spectrometry was applied to discover the metabolic feature differences in both faeces and serum samples between Chinese nonobese subjects with and without nAMD. In faecal samples, a total of 18 metabolites were significantly altered in nAMD patients, and metabolic dysregulations were prominently involved in glycerolipid metabolism and nicotinate and nicotinamide metabolism. In serum samples, a total of 29 differential metabolites were founded, involved in caffeine metabolism, biosynthesis of unsaturated fatty acids, and purine metabolism. Two faecal metabolites (palmitoyl ethanolamide and uridine) and three serum metabolites (4-hydroxybenzoic acid, adrenic acid, and palmitic acid) were selected as potential biomarkers for nAMD. Additionally, the significant correlations among dysregulated neuroprotective, antineuroinflammatory, or fatty acid metabolites in faecal and serum and IM dysbiosis were found. This comprehensive metabolomics study of faeces and serum samples showed that alterations in IM-mediated neuroprotective metabolites may be involved in the pathophysiology of AMD, offering IM-based nutritional therapeutic targets for nAMD.
Keywords: age-related macular degeneration; faecal; metabolomics; serum.
Conflict of interest statement
The authors declare no conflict of interest.
Figures
Similar articles
-
Serum Metabolomics Reveals Personalized Metabolic Patterns for Macular Neovascular Disease Patient Stratification.J Proteome Res. 2020 Feb 7;19(2):699-707. doi: 10.1021/acs.jproteome.9b00574. Epub 2020 Jan 9. J Proteome Res. 2020. PMID: 31755721
-
Integrative metabolome and lipidome analyses of plasma in neovascular macular degeneration.Heliyon. 2023 Sep 21;9(10):e20329. doi: 10.1016/j.heliyon.2023.e20329. eCollection 2023 Oct. Heliyon. 2023. PMID: 37780745 Free PMC article.
-
[Plasma metabolomics in a deep vein thrombosis rat model based on ultra-high performance liquid chromatography-electrostatic field orbitrap high resolution mass spectrometry].Se Pu. 2022 Aug;40(8):736-745. doi: 10.3724/SP.J.1123.2021.12024. Se Pu. 2022. PMID: 35903841 Free PMC article. Chinese.
-
Analysis of biofluid metabolomic profiles to the discovery of biomarkers in age-related macular degeneration.BMJ Open Ophthalmol. 2024 Dec 24;9(1):e001573. doi: 10.1136/bmjophth-2023-001573. BMJ Open Ophthalmol. 2024. PMID: 39719382 Free PMC article.
-
Metabolomics in Age-Related Macular Degeneration: A Systematic Review.Invest Ophthalmol Vis Sci. 2020 Dec 1;61(14):13. doi: 10.1167/iovs.61.14.13. Invest Ophthalmol Vis Sci. 2020. PMID: 33315052 Free PMC article.
Cited by
-
Causality of Blood Metabolites on Proliferative Diabetic Retinopathy: Insights From a Genetic Perspective.J Diabetes Res. 2024 Oct 30;2024:6828908. doi: 10.1155/2024/6828908. eCollection 2024. J Diabetes Res. 2024. PMID: 39512998 Free PMC article.
-
Causal influence of plasma metabolites on age-related macular degeneration: A Mendelian randomization study.Medicine (Baltimore). 2024 Sep 13;103(37):e39400. doi: 10.1097/MD.0000000000039400. Medicine (Baltimore). 2024. PMID: 39287235 Free PMC article.
-
Adrenic acid: A promising biomarker and therapeutic target (Review).Int J Mol Med. 2025 Feb;55(2):20. doi: 10.3892/ijmm.2024.5461. Epub 2024 Nov 22. Int J Mol Med. 2025. PMID: 39575474 Free PMC article. Review.
-
Serum metabolite biomarkers for the early diagnosis and monitoring of age-related macular degeneration.J Adv Res. 2025 Aug;74:443-454. doi: 10.1016/j.jare.2024.10.001. Epub 2024 Oct 5. J Adv Res. 2025. PMID: 39369956 Free PMC article.
References
-
- Wong W.L., Su X., Li X., Cheung C.M.G., Klein R., Cheng C.-Y., Wong T.Y. Global prevalence of age-related macular degeneration and disease burden projection for 2020 and 2040: A systematic review and meta-analysis. Lancet Glob. Health. 2014;2:e106–e116. doi: 10.1016/S2214-109X(13)70145-1. - DOI - PubMed
-
- Kersten E., Paun C.C., Schellevis R.L., Hoyng C.B., Delcourt C., Lengyel I., Peto T., Ueffing M., Klaver C.C.W., Dammeier S., et al. Systemic and ocular fluid compounds as potential biomarkers in age-related macular degeneration. Surv. Ophthalmol. 2018;63:9–39. doi: 10.1016/j.survophthal.2017.05.003. - DOI - PubMed
MeSH terms
Grants and funding
LinkOut - more resources
Full Text Sources
Medical
