. 2023 Jul 7;23(13):6213.
doi: 10.3390/s23136213.

Validation of Estimators for Weight-Bearing and Shoulder Joint Loads Using Instrumented Crutches

Affiliations

Validation of Estimators for Weight-Bearing and Shoulder Joint Loads Using Instrumented Crutches

Marco Ghidelli et al. Sensors (Basel). .

Abstract

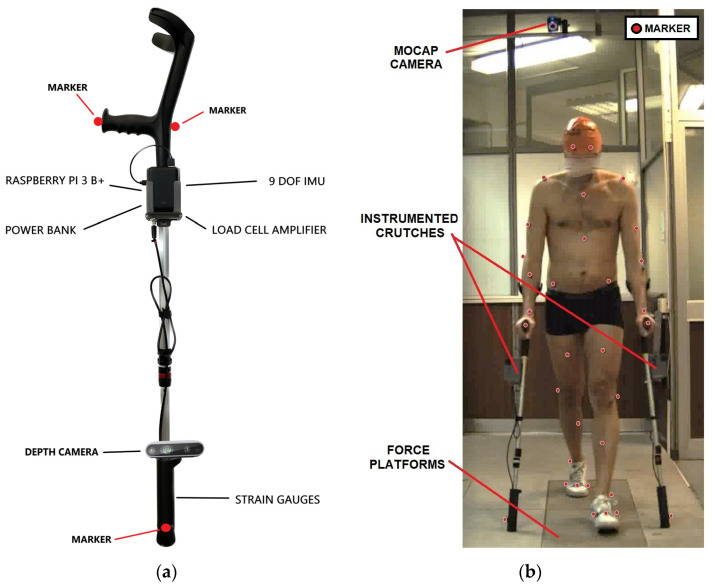
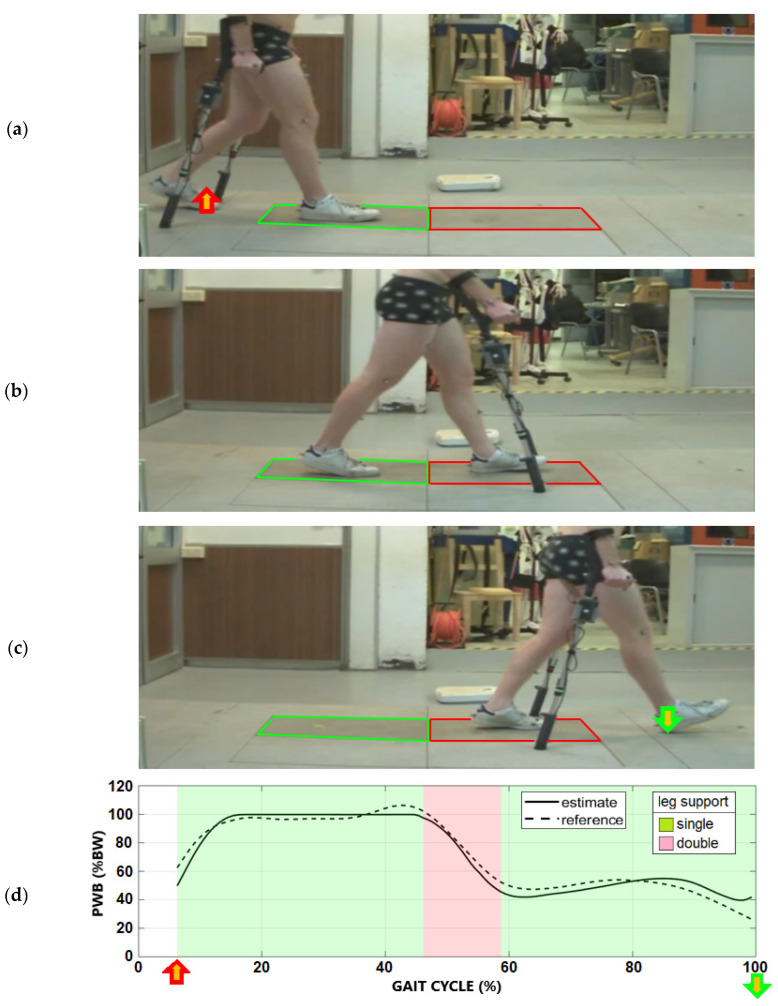
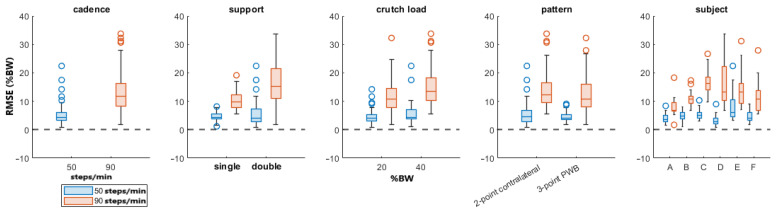
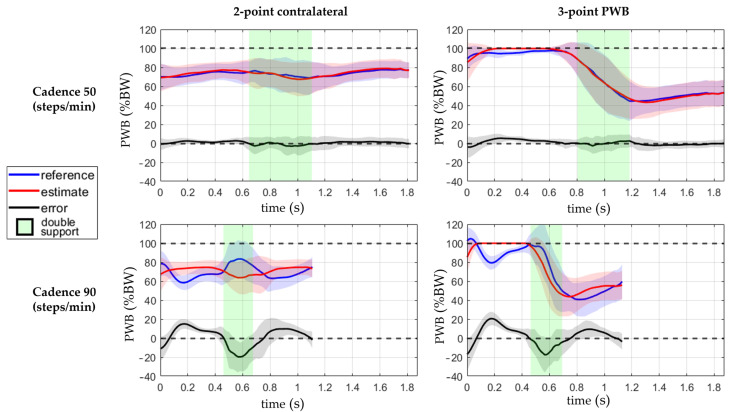
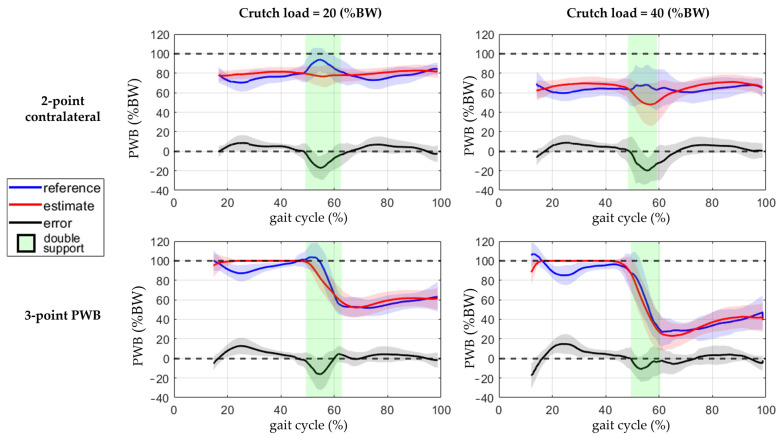
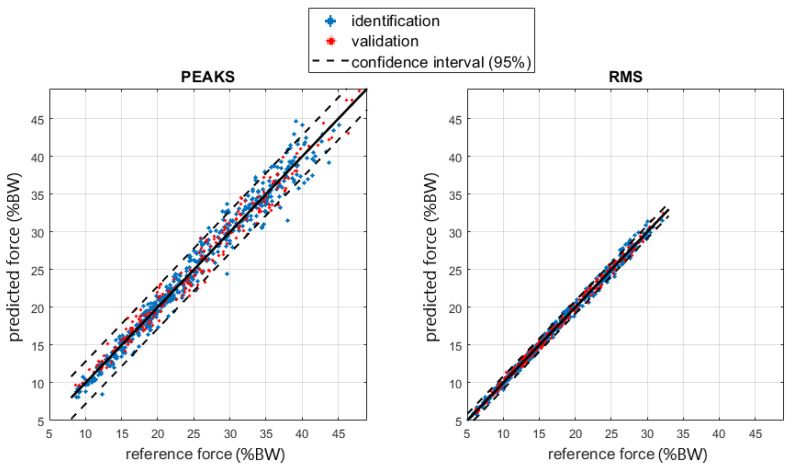
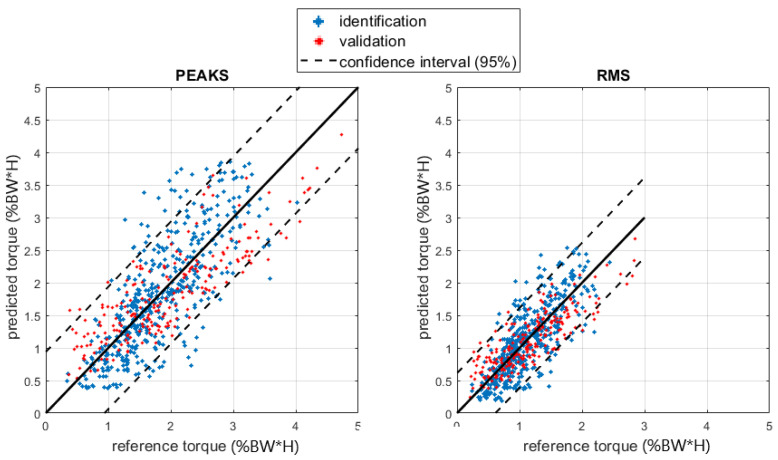
This research paper aimed to validate two methods for measuring loads during walking with instrumented crutches: one method to estimate partial weight-bearing on the lower limbs and another to estimate shoulder joint reactions. Currently, gait laboratories, instrumented with high-end measurement systems, are used to extract kinematic and kinetic data, but such facilities are expensive and not accessible to all patients. The proposed method uses instrumented crutches to measure ground reaction forces and does not require any motion capture devices or force platforms. The load on the lower limbs is estimated by subtracting the forces measured by the crutches from the subject's total weight. Since the model does not consider inertia contribution in dynamic conditions, the estimation improves with low walking cadence when walking with the two-point contralateral and the three-point partial weight-bearing patterns considered for the validation tests. The shoulder joint reactions are estimated using linear regression, providing accurate values for the forces but less accurate torque estimates. The crutches data are acquired and processed in real-time, allowing for immediate feedback, and the system can be used outdoors in real-world walking conditions. The validation of this method could lead to better monitoring of partial weight-bearing and shoulder joint reactions, which could improve patient outcomes and reduce complications.

Keywords: biomechanical model; gait analysis; instrumented crutches; load measurement; partial weight-bearing; shoulder joint; shoulder load; walking aid.


Conflict of interest statement

The authors declare no conflict of interest.

Figures

Figure 1
Figure 1
Comparison between the flowcharts of the biomechanical model approach and the shoulder reactions estimator.
Figure 2
Figure 2
(a) Instrumented crutches and marker placement; (b) subject walking with instrumented crutches during validation. Red dots highlight the visible markers from the frontal point of view.
Figure 3
Figure 3
(a) The gait event at the start of the interval for the validation of the PWB. The single support phase of the right leg started from this event until the next left foot’s heel contact. (b) The double leg support phase with all external forces measured by instrumented crutches and force plates. (c) The gait event at the end of the interval for the validation of the PWB. The left leg’s single support phase was between the last toe-off and the next heel contact of the right foot. (d) Comparison between the PWB estimated by the instrumented crutches and the reference value from the force plates, shown in the right leg’s gait cycle. The blank background is due to the interval with unknown external forces applied to the foot still resting on the floor.
Figure 4
Figure 4
Boxplots of the PWB’s RMSE. The line inside each box is the sample median, and the top and bottom edges of each box are the upper and lower quartiles (0.75 and 0.25), respectively. The distance between the top and bottom edges is the interquartile range.
Figure 5
Figure 5
Boxplots of the PWB’s ME. The line inside of each box is the sample median, and the top and bottom edges of each box are the upper and lower quartiles (0.75 and 0.25), respectively. The distance between the top and bottom edges is the interquartile range.
Figure 6
Figure 6
Comparison between the estimated PWB and the reference and the status of the leg support. The line represents the mean value, and the standard deviation is shown with the colored band around the mean. The data are from four conditions combining the walking pattern while walking at 50 or 90 steps/min. Data are visualized with respect to time, and the green and red backgrounds indicate the double-leg support interval.
Figure 7
Figure 7
Comparison between the estimated PWB and the reference during the gait cycle and the status of the leg support. The line represents the mean value, and the standard deviation is shown with the colored band around the mean. The data are from four conditions combining the walking pattern while loading 20 or 40% of the body weight on the crutch. Data are visualized with respect to the percentage of the gait cycle, and the green and red backgrounds indicate the gait cycle interval with double-leg support. The missing data between 0–15% of the gait cycle are due to the interval with unknown external forces applied to the foot still resting on the floor.
Figure 8
Figure 8
Regression of the shoulder joint force RMS and peaks. The force is shown as a percentage of the subject’s BW.
Figure 9
Figure 9
Regression of the shoulder joint torque. The torque is shown as a percentage of the BW times the height (H) of the subject.
Figure 10
Figure 10
PWB’s RMSE boxplots in the single-support phase of the affected limb. The line inside of each box is the sample median, and the top and bottom edges of each box are the upper and lower quartiles (0.75 and 0.25), respectively. The distance between the top and bottom edges is the interquartile range.
Figure 11
Figure 11
Normal probability plots of regression residuals of the identification subset for RMS and peak shoulder force.
Figure 12
Figure 12
Shoulder torque RMSE boxplots for (a) walking pattern; (b) the inverse of stance time; (c) crutch angle range of motion; (d) BMI.
Figure 12
Figure 12
Shoulder torque RMSE boxplots for (a) walking pattern; (b) the inverse of stance time; (c) crutch angle range of motion; (d) BMI.

Similar articles

Cited by

References

    1. Youm T., Maurer S.G., Stuchin S.A. Postoperative Management After Total Hip and Knee Arthroplasty. J. Arthroplast. 2005;20:322–324. doi: 10.1016/j.arth.2004.04.015. - DOI - PubMed
    1. Abdalbary S.A. Partial weight bearing in hip fracture rehabilitation. Futur. Sci. OA. 2018;4:FSO254. doi: 10.4155/fsoa-2017-0068. - DOI - PMC - PubMed
    1. Laufer Y. The use of walking aids in the rehabilitation of stroke patients. Rev. Clin. Gerontol. 2004;14:137–144. doi: 10.1017/S0959259805001449. - DOI
    1. Khan F.R., Vijesh P.V., Rahool S., Radha A.A., Sukumaran S., Kurupath R. Physiotherapy Practice in Stroke Rehabilitation: A Cross-Sectional Survey of Physiotherapists in the State of Kerala, India. Top. Stroke Rehabil. 2012;19:405–410. doi: 10.1310/tsr1905-405. - DOI - PubMed
    1. Raaben M., Holtslag H.R., Leenen L.P., Augustine R., Blokhuis T.J. Real-time visual biofeedback during weight bearing improves therapy compliance in patients following lower extremity fractures. Gait Posture. 2018;59:206–210. doi: 10.1016/j.gaitpost.2017.10.022. - DOI - PubMed

Grants and funding

LinkOut - more resources