. 2023 Jun 23:21:100712.
doi: 10.1016/j.mtbio.2023.100712. eCollection 2023 Aug.

Ropivacaine microsphere-loaded electroconductive nerve dressings for long-acting analgesia and functional recovery following diabetic peripheral nerve injury

Affiliations

Ropivacaine microsphere-loaded electroconductive nerve dressings for long-acting analgesia and functional recovery following diabetic peripheral nerve injury

Fangguo Liang et al. Mater Today Bio. .

Abstract

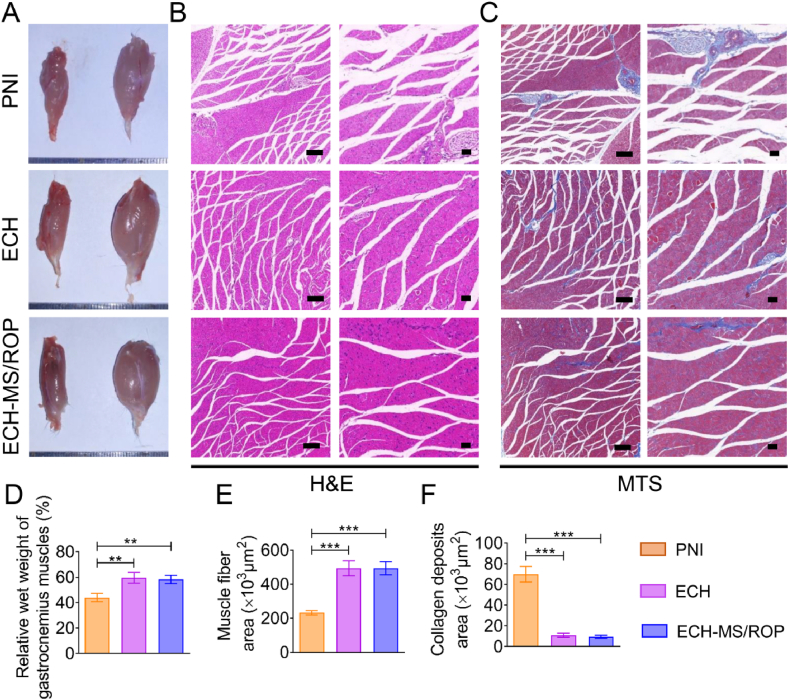
In recent years, electroconductive hydrogels (ECHs) have shown great potential in promoting nerve regeneration and motor function recovery following diabetic peripheral nerve injury (PNI), attributed to their similar electrical and mechanical characteristics to innate nervous tissue. It is well-established that PNI causes motor deficits and pain, especially in diabetics. Current evidence suggests that ropivacaine (ROP) encapsulated in poly lactic-co-glycolic acid (PLGA) microspheres (MSs) yield a sustained analgesic effect. In this study, an ECH electroconductive network loaded with MS/ROP (ECH-MS/ROP) was designed as a promising therapeutic approach for diabetic PNI to exert lasting analgesia and functional recovery. This dual delivery system allowed ROP's slow and sequential release, achieving sustained analgesia as demonstrated by our in vivo experiments. Meanwhile, this system was designed like a lamellar dressing, with desirable adhesive and self-curling properties, convenient for treating injured nerve tissues via automatically wrapping tube-like structures, facilitating the process of implantation. Our in vitro assays verified that ECH-MS/ROP was able to enhance the adhesion and motility of Schwann cells. Besides, both in vitro and in vivo studies substantiated that ECH-MS/ROP stimulated myelinated axon regeneration through the MEK/ERK signaling pathway, thereby improving muscular denervation atrophy and facilitating functional recovery. Therefore, this study suggests that the ECH-MS/ROP dressing provides a promising strategy for treating diabetic PNI to facilitate nerve regeneration, functional recovery and pain relief.

Keywords: Analgesia; Diabetic peripheral nerve injury; Electroconductive hydrogel; Nerve regeneration; Ropivacaine microspheres.


Conflict of interest statement

The authors declare that they have no known competing financial interests or personal relationships that could have appeared to influence the work reported in this paper.

Figures

Image 1
Graphical abstract
Fig. 1
Fig. 1
The functional groups, chemical bonds and production of ECH-MS/ROP and its ability to promote nerve regeneration, functional restoration and pain relief after diabetic PNI.
Fig. 2
Fig. 2
Characterization of the ECH-MS/ROP composite. (A) Illustration of the fabrication and structure of the ECH-MS/ROP composite. (B) FTIR spectra of ROP (blue), PLGA-MS (black), and the MS/ROP (red). (C) FTIR spectra of TA (blue), PPy (black), and ECH (red). (D) FTIR spectra of MS/ROP (blue), ECH (black), and the ECH-MS/ROP (red). (E) Photographs showing the occurrence of gelation with or without MS/ROP, Vial 1 indicates ECH and Vial 2 indicates ECH-MS/ROP. (F) The microstructure of the MS/ROP was visualized under SEM. Scale bar: 2 ​μm. (G) The microstructure of the ECH was observed under SEM. Scale bar: 10 ​μm. (H) The microstructure of the ECH-MS/ROP system was detected by SEM. Scale bar: 10 ​μm. (I) The cumulative release curve of ROP from PLGA-MS with or without ECH until day 8 (n ​= ​3). (J) Fluorescent images of labeled ECH-MS/ROP. Red, green and blue fluorescences suggest RhB-labeled MS, FITC-labeled ROP and DAPI-labeled ECH, respectively. Scale bar: 50 ​μm. (K) Mechanical properties of ECH and ECH-MS/ROP. (L) Graph of the quantification of rheological properties of ECH with or without MS/ROP (n ​= ​5). (M) Cyclic voltammograms of ECH with or without MS/ROP. (N) Nyquist curves of ECH and ECH-MS/ROP. (O) Illustrations and photographs showed adhesive and self-curling ECH-MS/ROP as a laminar dressing that adhered to the finger and automatically wrapped a size-matched tubular structure. Scale bar: 500 ​mm. Statistical differences were determined by using One-way ANOVA with Bonferroni's multiple comparison tests when comparing three or more groups. When comparing two groups, the unpaired t-test was used. (∗P ​< ​0.05, ∗∗P ​< ​0.01, and ∗∗∗P ​< ​0.001). (For interpretation of the references to colour in this figure legend, the reader is referred to the Web version of this article.)
Fig. 3
Fig. 3
Axonal outgrowth on the ECH-MS/ROP composite. (A) Live/dead assay of the PC-12 ​cells cultured on each sample surface for 1 day. Live cells were stained in green and dead cells in red. Scale bar: 200 ​μm. (B) Quantification of live/dead assay (n ​= ​3). (C) The results of the CCK-8 assay displayed that cell viability exceeded 80% for each sample after seeding for 1, 3 and 7 days (n ​= ​5). (D) The cytoskeleton images showed the attachment of PC-12 ​cells cultured in each group for 3 days. Scale bar: 50 ​μm. (E) Quantification of cell spread area (n ​= ​10). (F) A heat map showing the RT-qPCR results on the axon-related gene expressions of PC-12 ​cells (n ​= ​3). (G) Column graph exhibiting the RT-qPCR results on the axon-related gene expressions in PC-12 ​cells (n ​= ​3). (H) IF images for the NF (green) and cell nuclei (blue) to observe the axonal extension of the PC-12 ​cells. Scale bar: 50 ​μm. (I) Quantification of the axonal lengths of the PC-12 ​cells on each sample (n ​= ​10). (J) WB analysis detected the protein expressions of NF and GAP43 in PC-12 ​cells cultured on each sample for 3 days. (K) Protein band intensity was quantified (n ​= ​3). (L) The axonal outgrowth of DRG cultured on each sample for 3 days and 7 days. Scale bar: 200 ​μm. (M) Analysis of the axon length and area of the DRG for each group (n ​= ​3). Statistical differences were determined by using One-way ANOVA with Bonferroni's multiple comparison tests (∗P ​< ​0.05, ∗∗P ​< ​0.01, and ∗∗∗P ​< ​0.001). (For interpretation of the references to colour in this figure legend, the reader is referred to the Web version of this article.)
Fig. 4
Fig. 4
In vitro Schwann cell viability, proliferation, attachment and migration on the ECH-MS/ROP. (A) Live/dead assay of the Schwann cells cultured on each sample surface for 1 day. Live cells were stained in green and dead cells in red. Scale bar: 200 ​μm. (B) Quantification of live/dead assay (n ​= ​3). (C) The CCK-8 assay displayed that the cell viability exceeded 85% for each sample after seeding for 1, 3 and 7 days (n ​= ​5). (D) The cytoskeleton images showed the attachment of Schwann cells cultured in each group for 3 days. Scale bar: 50 ​μm. (E) Quantification of cell spread area (n ​= ​10). (F) Wound-healing migration assay of the Schwann cells on each sample at different time points. Scale bar: 200 ​μm. (G) Quantitative analysis of the scratch area at the denuded site at 0, 12, and 24 ​h (n ​= ​3). Statistical differences were determined by using One-way ANOVA with Bonferroni's multiple comparison tests (∗P ​< ​0.05, ∗∗P ​< ​0.01, and ∗∗∗P ​< ​0.001). (For interpretation of the references to colour in this figure legend, the reader is referred to the Web version of this article.)
Fig. 5
Fig. 5
In vivo biocompatibility of ECH-MS/ROP. (A) Photographs of serum obtained from whole blood co-incubated with each sample. Samples including ECH and ECH-MS/ROP were in light yellow and identical to the PBS control group, whereas the Triton-100X group was in bright red, implying its hemolysis. (B) The serum OD values in ECH and ECH-MS/ROP groups were comparable to the PBS group but were significantly lower than the Triton X-100 group (n ​= ​3). (C) HE staining showing normal morphology in the heart, liver, spleen, lung, and kidney tissues from each group. Scale bar: 100 ​μm. (D) Serum ALT, AST, and TP levels were comparable among different treatment groups, indicating that these hydrogels did not exert systemic toxicity (n ​= ​3). Statistical differences were determined by using One-way ANOVA with Bonferroni's multiple comparison tests (∗P ​< ​0.05, ∗∗P ​< ​0.01, and ∗∗∗P ​< ​0.001). (For interpretation of the references to colour in this figure legend, the reader is referred to the Web version of this article.)
Fig. 6
Fig. 6
The ECH-MS/ROP relieved pain and promoted recovery of motor function in diabetic rats after PNI. (A) Schematic diagram depicting the mechanical allodynia assay with von-Frey filaments. (B) Changes in PWT in each group after diabetic PNI compared to baseline (before model establishment) (n ​= ​4). (C) Average PWT of different groups before and after the operation (n ​= ​4). (D) Schematic diagram depicting the thermal hyperalgesia response by hot plate assay. (E) Changes in TWL in each group after diabetic PNI compared to baseline (before model establishment) (n ​= ​4). (F) Average TWL of different groups before and after the operation (n ​= ​4). (G) The equation for calculating the SFI based on different footprint parameters. (H) Representative photographs of the footprints among groups. (I) SFI scores of different treatment groups 2, 3, and 4 weeks after the surgery (n ​= ​3). (J–K) H&E staining and MTS showing sciatic nerve repair after 4 weeks of treatment. Scale bar: 500 ​μm (at low magnification) and 100 ​μm (at high magnification). Statistical differences were determined by using the nonparametric Kruskal-Wallis test when analyzing the PWT and TWL or One-way ANOVA with Bonferroni's multiple comparison test when comparing SFI results (∗ ​= ​significantly different from the PNI group, # ​= ​significantly different from the ECH group; ∗, #P ​< ​0.05, ∗∗, ##P ​< ​0.01, and ∗∗∗, ###P ​< ​0.001).
Fig. 7
Fig. 7
ECH-MS/ROP treatment attenuated gastrocnemius muscle atrophy. (A) Photographs of the harvested gastrocnemius muscles in each group. (B) HE staining exhibits cross-sectional images of the ipsilateral muscles. Scale bar: 200 ​μm (at low magnification) and 50 ​μm (at high magnification). (C) MTS showing the collagen deposits on the cross-sectional images of the ipsilateral muscles. Scale bar: 200 ​μm (at low magnification) and 50 ​μm (at high magnification). (D) Quantification of the relative wet weight of the gastrocnemius muscle (n ​= ​3). (E) Quantification of the area of muscle fiber (n ​= ​3). (F) Quantification of the area of collagen deposits (n ​= ​3). Statistical differences were determined by using One-way ANOVA with Bonferroni's multiple comparison tests (∗P ​< ​0.05, ∗∗P ​< ​0.01, and ∗∗∗P ​< ​0.001).
Fig. 8
Fig. 8
ECH-MS/ROP treatment promoted axon regrowth and remyelination in diabetic PNI models. (A) IF staining of the NF (green) and MBP (red) proteins in the crushed sciatic nerve tissues after 4 weeks of treatment. Scale bar: 200 ​μm (at low magnification) and 100 ​μm (at high magnification). (B) Quantitative analysis of the fluorescence intensity of NF and MBP proteins (n ​= ​3). (C) WB analysis of the proteins expression of in vivo NF and MBP. (D) Quantitative analysis of protein band intensity of NF and MBP (n ​= ​3). (E) IF staining of the S100β (red) proteins in the crushed sciatic nerve tissues after 4 weeks of treatment. Scale bar: 200 ​μm (at low magnification) and 100 ​μm (at high magnification). (F) Quantitative analysis of the fluorescence intensity of S100β proteins (n ​= ​3). (G) WB analysis of the proteins expression of in vivo S100β. (H) Quantitative analysis of protein band intensity of S100β (n ​= ​3). (I) WB analysis of the relative expression of the MEK/ERK pathway proteins. (J) Quantification of the protein band intensity of the MEK/ERK pathway proteins (n ​= ​3). Statistical differences were determined by using One-way ANOVA with Bonferroni's multiple comparison tests (∗P ​< ​0.05, ∗∗P ​< ​0.01, and ∗∗∗P ​< ​0.001). (For interpretation of the references to colour in this figure legend, the reader is referred to the Web version of this article.)
Fig. 9
Fig. 9
Morphological evaluation of the axon remyelination using TBS and TEM. (A) TBS showing the remyelination of the regenerated axon. The scale bar represents 50 ​μm. (B) Representative TEM images of the myelinated axonal regeneration. Scale bar respectively represents 5 ​μm ​at low magnification, 2 ​μm ​at median magnification and 0.5 ​μm ​at high magnification. (C–F) Quantification of the myelination of the regenerated axons with four parameters, including (C) myelinated axon diameter, (D) myelinated axon area, (E) myelin sheath thickness, and (F) G-Ratio (n ​= ​3). (G) The putative mechanism of ECH-MS/ROP in attenuating pain and promoting nerve regeneration and functional restoration after diabetic PNI. Statistical differences were determined by using One-way ANOVA with Bonferroni's multiple comparison test (∗P ​< ​0.05, ∗∗P ​< ​0.01, and ∗∗∗P ​< ​0.001).

Similar articles

Cited by

References

    1. Li R., Li Y., Wu Y., Zhao Y., Chen H., Yuan Y., Xu K., Zhang H., Lu Y., Wang J., Li X., Jia X., Xiao J. Heparin-poloxamer thermosensitive hydrogel loaded with bFGF and NGF enhances peripheral nerve regeneration in diabetic rats. Biomaterials. 2018;168:24–37. doi: 10.1016/j.biomaterials.2018.03.044. - DOI - PMC - PubMed
    1. Lin T., Liu S., Chen S., Qiu S., Rao Z., Liu J., Zhu S., Yan L., Mao H., Zhu Q., Quan D., Liu X. Hydrogel derived from porcine decellularized nerve tissue as a promising biomaterial for repairing peripheral nerve defects. Acta Biomater. 2018;73:326–338. doi: 10.1016/j.actbio.2018.04.001. - DOI - PubMed
    1. Liu C., Fan L., Tian Z., Wen H., Zhou L., Guan P., Luo Y., Chan C., Tan G., Ning C., Rong L., Liu B. Self-curling electroconductive nerve dressing for enhancing peripheral nerve regeneration in diabetic rats. Bioact. Mater. 2021;6:3892–3903. doi: 10.1016/j.bioactmat.2021.03.034. - DOI - PMC - PubMed
    1. Cai Y., Huang Q., Wang P., Ye K., Zhao Z., Chen H., Liu Z., Liu H., Wong H., Tamtaji M., Zhang K., Xu F., Jin G., Zeng L., Xie J., Du Y., Hu Z., Sun D., Qin J., Lu X., Luo Z. Conductive hydrogel conduits with growth factor gradients for peripheral nerve repair in diabetics with non-suture tape. Adv. Healthc. Mater. 2022;11:1–12. doi: 10.1002/adhm.202200755. - DOI - PubMed
    1. Zhang J., Chen Y., Huang Y., Wu W., Deng X., Liu H., Li R., Tao J., Li X., Liu X., Gou M. A 3D-printed self-adhesive bandage with drug release for peripheral nerve repair. Adv. Sci. 2020;7:1–10. doi: 10.1002/advs.202002601. - DOI - PMC - PubMed

LinkOut - more resources