Association of CSF and PET markers of neurodegeneration with electroclinical progression in Lafora disease
- PMID: 37448753
- PMCID: PMC10337130
- DOI: 10.3389/fneur.2023.1202971
Association of CSF and PET markers of neurodegeneration with electroclinical progression in Lafora disease
Abstract
Purpose: To evaluate the electro-clinical features in association with laboratory and instrumental correlates of neurodegeneration to detect the progression of Lafora disease (LD).
Methods: We investigated the electro-clinical longitudinal data and CSF Aβ42, p-tau181 and t-tauAg, amyloid, and 18F-FDG PET of five unrelated LD families.
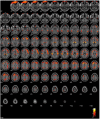
Results: Three progressive electro-clinical stages were identified. The early phase was characterized by rare, generalized tonic-clonic and focal visual seizures, followed by the occurrence of myoclonus after a period ranging from 2 to 12 months. The intermediate stage, usually occurring 2 years after the onset of epilepsy, is characterized by a worsening of epilepsy and myoclonus associated with progressive dementia and cerebellar signs. Finally, the late stage, evolving after a mean period of 7 ± 1.41 years from the onset of the disease, was characterized by gait ataxia resulting in bedriddenness, severe dementia, daily/pluri-daily myoclonus, drug-resistant epilepsy, clusters of seizures or status epilepticus, and medical complications. Amyloid (CSF Aβ42, amyloid PET) and neurodegenerative (CSF p-tau181 and t-tauAg, FDG-PET) biomarkers indicate a pattern of cognitive impairment of the non-Alzheimer's disease type. A total of 80% of the LD patients showed more severe hypometabolism in the second FDG-PET scan compared to the first scan performed in a lower phase; the lateral temporal lobe and the thalamus hypometabolism were associated with the presence of intermediate or late phase.
Conclusions: Three electroclinical and 18F-FDG PET evolutive stages are useful biomarkers for the progression of LD and could help to evaluate the efficacy of new disease-modifying treatments. The combination of traditional CSF biomarkers improves the diagnostic accuracy of cognitive decline in LD patients, indicating a cognitive impairment of the non-Alzheimer's disease type.
Keywords: 18F-FDG PET; Lafora disease; amyloid biomarkers; electro-clinical features; follow-up; neurodegenerative biomarkers; progressive myoclonic epilepsy.
Copyright © 2023 d'Orsi, Farolfi, Muccioli, Palumbo, Palumbo, Modoni, Allegri, Garibotto, Di Claudio, Di Muro, Benvenuto, Bisulli and Carella.
Conflict of interest statement
The authors declare that the research was conducted in the absence of any commercial or financial relationships that could be construed as a potential conflict of interest.
Figures


References
LinkOut - more resources
Full Text Sources
Research Materials

