Review
. 2023;219(5):37.
doi: 10.1007/s11214-023-00984-w. Epub 2023 Jul 11.

Energetic Electron Precipitation Driven by Electromagnetic Ion Cyclotron Waves from ELFIN's Low Altitude Perspective

V Angelopoulos  1 X-J Zhang  1   2 A V Artemyev  1 D Mourenas  3 E Tsai  1 C Wilkins  1 A Runov  1 J Liu  1   4 D L Turner  1   5 W Li  4 K Khurana  1 R E Wirz  6   7 V A Sergeev  8 X Meng  9 J Wu  1 M D Hartinger  1   10 T Raita  11 Y Shen  1 X An  1 X Shi  1 M F Bashir  1 X Shen  12 L Gan  12 M Qin  12 L Capannolo  12 Q Ma  12 C L Russell  1 E V Masongsong  1 R Caron  1 I He  1   13 L Iglesias  1   14 S Jha  1   15   16 J King  1   15 S Kumar  1   17   18 K Le  1   13 J Mao  1   15   19 A McDermott  1   6 K Nguyen  1   6   20 A Norris  1 A Palla  1   15   21 A Roosnovo  1   17   22 J Tam  1   6 E Xie  1   14   15 R C Yap  1   23   24 S Ye  1   6 C Young  1   15   16 L A Adair  1   17   25 C Shaffer  1   6   26 M Chung  1   27 P Cruce  1   28 M Lawson  1 D Leneman  1 M Allen  1   6   29 M Anderson  1   23   30 M Arreola-Zamora  1   27 J Artinger  1   17   31 J Asher  1   6   32 D Branchevsky  1   32   33 M Cliffe  1   20   33 K Colton  1   23   24 C Costello  1   15   34 D Depe  1   33   35 B W Domae  1   33 S Eldin  1   16   33 L Fitzgibbon  1   17   36 A Flemming  1   6   27 D M Frederick  1   6   37 A Gilbert  1   33   38 B Hesford  1   9   33 R Krieger  1   13   39 K Lian  1   6   32 E McKinney  1   40 J P Miller  1   15   41 C Pedersen  1   6 Z Qu  1   6   42 R Rozario  1   6   20 M Rubly  1   6   43 R Seaton  1   6 A Subramanian  1   27   33 S R Sundin  1   6   44 A Tan  1   33   45 D Thomlinson  1   6   32 W Turner  1   17   46 G Wing  1   15   47 C Wong  1   17   48 A Zarifian  1   6   9
Affiliations
Review

Energetic Electron Precipitation Driven by Electromagnetic Ion Cyclotron Waves from ELFIN's Low Altitude Perspective

V Angelopoulos et al. Space Sci Rev. 2023.

Abstract

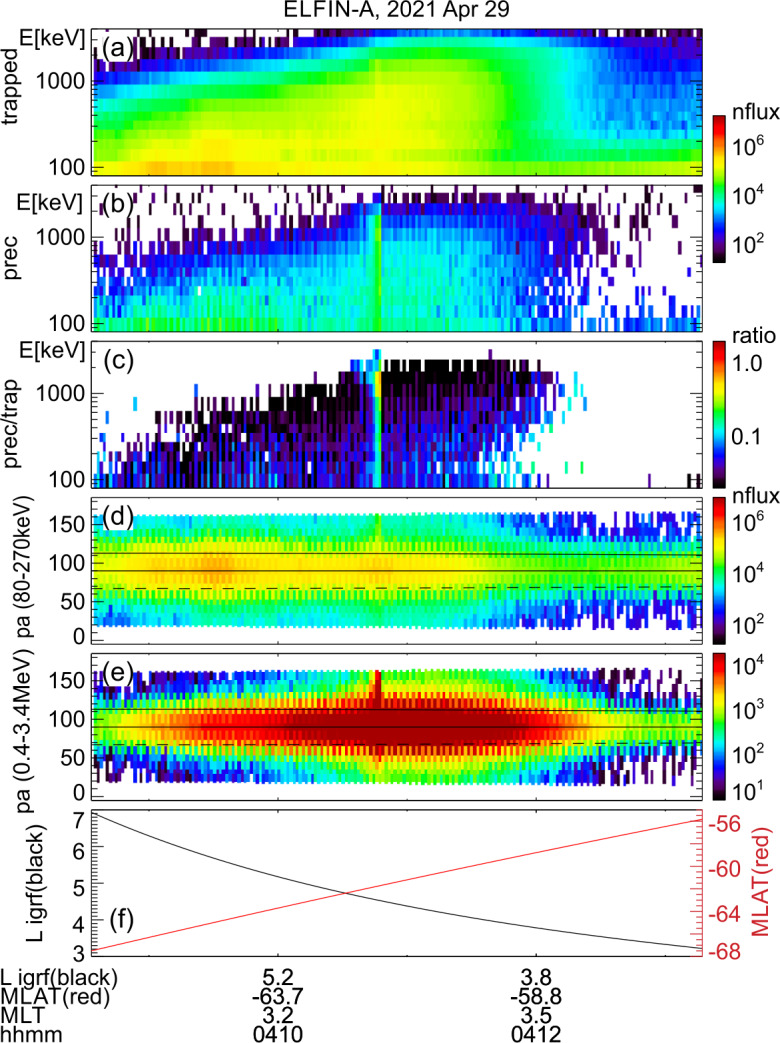
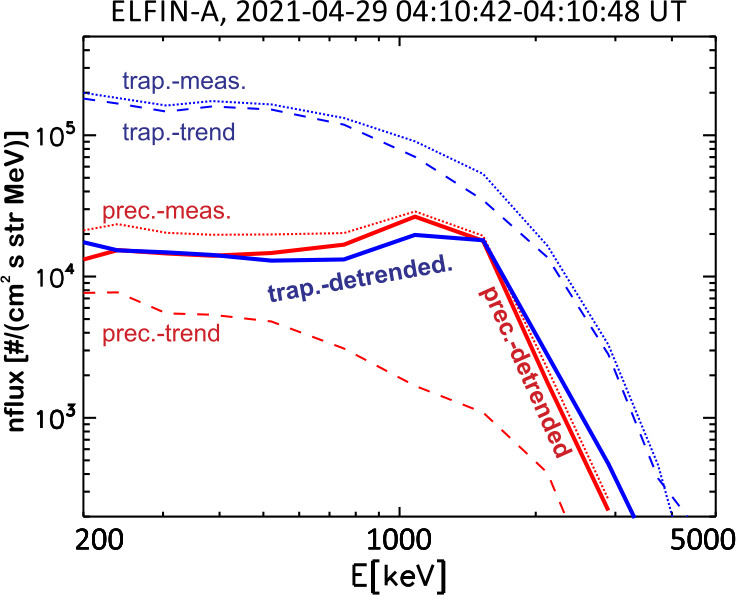
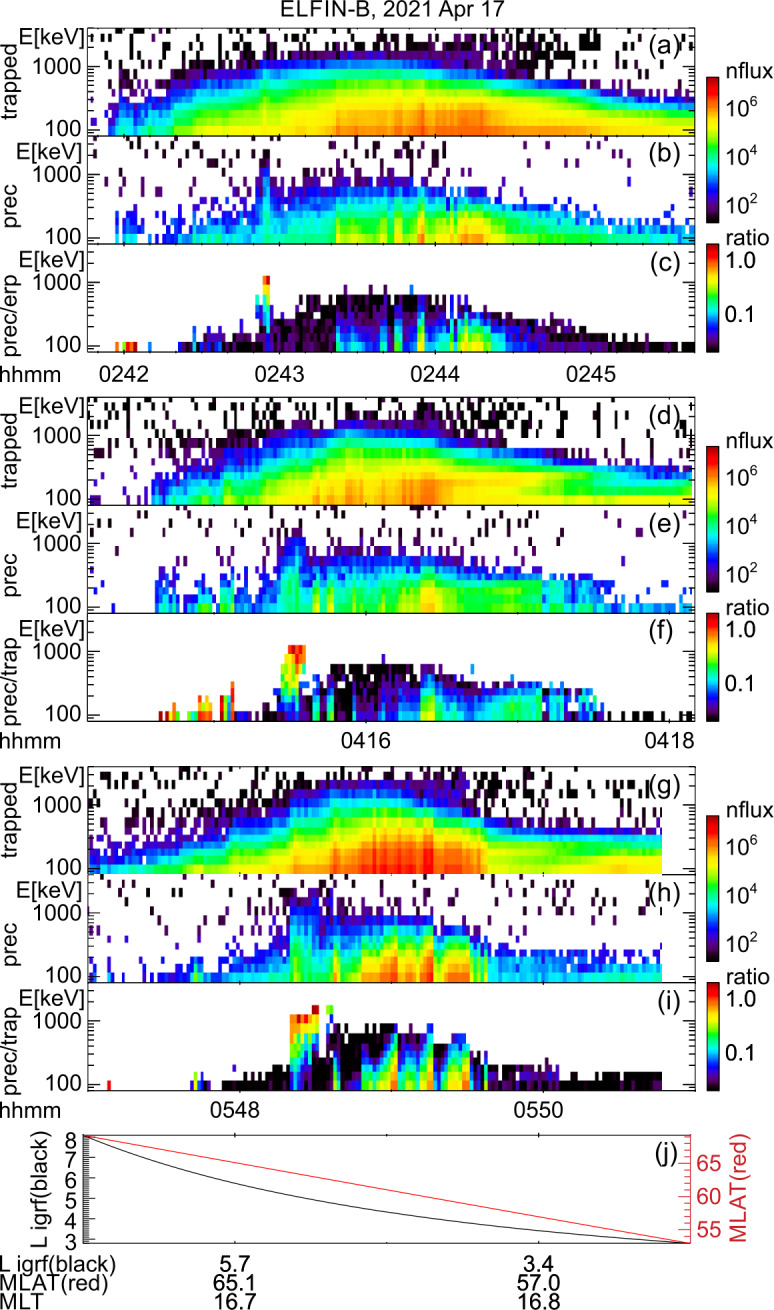
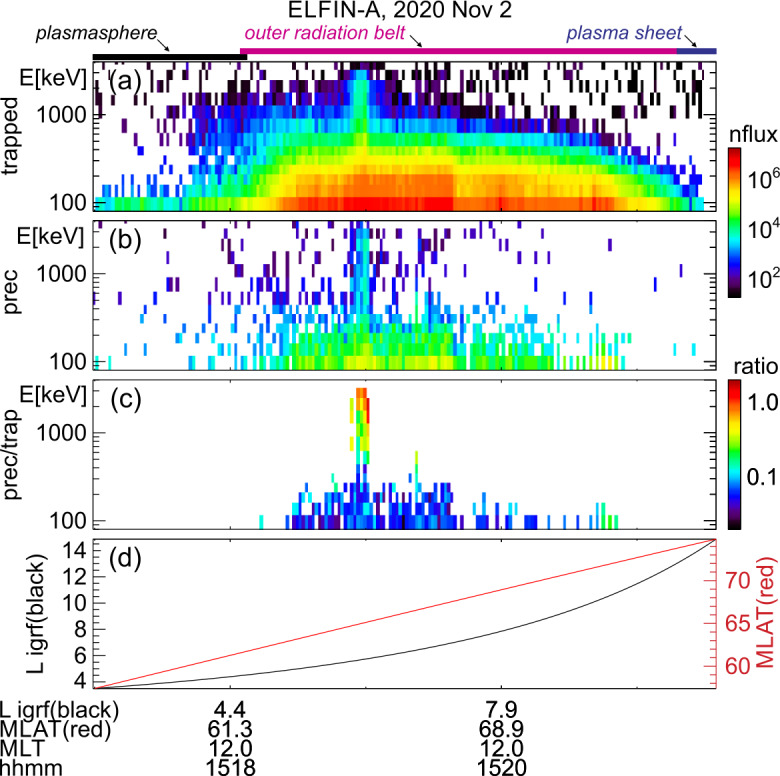
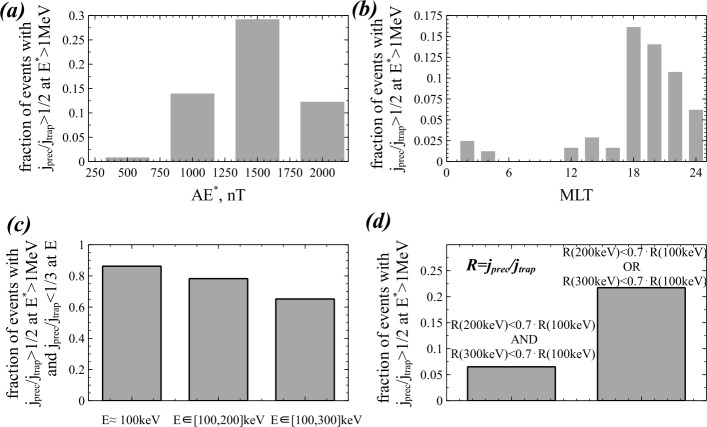
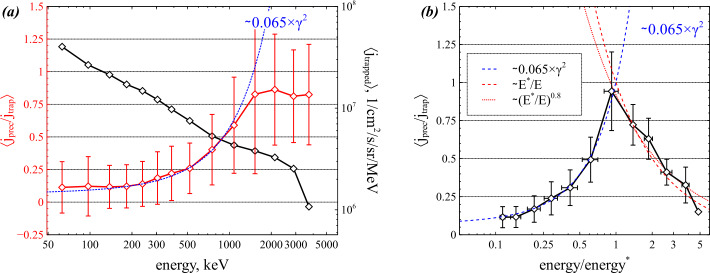
We review comprehensive observations of electromagnetic ion cyclotron (EMIC) wave-driven energetic electron precipitation using data collected by the energetic electron detector on the Electron Losses and Fields InvestigatioN (ELFIN) mission, two polar-orbiting low-altitude spinning CubeSats, measuring 50-5000 keV electrons with good pitch-angle and energy resolution. EMIC wave-driven precipitation exhibits a distinct signature in energy-spectrograms of the precipitating-to-trapped flux ratio: peaks at >0.5 MeV which are abrupt (bursty) (lasting ∼17 s, or ΔL0.56) with significant substructure (occasionally down to sub-second timescale). We attribute the bursty nature of the precipitation to the spatial extent and structuredness of the wave field at the equator. Multiple ELFIN passes over the same MLT sector allow us to study the spatial and temporal evolution of the EMIC wave - electron interaction region. Case studies employing conjugate ground-based or equatorial observations of the EMIC waves reveal that the energy of moderate and strong precipitation at ELFIN approximately agrees with theoretical expectations for cyclotron resonant interactions in a cold plasma. Using multiple years of ELFIN data uniformly distributed in local time, we assemble a statistical database of ∼50 events of strong EMIC wave-driven precipitation. Most reside at L5-7 at dusk, while a smaller subset exists at L8-12 at post-midnight. The energies of the peak-precipitation ratio and of the half-peak precipitation ratio (our proxy for the minimum resonance energy) exhibit an L-shell dependence in good agreement with theoretical estimates based on prior statistical observations of EMIC wave power spectra. The precipitation ratio's spectral shape for the most intense events has an exponential falloff away from the peak (i.e., on either side of 1.45 MeV). It too agrees well with quasi-linear diffusion theory based on prior statistics of wave spectra. It should be noted though that this diffusive treatment likely includes effects from nonlinear resonant interactions (especially at high energies) and nonresonant effects from sharp wave packet edges (at low energies). Sub-MeV electron precipitation observed concurrently with strong EMIC wave-driven >1 MeV precipitation has a spectral shape that is consistent with efficient pitch-angle scattering down to ∼ 200-300 keV by much less intense higher frequency EMIC waves at dusk (where such waves are most frequent). At ∼100 keV, whistler-mode chorus may be implicated in concurrent precipitation. These results confirm the critical role of EMIC waves in driving relativistic electron losses. Nonlinear effects may abound and require further investigation.

Keywords: Electromagnetic ion cyclotron waves; Magnetosphere; Plasma waves; Radiation belts; Relativistic electron precipitation; Whistler-mode chorus.


Conflict of interest statement

Competing InterestsThe authors have no relevant financial or non-financial interests to disclose.

Figures

Fig. 1
Fig. 1
Overview of two consecutive ELFIN A science zone crossings: one at the nightside/dawn sector (left) and the other at the dayside/dusk sector (right, primed panel letters). From top to bottom shown are 3 energy-spectrograms (a-c), 2 pitch-angle spectrograms (d-e) and the satellite’s L-shell and magnetic latitude (f) computed using the international geophysical reference field (IGRF) model. All spectrograms show products derived from the number-flux of electrons (measured in individual sectors, in units of 1/cm2/s/sr/MeV) averaged over the selected pitch-angle and energy range as follows: The energy spectrograms in (a) and (a′) are for locally trapped electrons (only pitch angles outside the loss cone and anti-loss cone, near perpendicular to the local field line direction, were included); those in (b) and (b′) are for precipitating electrons (with pitches in the loss cone); and those in (c) and (c′) are precipitating-to-trapped flux spectra ratios formed from the panels right above. The pitch-angle spectrograms in (d-e) and (d′-e′) are average fluxes in two broad energy ranges: a low energy range, 80-270 keV, and a high energy range, 0.4 - 3.4 MeV. The horizontal lines demarcate 90deg (vertically centered solid line), the loss cone (the other solid line) and the anti-loss cone (the dashed line). Horizontal color bars above Panel (a) represent magnetospheric regions identified based on the data and discussed in the main text. Arrows in Panels (c′) and (e′) represent spectral features also discussed in the main text
Fig. 2
Fig. 2
Overview of ELFIN A observations for a science zone crossing, exhibiting a typical EMIC wave-driven precipitation signature. Format is identical to that of Fig. 1
Fig. 3
Fig. 3
Observations from THEMIS E at the equator at an MLT and UT near those of the science zone crossing by ELFIN A depicted in Fig. 2. Panels (a-d) show about an hour of data centered around an EMIC wave emission: power spectral density of the magnetic field measured by the fluxgate magnetometer, FGM, instrument (a), wave normal angle (b), ellipticity (c), electron density inferred from the spacecraft potential computed on-board by the electric field instrument, EFI, and processed on the ground using the measured electron temperature by the electrostatic analyzer, ESA, instrument (d). The black dashed line is the He+ gyrofrequency. Panel (e) shows ∼2.5 min of data from a single magnetic field component in a field-aligned-coordinate system (FAC), BX,FAC. It is oriented perpendicular to the average magnetic field direction (hence, near the plane of polarization) and lies on a plane also containing the sunward direction. Panel (f) is an expanded, ∼1 min long, view of the same quantity as above it. Arrows in Panels (e) and (f) are discussed in the main text
Fig. 4
Fig. 4
Average spectra of precipitating (red) and trapped (blue) electrons at the moment of the strongest precipitation (04:10:42-04:10:48 UT) at ELFIN A for the event of Fig. 2. Detrended fluxes (solid, thick lines) are measured averages (dotted, thin lines) minus the trends (dashed, thin lines). Trends are average fluxes from 6 s immediately before and 6 s immediately after the strongest precipitation interval
Fig. 5
Fig. 5
An example of prolonged relativistic electron precipitation, presumably due to the long-lasting presence of EMIC waves in the equatorial magnetosphere. Three consecutive northern hemisphere, equatorward science zone crossings by ELFIN A at post-noon/dusk (MLT ∼16.75) are depicted in three panels per crossing (a-c; d-f; g-i), arranged in time to have a common L-shell and magnetic latitude, shown in Panel (j). Each crossing’s three panels have the same format as the top three panels in Figs. 1 and 2, i.e., they are energy spectrograms of trapped fluxes, precipitating fluxes and precipitating-to-trapped flux ratio
Fig. 6
Fig. 6
Overview of ELFIN A observations during a He+ band EMIC wave-driven event, on 02 Nov 2020, in a format similar to that of Fig. 1
Fig. 7
Fig. 7
ELFIN A projections to the ionosphere in the north and south for the event of Fig. 6. Diamonds and asterisks mark the start and end times of the trajectories; crosses are 1 min tickmarks; thick traces denote times of intense relativistic electron precipitation identified from Fig. 6(c) as a putative EMIC wave-driven precipitation event
Fig. 8
Fig. 8
Magnetic field spectra from the ground-based station at SPA in the Antarctic. As shown in Fig. 7, SPA is in close conjunction with ELFIN-A during this event. Superimposed in the spectra are He+ and O+ equatorial gyrofrequencies (horizontal lines) using the magnetic field at their equatorial projection, inferred from the T89 model. The vertical magenta lines mark the time interval of ELFIN A’ science zone crossing during this event
Fig. 9
Fig. 9
Theoretical estimates of minimum resonance energy and comparison with observations for the event of Fig. 6. From top to bottom: average precipitating-to-trapped flux ratio during the time of peak precipitation (15:18:51-15:19:03UT); contour plot of minimum resonance energy (in MeV) as a function of the maximum unstable frequency fmax (normalized to the relevant ion cyclotron gyrofrequency fcHe) and of the fpe/fce ratio for a He+ ion concentration of 5%; and same as the panel above, but for a 10% He+ concentration. Red and yellow colors depict the electron energy ranges for which ELFIN A measured strong precipitation and moderate precipitation (R>0.5 and 0.5>R>0.3, respectively). The plot shows that resonance energies exhibiting moderate and strong precipitation at ELFIN are consistent with the range of parameters fmax/fcHe, fpe/fce inferred from in-situ measurements at conjugate platforms (at the intersection of the corresponding grayed areas), for a reasonable range of He+ concentrations
Fig. 10
Fig. 10
Overview of ELFIN A observations during a H+ band EMIC wave-driven event, on 6 December 2020, in a format similar to that of Fig. 1
Fig. 11
Fig. 11
ELFIN A projections to the ionosphere in the north and south for the event of Fig. 10, in a format similar to that of Fig. 7
Fig. 12
Fig. 12
Magnetic field power spectral density (arbitrary units) from the Finland ground-based station at SOD, located as shown in Fig. 11. Superimposed H+, He+ and O+ equatorial gyrofrequencies (horizontal lines) using the equatorial magnetic field conjugate to these stations. The magenta vertical lines bracket the time interval of ELFIN A’s science zone crossing during this event
Fig. 13
Fig. 13
Theoretical estimates of minimum resonance energy and comparison with observations for the event of Fig. 10. From top to bottom: average precipitating-to-trapped flux ratio during the time of peak precipitation (20:20:33 - 20:20:48 UT); contour plot of minimum resonance energy (in MeV) as a function of the maximum unstable frequency fmax (normalized to the relevant ion cyclotron frequency, fcp), and of the fpe/fce ratio for 0% helium concentration; and same as the panel above but for a 2.5%He+ concentration. Red and yellow colors depict the electron energy ranges for which ELFIN A measured strong and moderate precipitation (R>0.5 and 0.5>R>0.3, respectively). The plot shows that resonance energies exhibiting moderate and strong precipitation at ELFIN are consistent with the range of parameters fmax/fcp and fpe/fce inferred from in-situ observations at conjugate platforms (fmax/fcp0.6-0.9 and fpe/fce10-12) for a reasonable range of He+ concentrations
Fig. 14
Fig. 14
Overview of ELFIN A observations on 10 September 2020, which is being examined together with concurrent TEC observations. Two consecutive northern hemisphere, equatorward science zone crossings at midnight/pre-midnight (MLT ∼0.75) are depicted in three panels per crossing (a-c; and f-g), arranged in time to have a common L-shell and magnetic latitude, shown in Panel (e). Each crossing’s three panels have the same format as the top three panels in Figs. 1 and 2, i.e., they show energy spectrograms of trapped fluxes, precipitating fluxes and precipitating-to-trapped flux ratio. A fourth panel for each crossing (Panels (d) and (h), respectively) show the TEC values at the satellite ionospheric projection (after averaging over 3 degrees each in latitude and longitude, and over 20min in time)
Fig. 15
Fig. 15
Projections of ELFIN A science zone crossings of Fig. 14 onto the Madrigal TEC maps at 11:30:00 UT (top panel) and 13:00:00 UT (bottom panel) in the northern hemisphere: start and end times of ELFIN A trajectories are marked by a diamond and an asterisk, respectively; crosses are 1 min marks. Regions of interest along the ELFIN trajectory are denoted with same colors as at the top of Fig. 14 (blue: plasma sheet, magenta: outer radiation belt, black: plasmasphere). The thick magenta line sections depict the times of relativistic electron precipitation related to EMIC wave scattering identified from Fig. 14, Panels (c) and (c∗′), respectively. Numbered black traces in the TEC maps show contours of TEC
Fig. 16
Fig. 16
Properties of relativistic electron precipitation inferred from 50 EMIC wave-driven events (comprising 310 individual spin samples) measured by ELFIN A&B. (a) Ensemble spatial distribution versus L-shell. (b) Occurrence rate of events (total event duration normalized by the ELFIN residence time in each bin) in (L,MLT) space. (c) Peak precipitating-to-trapped flux ratio at each spin sample (circle), and average (black) and mean (red) of that ratio within each L-shell bin, both shown as a function of L-shell. (d) Energy of the peak precipitating-to-trapped electron flux ratio, E, at each spin sample as a function of L. (e) Energy of half-peak (below the peak) of the precipitating-to-trapped electron flux ratio, denoted by Emin at each spin sample, shown as a function of L. Red dashed lines in Panels (d) and (e) depict theoretical estimates of the respective quantities based on statistical wave spectra (derived as discussed in text). Dashed and dotted blue lines in Panel (e) depict theoretical lower limits of the resonance energy estimated based on wave cyclotron damping at kc/Ωpi1 and kc/Ωpi2, respectively
Fig. 17
Fig. 17
Properties of the most efficient EMIC wave-driven precipitation events, those exhibiting highly relativistic (E>1 MeV), strong (R = jprec/jtrap > 1/2) electron precipitation, observed at L < 7. (a) Fraction of these most efficient events in each AE bin divided by total number of most efficient events (AE is the maximum AE in the preceeding 3 hours). (b) Same as (a) but as a function of MLT. (c) Fraction of most efficient events that also have 0R<1/3) in the three low-energy range categories listed in the abscissa. The rest (those with R>1/3), representing concurrent low-energy moderate or strong precipitation, can still be a significant fraction of the most efficient EMIC wave-driven precipitation events (15 - 35%, depending on energy range category). (d) Fraction of most efficient EMIC wave-driven precipitation events satisfying two different criteria for R=jprec/jtrap at lower energy as defined in annotations. Implications are discussed in the main text
Fig. 18
Fig. 18
Spectral properties of EMIC wave-driven electron precipitation. (a) Average spectrum of trapped fluxes (black curve) and of precipitating-to-trapped flux ratio (red curve) for events with jprec/jtrap>1/2 at E>1 MeV. The dotted blue curve shows a best least-squares fit to the average flux ratio at low energy. (b) Average precipitating-to-trapped flux ratio for the events of Panel (a), plotted as a function of the normalized energy E/E, where E is the peak precipitating-to-trapped flux ratio energy for each event (a proxy for the minimum resonance energy ER,min with the most intense waves). Best least-squares fits to the average flux ratio are shown below the peak, jprec/jtrapγ2(E)/γ2(E)0.065γ2(E) for E=E1.45 MeV (dashed blue curve), and above the peak, jprec/jtrap1.01(E/E)1.01 (dashed red curve). Note that if the last point (E/E4.84) with a small number of measurements was discarded, the best fit would become jprec/jtrap0.92(E/E)0.8 (dotted red curve)
Fig. 19
Fig. 19
(a) EMIC wave power ratio Bw2(f)/Bw2(fpeak) inferred, using quasi-linear theory, from ELFIN statistics of precipitating-to-trapped electron flux ratio jprec/jtrap (solid blue curve), and compared with statistical EMIC wave power ratios obtained from Van Allen Probes 2012-2016 observations in four different MLT sectors when fpe/fce>15 (black, green, magenta, and red curves). Specifically, the solid blue curve was derived from the best fit to jprec/jtrap in Fig. 18(a) and the dashed blue curves show its uncertainty range, corresponding to the uncertainty in E from the measurements, also depicted in Panel (c), below. (b) Same as (a) but for fpe/fce[5,15]. (c) Energy E of electrons near the loss cone in cyclotron resonance with EMIC waves at f/fcp in Panel (a), assuming waves at fpeak/fcp0.37 in resonance with E1.45 MeV electrons for fpe/fce>15. Dashed curves are based on the measurement uncertainty range in E. (d) Same as (c) for fpeak/fcp0.41 and E2.5 MeV for fpe/fce[5,15], corresponding to wave power ratios in Panel (b)

References

    1. Aa E, Zou S, Erickson PJ, Zhang S-R, Liu S. Statistical analysis of the main ionospheric trough using swarm in situ measurements. J Geophys Res Space Phys. 2020;125(3):e27583. doi: 10.1029/2019JA027583. - DOI
    1. Adair L, Angelopoulos V, Sibeck D, Zhang XJ. A statistical examination of EMIC wave-driven electron pitch angle scattering signatures. J Geophys Res Space Phys. 2022;127(2):e29790. doi: 10.1029/2021JA029790. - DOI
    1. Agapitov OV, Artemyev A, Krasnoselskikh V, Khotyaintsev YV, Mourenas D, Breuillard H, Balikhin M, Rolland G. Statistics of whistler mode waves in the outer radiation belt: cluster STAFF-SA measurements. J Geophys Res. 2013;118:3407–3420. doi: 10.1002/jgra.50312. - DOI
    1. Agapitov OV, Mourenas D, Artemyev AV, Mozer FS, Hospodarsky G, Bonnell J, Krasnoselskikh V. Synthetic empirical chorus wave model from combined Van Allen Probes and cluster statistics. J Geophys Res Space Phys. 2018;123(1):297–314. doi: 10.1002/2017JA024843. - DOI
    1. Albert JM. Evaluation of quasi-linear diffusion coefficients for EMIC waves in a multispecies plasma. J Geophys Res Space Phys. 2003;108(A6):1249. doi: 10.1029/2002JA009792. - DOI