. 2023 Jun 28:14:1225804.
doi: 10.3389/fphys.2023.1225804. eCollection 2023.

In silico assessment of histotripsy-induced changes in catheter-directed thrombolytic delivery

Affiliations

In silico assessment of histotripsy-induced changes in catheter-directed thrombolytic delivery

Kenneth B Bader et al. Front Physiol. .

Abstract

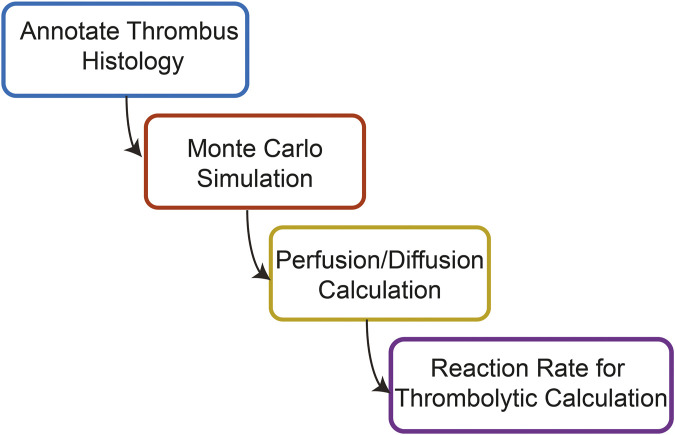
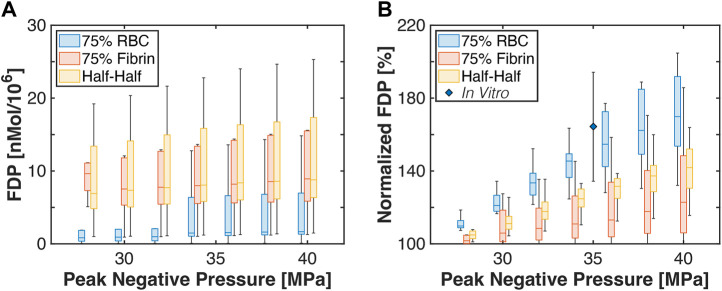
Introduction: For venous thrombosis patients, catheter-directed thrombolytic therapy is the standard-of-care to recanalize the occluded vessel. Limitations with thrombolytic drugs make the development of adjuvant treatments an active area of research. One potential adjuvant is histotripsy, a focused ultrasound therapy that lyses red blood cells within thrombus via the spontaneous generation of bubbles. Histotripsy has also been shown to improve the efficacy of thrombolytic drugs, though the precise mechanism of enhancement has not been elucidated. In this study, in silico calculations were performed to determine the contribution of histotripsy-induced changes in thrombus diffusivity to alter catheter-directed therapy. Methods: An established and validated Monte Carlo calculation was used to predict the extent of histotripsy bubble activity. The distribution of thrombolytic drug was computed with a finite-difference time domain (FDTD) solution of the perfusion-diffusion equation. The FDTD calculation included changes in thrombus diffusivity based on outcomes of the Monte Carlo calculation. Fibrin degradation was determined using the known reaction rate of thrombolytic drug. Results: In the absence of histotripsy, thrombolytic delivery was restricted in close proximity to the catheter. Thrombolytic perfused throughout the focal region for calculations that included the effects of histotripsy, resulting in an increased degree of fibrinolysis. Discussion: These results were consistent with the outcomes of in vitro studies, suggesting histotripsy-induced changes in the thrombus diffusivity are a primary mechanism for enhancement of thrombolytic drugs.

Keywords: Monte Carlo simulation; ablation; catheter-directed thrombolytics; diffusion; histotripsy; venous thrombosis.


Conflict of interest statement

The authors declare that the research was conducted in the absence of any commercial or financial relationships that could be construed as a potential conflict of interest.

Figures

FIGURE 1
FIGURE 1
Overview of the steps used to compute the combined effects of histotripsy ablation and thrombolytic drug on venous thrombus degradation.
FIGURE 2
FIGURE 2
(A) Hematoxylin and eosin (H&E) stain of representative venous thrombus. (B) Color deconvolution of H&E image using the Positive Pixel Algorithm. Fibrin is noted in orange, and red blood cells are in blue. The bar in the lower left corner corresponds to a 2 mm distance.
FIGURE 3
FIGURE 3
(A) Pressure distribution of the focused source (hot colormap) aligned with the centroid of a representative histology thrombus section (red = red blood cells, pink = fibrin). The color bar denotes the normalized peak negative pressure, and the scale bar denotes a 2 mm distance. (B) Representative outcome for Monte Carlo calculation. Red blood cell pixels within regions of bubble expansion were assigned to be “ablated” (white pixels). (C) For simulations of thrombolytic flow from an infusion catheter, ablated pixels were modeled as liquefaction (i.e., fluid). Viable portions of the thrombus were modeled as a porous media. The catheter served as a boundary condition in calculations of the perfusion-diffusion equation, with fluid flow of thrombolytic (700 nMol) from the catheter at a rate of 0.87 cm/s.
FIGURE 4
FIGURE 4
Representative examples of calculated ablation zones (1,000 pulses). The spatial peak, temporal peak negative pressure of the histotripsy pulse is noted along the left of each row. The ultrasound pulse propagation is from top to bottom in the image. The thrombus subgroup is noted at the top of each column.
FIGURE 5
FIGURE 5
Calculated ablation zone (white) for Half-Half thrombus using a 40 MPa peak negative pressure. Red pixels correspond to red blood cells, and pink pixels correspond to fibrin. Arrows indicate “viable” red blood cells surrounded by fibrin within the focal zone.
FIGURE 6
FIGURE 6
Computed ablation area for each representative examples in each thrombus subgroup. The pulse peak negative pressure is indicated in the legend. The error bars represent the variation for ten independent Monte Carlo calculations (N = 10 independent simulations).
FIGURE 7
FIGURE 7
(A) Box and whisker plots for the calculated thrombus ablation area (left ordinate) relative to the peak negative pressure of the histotripsy pulse. The right ordinate indicates the calculated amount of hemoglobin generated due to histotripsy exposure. The legend indicates analysis for thrombi subgroups. The ablation area is reported for calculations based on the application of 1,000 pulses. (B) Box and whisker plot for the calculated hemoglobin (Hg) generation due to histotripsy bubble activity relative to catheter insertion. The diamond is a measured value for normalized hemoglobin production for clots composed of 80.2% ± 3.3% red blood cell content (Hendley et al., 2022). For all box and whisker plots: The solid line indicates the median value, the box indicates the 25th and 75th percentiles, and the whiskers extend to the most extreme datapoints excluding outliers.
FIGURE 8
FIGURE 8
(A) Thrombus after the application of 1,000 histotripsy pulses with a peak negative pressure of 40 MPa for each thrombus subgroup. (B) FDTD calculation for the steady state distribution of rt-PA within ablated thrombus. (C) Calculated concentration of fibrin degradation products (FDP) resulting from a 20 min rt-PA exposure. Blue pixels correspond to the infusion catheter. Columns correspond to thrombus subgroups.
FIGURE 9
FIGURE 9
(A) Box and whisker plots for the computed amount of fibrin degredation product generated. Calculations were performed for the application of 1,000 histotripsy pulses. (B) Box and whisker plot for the computed fibrin degredation products relative to baseline (i.e., no histotripsy added) for each thrombus subgroup. The diamond indicates measurements for prior studies conducted in vitro with red blood cell-rich clots (Hendley et al., 2022). For box and whisker plots, the solid line indicates the median value, the box indicates the 25th and 75th percentiles, and the whiskers extend to the most extreme datapoints excluding outliers.
FIGURE 10
FIGURE 10
Representative correlations observed between hemolysis (hemoglobin) and fibrin degradation products (FDP) for each thrombus subgroup. The changes in hemoglobin and fibrinolysis occur because of the variability in bubble activity over the range of histotripsy pulse pressures investigated in this study. Error bars are included in each figure to indicate the average of ten independent Monte Carlo calculations, but are smaller than the actual markers.
FIGURE 11
FIGURE 11
(A) Box and whisker plot for the Linear Regression Coefficient between calculations for hemolysis (Monte Carlo calculation) and fibrinolysis (FDTD calculation). The solid line is the median of the data, the box extends to the 25% and 75% percentiles, and whiskers extends to the range of data not considered outliers. The circle markers are considered outliers to the data (N = 7 each for 75% fibrin and 75% red blood cell (RBC) dominant thrombi, N = 8 for Half-Half). (B) Scatter plot of the Linear Regression Coefficient for all tested thrombi relative to the fibrin concentration. The red marker is a measured Linear Regression Coefficient based on in vitro data for single-cycle histotripsy pulses (Hendley et al., 2022).

Similar articles

Cited by

References

    1. Abramowitz S. D., Kado H., Schor J., Annambhotla S., Mojibian H., Marino A. G., et al. (2023). Six-month deep vein thrombosis outcomes by chronicity: Analysis of the real-world ClotTriever outcomes registry. J. Vasc. Interv. Radiol. [Internet] 34 (5), 879–887.e4. e4. 10.1016/j.jvir.2022.12.480 - DOI - PubMed
    1. Allen S. P., Vlaisavljevich E., Shi J., Hernandez-Garcia L., Cain C. A., Xu Z., et al. (2017). The response of MRI contrast parameters in in vitro tissues and tissue mimicking phantoms to fractionation by histotripsy. Phys. Med. Biol. 62 (17), 7167–7180. 10.1088/1361-6560/aa81ed - DOI - PubMed
    1. Anthony G. J., Bollen V., Hendley S., Antic T., Sammet S., Bader K. B. (2019). Assessment of histotripsy-induced liquefaction with diagnostic ultrasound and magnetic resonance imaging in vitro and ex vivo . Phys. Med. Biol. 64 (9), 095023. 10.1088/1361-6560/ab143f - DOI - PMC - PubMed
    1. Bader K. B., Haworth K. J., Shekhar H., Maxwell A. D., Peng T., McPherson D. D., et al. (2016). Efficacy of histotripsy combined with rt-PA in vitro . Phys. Med. Biol. 61 (14), 5253–5274. 10.1088/0031-9155/61/14/5253 - DOI - PMC - PubMed
    1. Bader K. B., Holland C. K. (2016). Predicting the growth of nanoscale nuclei by histotripsy pulses. Phys. Med. Biol. 61 (7), 2947–2966. 10.1088/0031-9155/61/7/2947 - DOI - PMC - PubMed

LinkOut - more resources