. 2023 Jun 29;9(7):e17643.
doi: 10.1016/j.heliyon.2023.e17643. eCollection 2023 Jul.

A CFD-FFT approach to hemoacoustics that enables degree of stenosis prediction from stethoscopic signals

Affiliations

A CFD-FFT approach to hemoacoustics that enables degree of stenosis prediction from stethoscopic signals

Ahmed M Ali et al. Heliyon. .

Abstract

In this paper, we identify a new (acoustic) frequency-stenosis relation whose frequencies lie within the recommended auscultation threshold of stethoscopy (< 120 Hz). We show that this relation can be used to extend the application of phonoangiography (quantifying the degree of stenosis from bruits) to widely accessible stethoscopes. The relation is successfully identified from an analysis restricted to the acoustic signature of the von Karman vortex street, which we automatically single out by means of a metric we propose that is based on an area-weighted average of the Q-criterion for the post-stenotic region. Specifically, we perform CFD simulations on internal flow geometries that represent stenotic blood vessels of different severities. We then extract their emitted acoustic signals using the Ffowcs Williams-Hawkings equation, which we subtract from a clean signal (stenosis free) at the same heart rate. Next, we transform this differential signal to the frequency domain and carefully classify its acoustic signatures per six (stenosis-)invariant flow phases of a cardiac cycle that are newly identified in this paper. We then automatically restrict our acoustic analysis to the sounds emitted by the von Karman vortex street (phase 4) by means of our Q-criterion-based metric. Our analysis of its acoustic signature reveals a strong linear relationship between the degree of stenosis and its dominant frequency, which differs considerably from the break frequency and the heart rate (known dominant frequencies in the literature). Applying our new relation to available stethoscopic data, we find that its predictions are consistent with clinical assessment. Our finding of this linear correlation is also unlike prevalent scaling laws in the literature, which feature a small exponent (i.e., low stenosis percentage sensitivity over much of the clinical range). They hence can only distinguish mild, moderate, and severe cases. Conversely, our linear law can identify variations in the degree of stenosis sensitively and accurately for the full clinical range, thus significantly improving the utility of the relevant scaling laws... Future research will investigate incorporating the vibroacoustic role of adjacent organs to expand the clinical applicability of our findings. Extending our approach to more complex 3D stenotic morphologies and including the vibroacoustic role of surrounding organs will be explored in future research to advance the clinical reach of our findings.

Keywords: Acoustics; CFD; Hemodynamics; LES; Phonocardiography; Stenosis; Strouhal.


Conflict of interest statement

The authors declare that they have no known competing financial interests or personal relationships that could have appeared to influence the work reported in this paper.

Figures

Figure 1
Figure 1
Heart anatomy, per the Living Heart Human Model of Simulia, .
Figure 2
Figure 2
Methodology Proposed to Reveal Unknown Correlations between Emitted Phonocardiographic Frequencies and Stenotic Geometries.
Figure 3
Figure 3
2D flow domain representing a stenotic ascending aorta, for the case of 50% stenosis. A domain of stagnant air encloses the stenotic domain to permit sound propagation. The circle on the top right corner denotes the receiver's location. Stagnant air is at room temperature (289 K). All dimensions listed are in mm.
Figure 4
Figure 4
Inlet velocity profile at different time frames, clarifying the effect of using a spectral synthesizer at the inlet at different times, (a)-(c).
Figure 5
Figure 5
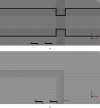
(a) The mesh for the case of 50% stenosis. (b) Zoom-in reveals the higher mesh density near the wall.
Figure 6
Figure 6
Symmetrically Pinned Eddies phase. It starts at 0.02 sec and ends at 0.06 sec, in general.
Figure 7
Figure 7
Symmetric Eddy Propagation phase. It starts at 0.06 sec and ends at 0.1 sec, in general.
Figure 8
Figure 8
Asymmetric Eddy Propagation phase. It starts at 0.1 sec and ends at 0.2 sec, in general.
Figure 9
Figure 9
Karman Vortex Street phase. It starts at 0.2 sec and ends at 0.4 sec, in general.
Figure 10
Figure 10
Karman Vortex Street (phase 4) coincides with the segment of positive slope for the area-weighted average Q-criterion in the post-stenotic region, where rotational flow progressively grows relative to the strain rate.
Figure 11
Figure 11
Fading Vortex Street phase. It starts at 0.4 sec and ends at 0.65 sec, in general.
Figure 12
Figure 12
Exiting Vortex Street phase. It starts at 0.65 sec and ends at 1 sec, in general.
Figure 13
Figure 13
Differential acoustic pressure signal (Pa) against time (Sec.). Comparison between (a) 30% , (b) 50% , and (c) 80% stenosis cases, subtracted from a non-stenotic signal at the same heart rate (1 Hz).
Figure 14
Figure 14
(a) The differential acoustic pressure signal for 50% stenosis, (b) its transformation to the frequency domain using FFT, and (c) restricting the FFT transformation to the acoustic signature of the KVS phase (t=0.2 to t=0.4 sec).
Figure 15
Figure 15
For the Case of 50% Stenosis, first FFT of the entire acoustic signal is introduced (a), then from (b) to (g), the FFT of each phase is shown. Note that the dominant frequency for each phase is the one with the highest amplitude.
Figure 16
Figure 16
Dominant frequency of vortex shedding (acoustic) vs. stenosis percentage.
Figure 17
Figure 17
Clinical differential signal for method validation. (a) shows the differential acoustic signal in the time domain, (b) its FFT, (c) the FFT of the cinical signal restricted to the time-frame of 0.2 s to 0.4 s, and (d) the corresponding FFT of the KVS phase we simulated at 80% stenosis for comparison to the clinical FFT in the same timeframe.
Figure A.1
Figure A.1
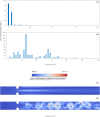
FFT and Contour plots of 50% stenosis comparing K-omega (URANS) and LES; (a) represent the results obtained from the k-omega simulation and (b) the results obtained from the LES simulation. URANS yields an incorrect acoustic signature for the KVS phase, being unable to resolve its flow structures.
Figure A.2
Figure A.2
Acoustic Pressure Signal vs. Time for stenotic artery, degree of stenosis varies from 30% blockage to 80% blockage.
Figure A.3
Figure A.3
FFT of the acoustic pressure signal, (a) No stenosis, (b) 30% Stenosis, (C) 50% Stenosis, (d) 70% Stenosis.
Figure A.4
Figure A.4
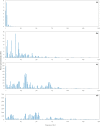
FFT of the acoustic pressure signal from time t=0.2 s to t=0.4 s (vortex start till end), (a) No Stenosis, (b) 30% Stenosis, (C) 50% Stenosis, (d) 70% Stenosis.

Similar articles

Cited by

References

    1. Kanter K.R., Kogon B.E., Kirshbom P.M. Supra annular mitral valve replacement in children. Ann. Thorac. Surg. 2011;92(6):2221–2229. doi: 10.1016/j.athoracsur.2011.06.023. internal-pdf://j.athoracsur. 2011.06.023_1.pdf. - DOI - PubMed
    1. Wren C., Oslizlok P., Bull C. Natural history of supravalvular aortic stenosis and pulmonary artery stenosis. J. Am. Coll. Cardiol. 1990;15(7):1625–1630. doi: 10.1016/0735-1097(90)92837-R. - DOI - PubMed
    1. Saric M., Kronzon I. Aortic atherosclerosis and embolic events. Curr. Cardiol. Rep. 2012;14(3):342–349. doi: 10.1007/s11886-012-0261-2. internal-pdf://s11886-012-0261-2_3.pdf. - DOI - PubMed
    1. Peshkova I.O., Schaefer G., Koltsova E.K. Atherosclerosis and aortic aneurysm - is inflammation a common denominator? FEBS J. 2016;283(9):1636–1652. doi: 10.1111/febs.13634. internal-pdf://febs. 13634_4.pdf. - DOI - PubMed
    1. von Reutern G.-M., Goertler M.-W., Bornstein N.M., Sette M.D., Evans D.H., Goertler M.-W., Hetzel A., Kaps M., Perren F., Razumovky A. Grading carotid stenosis using ultrasonic methods. Stroke. 2012;43(3):916–921. - PubMed

LinkOut - more resources