. 2023 Jun 28:14:1161869.
doi: 10.3389/fimmu.2023.1161869. eCollection 2023.

Targeting immunosuppressive Ly6C+ classical monocytes reverses anti-PD-1/CTLA-4 immunotherapy resistance

Affiliations

Targeting immunosuppressive Ly6C+ classical monocytes reverses anti-PD-1/CTLA-4 immunotherapy resistance

B Leticia Rodriguez et al. Front Immunol. .

Abstract

Introduction: Despite significant clinical advancement with the use of immune checkpoint blockade (ICB) in non-small cell lung cancer (NSCLC) there are still a major subset of patients that develop adaptive/acquired resistance. Understanding resistance mechanisms to ICB is critical to developing new therapeutic strategies and improving patient survival. The dynamic nature of the tumor microenvironment and the mutational load driving tumor immunogenicity limit the efficacy to ICB. Recent studies indicate that myeloid cells are drivers of ICB resistance. In this study we sought to understand which immune cells were contributing to resistance and if we could modify them in a way to improve response to ICB therapy.

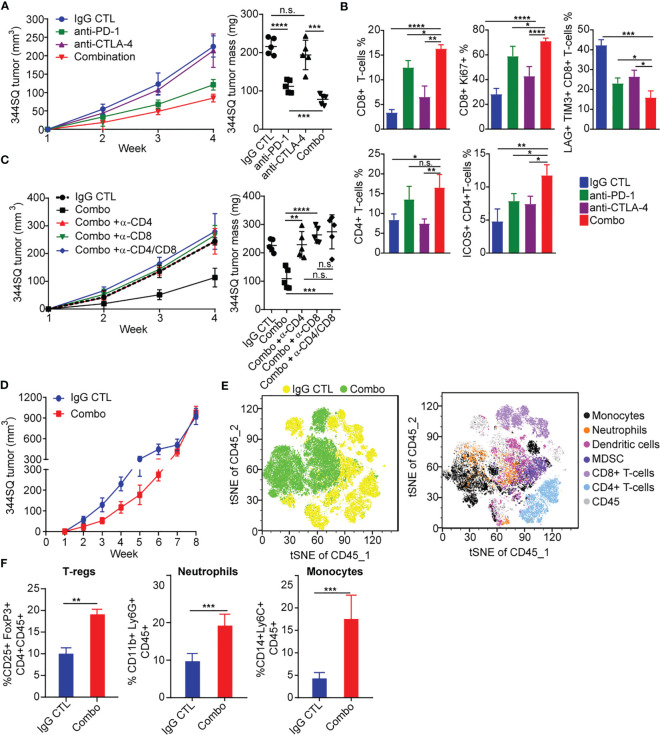
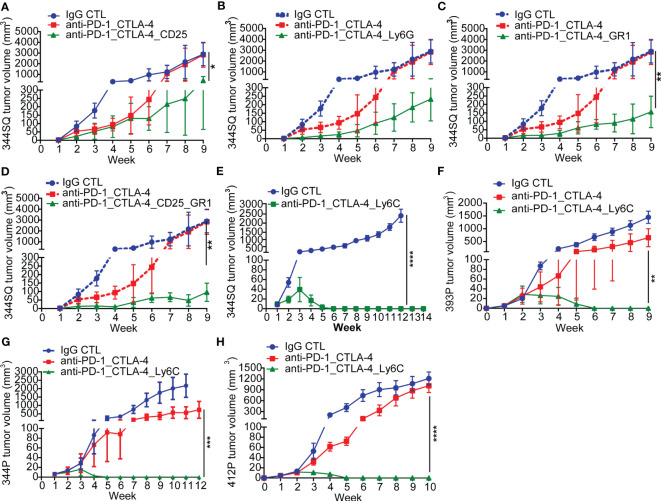
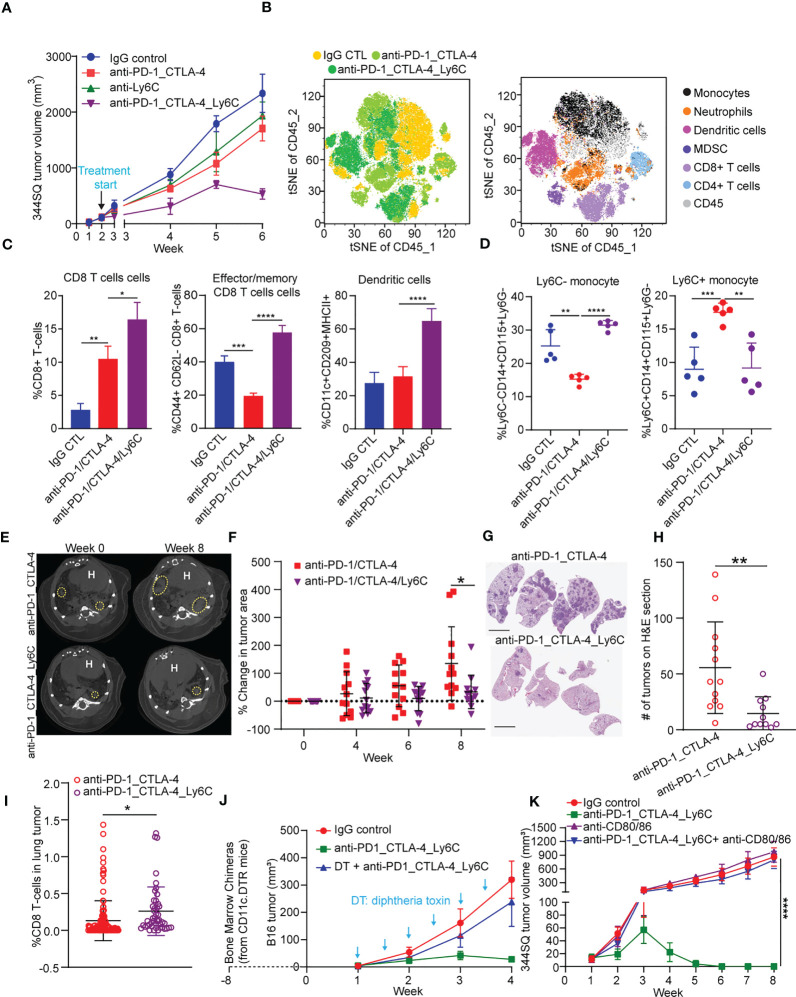
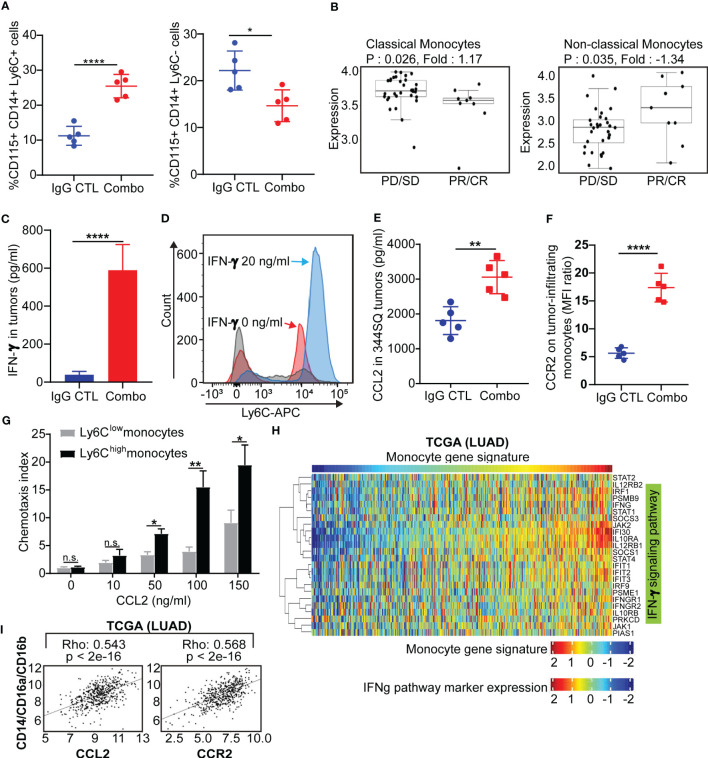
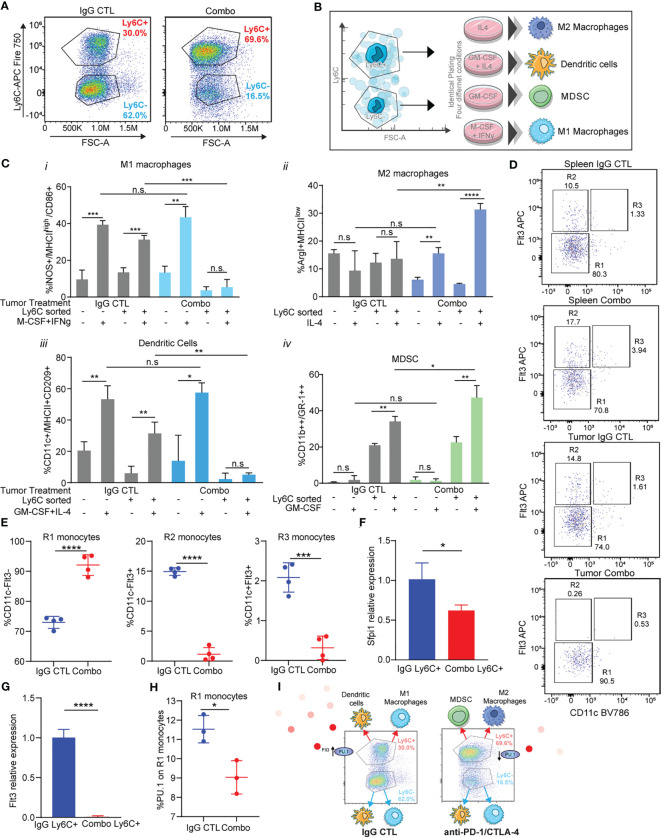
Results: Our results show that combination anti-PD-1/CTLA-4 produces an initial antitumor effect with evidence of an activated immune response. Upon extended treatment with anti-PD-1/CTLA-4 acquired resistance developed with an increase of the immunosuppressive populations, including T-regulatory cells, neutrophils and monocytes. Addition of anti-Ly6C blocking antibody to anti-PD-1/CTLA-4 was capable of completely reversing treatment resistance and restoring CD8 T cell activity in multiple KP lung cancer models and in the autochthonous lung cancer KrasLSL-G12D/p53fl/fl model. We found that there were higher classical Ly6C+ monocytes in anti-PD-1/CTLA-4 combination resistant tumors. B7 blockade illustrated the importance of dendritic cells for treatment efficacy of anti-Ly6C/PD-1/CTLA-4. We further determined that classical Ly6C+ monocytes in anti-PD-1/CTLA-4 resistant tumors are trafficked into the tumor via IFN-γ and the CCL2-CCR2 axis. Mechanistically we found that classical monocytes from ICB resistant tumors were unable to differentiate into antigen presenting cells and instead differentiated into immunosuppressive M2 macrophages or myeloid-derived suppressor cells (MDSC). Classical Ly6C+ monocytes from ICB resistant tumors had a decrease in both Flt3 and PU.1 expression that prevented differentiation into dendritic cells/macrophages.

Conclusions: Therapeutically we found that addition of anti-Ly6C to the combination of anti-PD-1/CTLA-4 was capable of complete tumor eradication. Classical Ly6C+ monocytes differentiate into immunosuppressive cells, while blockade of classical monocytes drives dendritic cell differentiation/maturation to reinvigorate the anti-tumor T cell response. These findings support that immunotherapy resistance is associated with infiltrating monocytes and that controlling the differentiation process of monocytes can enhance the therapeutic potential of ICB.

Keywords: PD-1/CTLA-4 immunotherapy; immunotherapy; monocytes; myeloid cells; resistance.


Conflict of interest statement

DG serves on scientific advisory committees for AstraZeneca, GlaxoSmithKline, Sanofi, Menarini Ricerche, 4D Pharma, Onconova, Eli Lilly and Janssen and has received research support from Janssen, Takeda, Ribon Therapeutics, Astellas, NGM Biopharmaceuticals, Boehringer Ingelheim and AstraZeneca. Author XY was employed by Bellicum Pharmaceuticals. The remaining authors declare that the research was conducted in the absence of any commercial or financial relationships that could be construed as a potential conflict of interest.

Figures

Figure 1
Figure 1
PD-1 and CTLA-4 blockade produces an initial antitumor effect with development of acquired resistance upon extended treatment (A) anti-PD-1 (200 µg per mouse), anti-CTLA-4 (200 µg per mouse), combination (200 µg of anti-PD-1 plus 200 µg of anti-CTLA-4), or their IgG control mixture was intraperitoneally injected into 129/Sv mice once a week for 3 weeks beginning on day 7 after 344SQ lung cancer cells were subcutaneously implanted (0.1 x 10⁶ cells per mouse). Tumors were measured once a week for 4 weeks. The tumor growth curves are shown in the left panel. Tumor weight at week 4 shown on right panel. (B) Tumors from (A) were harvested at the end point. The indicated immune markers were determined by FACS analysis and summarized data is shown as percentage of CD8, CD8+/Ki-67, Lag3+/Tim3+/CD8+, total CD4 T-cells, and ICOS+/CD4 T-cells. (C) 129/Sv mice were intraperitoneally injected with 400 µg per mouse of anti-CD4 (α -CD4), anti-CD8 (α -CD8), or anti-CD4 plus anti-CD8 (α -CD4/CD8) antibody when 344SQ cancer cells were injected. 200 µg of T cell depletion antibody per mouse was injected into the mice once weekly for 3 weeks to maintain T cell depletion. Mice were treated with combined anti-PD-1 and anti-CTLA-4 (Combination: 200 µg of anti-PD-1 plus 200 µg of anti-CTLA-4 per mouse) beginning on day 7 after a subcutaneous 344SQ cancer cell injection (0.1 x 10⁶ cells per mouse; n = 5) for 3 weeks. The tumor growth was monitored once a week for 4 weeks. The tumor growth curves are shown on the left and the tumor weights are shown on the right. (D) 129/Sv mice were treated weekly with combined anti-PD-1 and anti-CTLA-4 (Combination: 200 µg of anti-PD-1 plus 200 µg of anti-CTLA-4 per mouse) or their IgG control mixture (IgG control) beginning on day 7 after a subcutaneous 344SQ cancer cell injection (0.1 x 10⁶ cells per mouse; n = 5) for 7 weeks. The tumor growth was monitored once a week for 8 weeks. The tumor growth curves are shown. (E) tSNE CD45 plots shown from 344SQ tumors obtained from week 8 from IgG control or combo treated 129/Sv mice from (D). (F) The enrichment of CD45+CD4+CD25+FoxP3+ T-Regulatory cells, CD45+CD3-CD11b+Ly6G+ neutrophils, and CD45+CD3-CD14+Ly6C+ monocyte cells in tumors were analyzed by FACS. p values were calculated with t-test. n.s., no significant difference; *p < 0.05; **p < 0.01; ***p < 0.001; ****p < 0.0001.
Figure 2
Figure 2
Anti-PD-1_CTLA-4 treatment resistance is eradicated by anti-Ly6C antibody treatment. (A-H) 129/Sv mice (n = 5) were treated weekly with indicated antibodies beginning on day 7 after a subcutaneous cancer cell injection (0.1 x 10⁶ 344SQ cells, 1 x 10⁶ 344P cells, 2 x 10⁶ 393P cells, or 1 x 10⁶ 412P cells per mouse). Dosage of all animal studies: 200 µg of anti-PD-1, 200 µg of anti-CTLA-4, 150 µg of anti-CD25, 300 µg of anti-Gr-1, 250 µg of anti-Ly6G, 200 µg of anti-Ly6C per mouse per injection. p values were calculated with t-test. n.s., no significant difference; *p < 0.05; **p < 0.01; ***p < 0.001; ****p < 0.0001.
Figure 3
Figure 3
Anti-PD-1/CTLA-4/Ly6C treatment reduces tumor growth and increases CD8 T cells/dendritic cells. (A) 344SQ tumor bearing 129/Sv mice were weekly treated with anti-PD-1_CTLA-4 (200 µg of anti-PD-1 plus 200 µg of anti-CTLA-4 per mouse), anti-Ly6C alone (200 µg of anti-Ly6C per mouse), anti-PD-1_CTLA-4_Ly6C (200 µg of anti-PD-1 plus 200 µg of anti-CTLA-4 plus 200 µg of anti-Ly6C per mouse), or their IgG control mixture (IgG control) beginning on week 2 after a subcutaneous cancer cell injection (1 x 10⁶ cells per mouse; n = 5) for 4 weeks. Mice received total of 4 treatments starting at week 2 post tumor cell implantation. (B) tSNE CD45 plots from 344SQ tumors treated with IgG control, anti-PD-1_CTLA-4, or anti-PD-1_CTLA-4_Ly6C from (A). Tumors from (A) were harvested to prepare single cell suspensions for FACS analysis. (C) Percentages of CD8 T cells (left), Effector/memory CD8 T cells (middle), and dendritic cells (right). (D) Percentage of Ly6C- (left) and Ly6C+ (right) CD14+CD115+ monocytes. KrasLSL-G12D/p53fl/fl mice generated through intratracheal administration of adenovirus expressing Cre recombinase were treated with either anti-PD-1/CTLA-4 or anti-PD-1/CTLA-4/Ly6C for 8 weeks (E) Micro-CT images shown at week 0 (baseline) and week 8 (endpoint) for anti-PD-1/CTLA-4 or anti-PD-1/CTLA-4/Ly6C. Dashed yellow circles indicate lung tumors. H indicates of heart. (F) Percentage change of tumor area was calculated taking into account prior time point and normalized to the baseline measurement. (G) H&E stained lung sections at week 8 from anti-PD-1/CTLA-4 or anti-PD-1/CTLA-4/Ly6C treated mice from (E). bar= 5 mm. (H) Number of lung tumors on H&E sections from (G) treated with anti-PD-1/CTLA-4 or anti-PD-1/CTLA-4/Ly6C weekly for 8 weeks. (I) IHC of CD8 stained lung tumors from (F) week 8. Percentage of CD8 T cells found in the lung tumors from KrasLSL-G12D/p53fl/fl mice treated for 8 weeks with anti-PD-1/CTLA-4 or anti-PD-1/CTLA-4/Ly6C. (J) The dendritic cells from CD11c-DTR mice were transferred into C57BL/6 mice to generate the chimerical mice, after 8-week stabilization, the mice were treated with diphtheria toxin twice a week to maintain the depletion of dendritic cells. The B16 melanoma-bearing mice were treated weekly with anti-PD-1_CTLA-4_Ly6C for 3 weeks staring on week 1 after tumor cells inoculation. (K) 344SQ tumor bearing 129/Sv mice were treated weekly with blockade of PD-1, CTLA-4, and Ly6C (200 µg of anti-PD-1 plus 200 µg of anti-CTLA-4 plus 200 µg of anti-Ly6C per mouse) or their IgG control mixture (IgG control) beginning on day 7 after a subcutaneous cancer cell injection (0.1 x 10⁶ cells per mouse; n = 5) for 4 weeks. For blocking B7 signal, antibodies (anti-B7: 300 μg of anti-CD80 and 300 μg of anti-CD86 per mouse) were intraperitoneally administered 1 day before the first dose of therapy, and then once a week to maintain the blockade. ANOVA test was used to analyze the data. n.s., not significance; *p < 0.05; **p < 0.01; ***p< 0.001; ****p < 0.0001.
Figure 4
Figure 4
Classical Ly6C+ monocytes in anti-PD-1/CTLA-4 resistant tumors is mediated by IFN-γ and the CCL2-CCR2 axis (A) 129/Sv mice were treated weekly with combined anti-PD-1 and anti-CTLA-4 (Combination: 200 µg of anti-PD-1 plus 200 µg of anti-CTLA-4 per mouse) or their IgG control mixture (IgG control) beginning on day 7 after a subcutaneous 344SQ cancer cell injection (0.1 x 10⁶ cells per mouse; n = 5) for 7 weeks. FACS analysis from intertumoral monocytes CD115+CD14+ monocytes and Ly6C+ (left) or Ly6C- (right). (B) Classical monocytes and non-classical monocytes from melanoma nivolumab treated patients (GSE91061). (C) 129/Sv mice were treated weekly with combined anti-PD-1 and anti-CTLA-4 (Combination: 200 µg of anti-PD-1 plus 200 µg of anti-CTLA-4 per mouse) or their IgG control mixture (IgG control) beginning on day 7 after a subcutaneous 344SQ cancer cell injection (0.1 x 10⁶ cells per mouse; n = 5) for 7 weeks. The IFN-γ concentrations in tumors were measured by ELISA assay. (D) The monocytes were sorted (CD45+CD11b+CD115+Ly6G- for sorting) from untreated 344SQ tumors. 10,000 monocytes were plated in the 12-well plate. After 12 hrs of IFN-γ (20 ng/ml) stimulation, the expression of Ly6C on monocytes was analyzed by FACS. The experiments were repeated at least three times. The representative histograms are shown. (E) The CCL2 concentrations in tumors treated with IgG CTL or combo treatment were measured by ELISA assay. (F) Monocytes from IgG CTL or combo treated 344SQ tumors were harvested at week 7 and FACS for analyzing CCR2 expression on total monocytes. (G) The sorted Ly6Chigh or Ly6Clow monocytes from 344SQ tumors were added to the upper chamber of the transwell (1 × 10⁴ cells/transwell) in the presence of CCL2 with indicated concentrations. Transwell plates were incubated at 37 °C for 90 minutes. The transmigrated cells were collected from the lower chamber and analyzed by a flow cytometer. The chemotaxis index represents the fold increase in the number of migrated cells in response to CCL2 over the spontaneous cell migration. (H) Heat map of association between the mRNA levels of human monocyte gene signature and IFNγ pathway in the TCGA lung adenocarcinoma (n = 1008). Spearman correlation with adjusted p value < 0.05 was used as the criteria to select the most significant IFN-γ-related markers for generating the heat map. (I) Spearman’s rank correlation (Rho) was used to assess the association between CCL2/CCR2 and human monocyte marker expression in lung cancer patients’ samples from TCGA (LUAD). The results are shown with t-test. n.s., no significant difference; *p < 0.05; **p < 0.01; ****p < 0.0001.
Figure 5
Figure 5
Immunotherapy resistant Ly6C+ monocytes have decreased antigen presenting cell differentiation capacity due to loss of Flt3/PU.1. (A) Tumor-infiltrating monocytes sorted from 344SQ tumors treated with IgG control or combo (anti-PD-1/CTLA-4) are classified into two populations: Ly6C+monocytes and Ly6C-monocytes. (B) The trans-differentiation assay scheme. (C) The differentiation assays were performed under different conditions. The percent of M1 macrophage, M2 macrophage, MDSC, or dendritic cell in total monocytes were analyzed with their markers by FACS at the end points. (D) heterogeneity of intertumoral Ly6C+ monocytes from 344SQ tumors treated with IgG CTL or combo (anti-PD-1/CTLA-4) for 7 weeks. Flt3 and CD11c flow dot plots were used to characterize Ly6C+ monocytes. R1, R2, and R3 gates are found in box gates. (E) Percentage of R1 monocytes CD11c-Flt3-, R2 monocytes CD11c-Flt3+, and R3 monocytes CD11c+Flt3+ from Ly6C+ intertumoral monocytes treated with IgG CTL or combo until week 7. (F) qPCR of Sfpi1 from Ly6C+ FACS sorted monocytes from IgG CTL or combo (anti-PD-1/CTLA-4) treated tumors. (G) qPCR of Flt3 from Ly6C+ FACS sorted monocytes from IgG CTL or combo (anti-PD-1/CTLA-4) treated tumors. (H) Intracellular percentage of PU.1 levels on R1 monocytes from Ly6C+ FACS sorted monocytes from IgG CTL or combo (anti-PD-1/CTLA-4) treated tumors. (I) schematic showing differentiation results from (C) and loss of Flt3/PU.1 in the combo (anti-PD-1/CTLA-4) resistant Ly6C+ monocytes. ANOVA test is shown. n.s., no significant difference; *p < 0.05; **p < 0.01; ***p < 0.001; ****p < 0.0001.

References

    1. Reck M, Rodríguez-Abreu D, Robinson AG, Hui R, Csőszi T, Fülöp A, et al. . Pembrolizumab versus chemotherapy for PD-L1–positive non–Small-Cell lung cancer. New Engl J Med (2016) 375(19):1823–33. doi: 10.1056/NEJMoa1606774 - DOI - PubMed
    1. Mok TSK, Wu YL, Kudaba I, Kowalski DM, Cho BC, Turna HZ, et al. . Pembrolizumab versus chemotherapy for previously untreated, PD-L1-expressing, locally advanced or metastatic non-small-cell lung cancer (KEYNOTE-042): a randomised, open-label, controlled, phase 3 trial. Lancet (2019) 393(10183):1819–30. doi: 10.1016/S0140-6736(18)32409-7 - DOI - PubMed
    1. Gandhi L, Rodríguez-Abreu D, Gadgeel S, Esteban E, Felip E, De Angelis F, et al. . Pembrolizumab plus chemotherapy in metastatic non-Small-Cell lung cancer. N Engl J Med (2018) 378(22):2078–92. doi: 10.1056/NEJMoa1801005 - DOI - PubMed
    1. Carbone DP, Reck M, Paz-Ares L, Creelan B, Horn L, Steins M, et al. . First-line nivolumab in stage IV or recurrent non-Small-Cell lung cancer. N Engl J Med (2017) 376(25):2415–26. doi: 10.1056/NEJMoa1613493 - DOI - PMC - PubMed
    1. Hellmann MD, Paz-Ares L, Bernabe Caro R, Zurawski B, Kim SW, Carcereny Costa E, et al. . Nivolumab plus ipilimumab in advanced non-Small-Cell lung cancer. N Engl J Med (2019) 381(21):2020–31. doi: 10.1056/NEJMoa1910231 - DOI - PubMed

Publication types