. 2023 Aug 4;133(4):313-329.
doi: 10.1161/CIRCRESAHA.123.323029. Epub 2023 Jul 14.

Loss of the Atrial Fibrillation-Related Gene, Zfhx3, Results in Atrial Dilation and Arrhythmias

Affiliations

Loss of the Atrial Fibrillation-Related Gene, Zfhx3, Results in Atrial Dilation and Arrhythmias

Heather S Jameson et al. Circ Res. .

Abstract

Background: ZFHX3 (zinc finger homeobox 3), a gene that encodes a large transcription factor, is at the second-most significantly associated locus with atrial fibrillation (AF), but its function in the heart is unknown. This study aims to identify causative genetic variation related to AF at the ZFHX3 locus and examine the impact of Zfhx3 loss on cardiac function in mice.

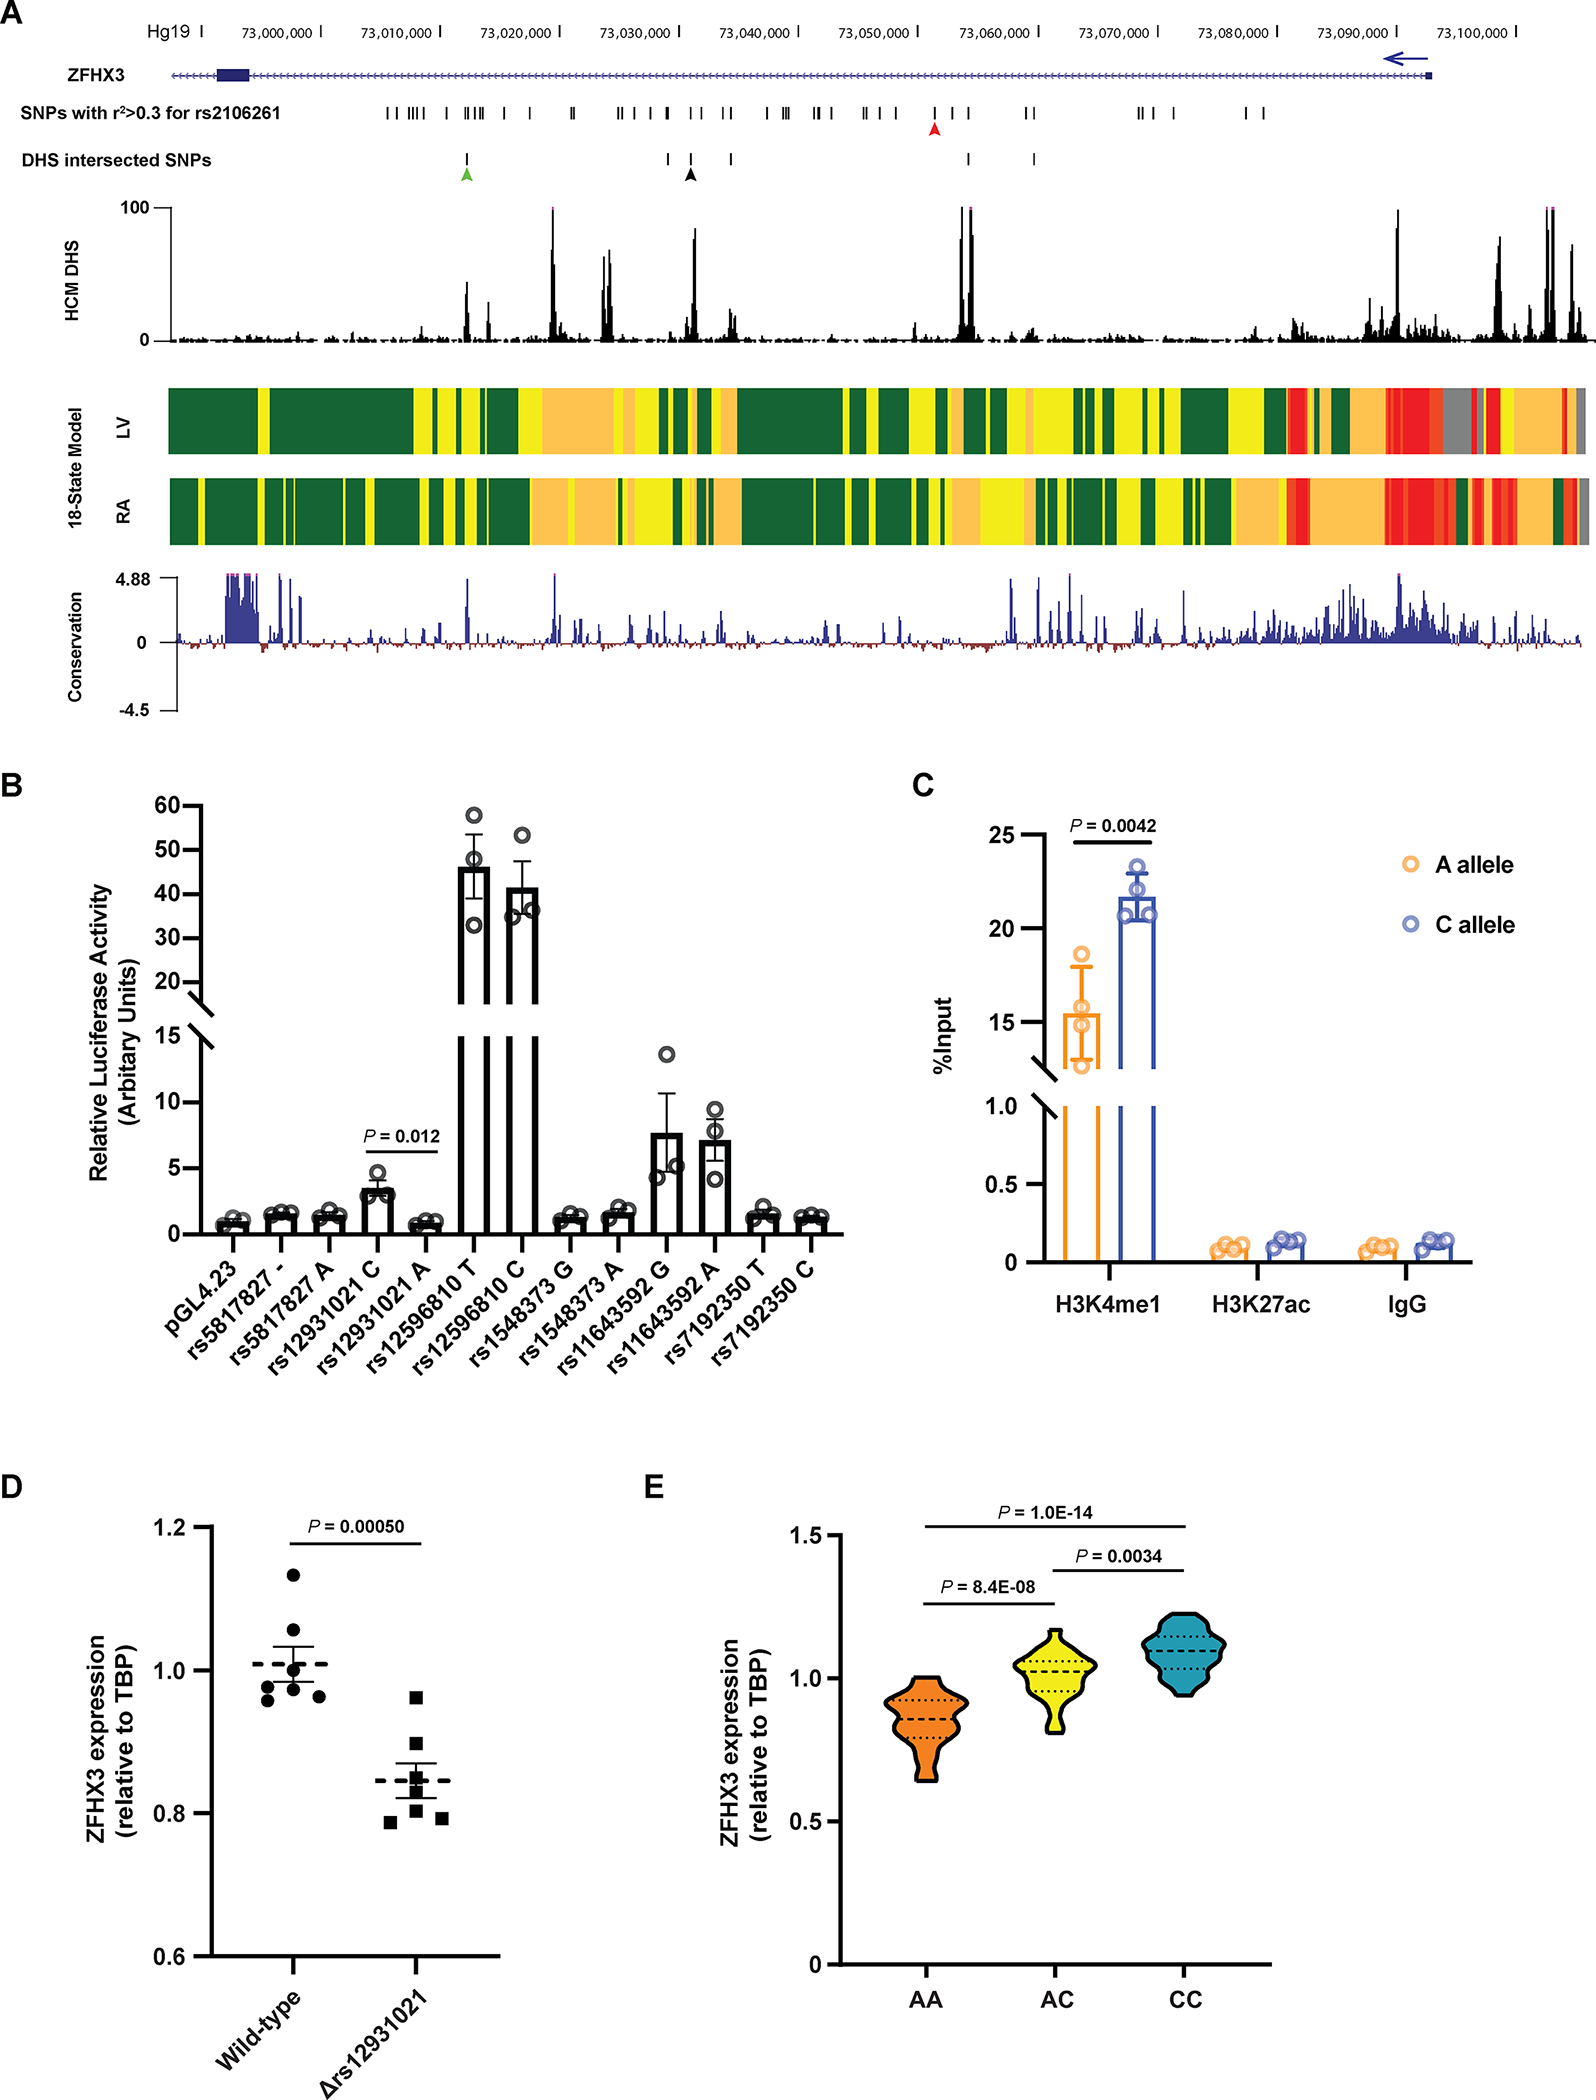
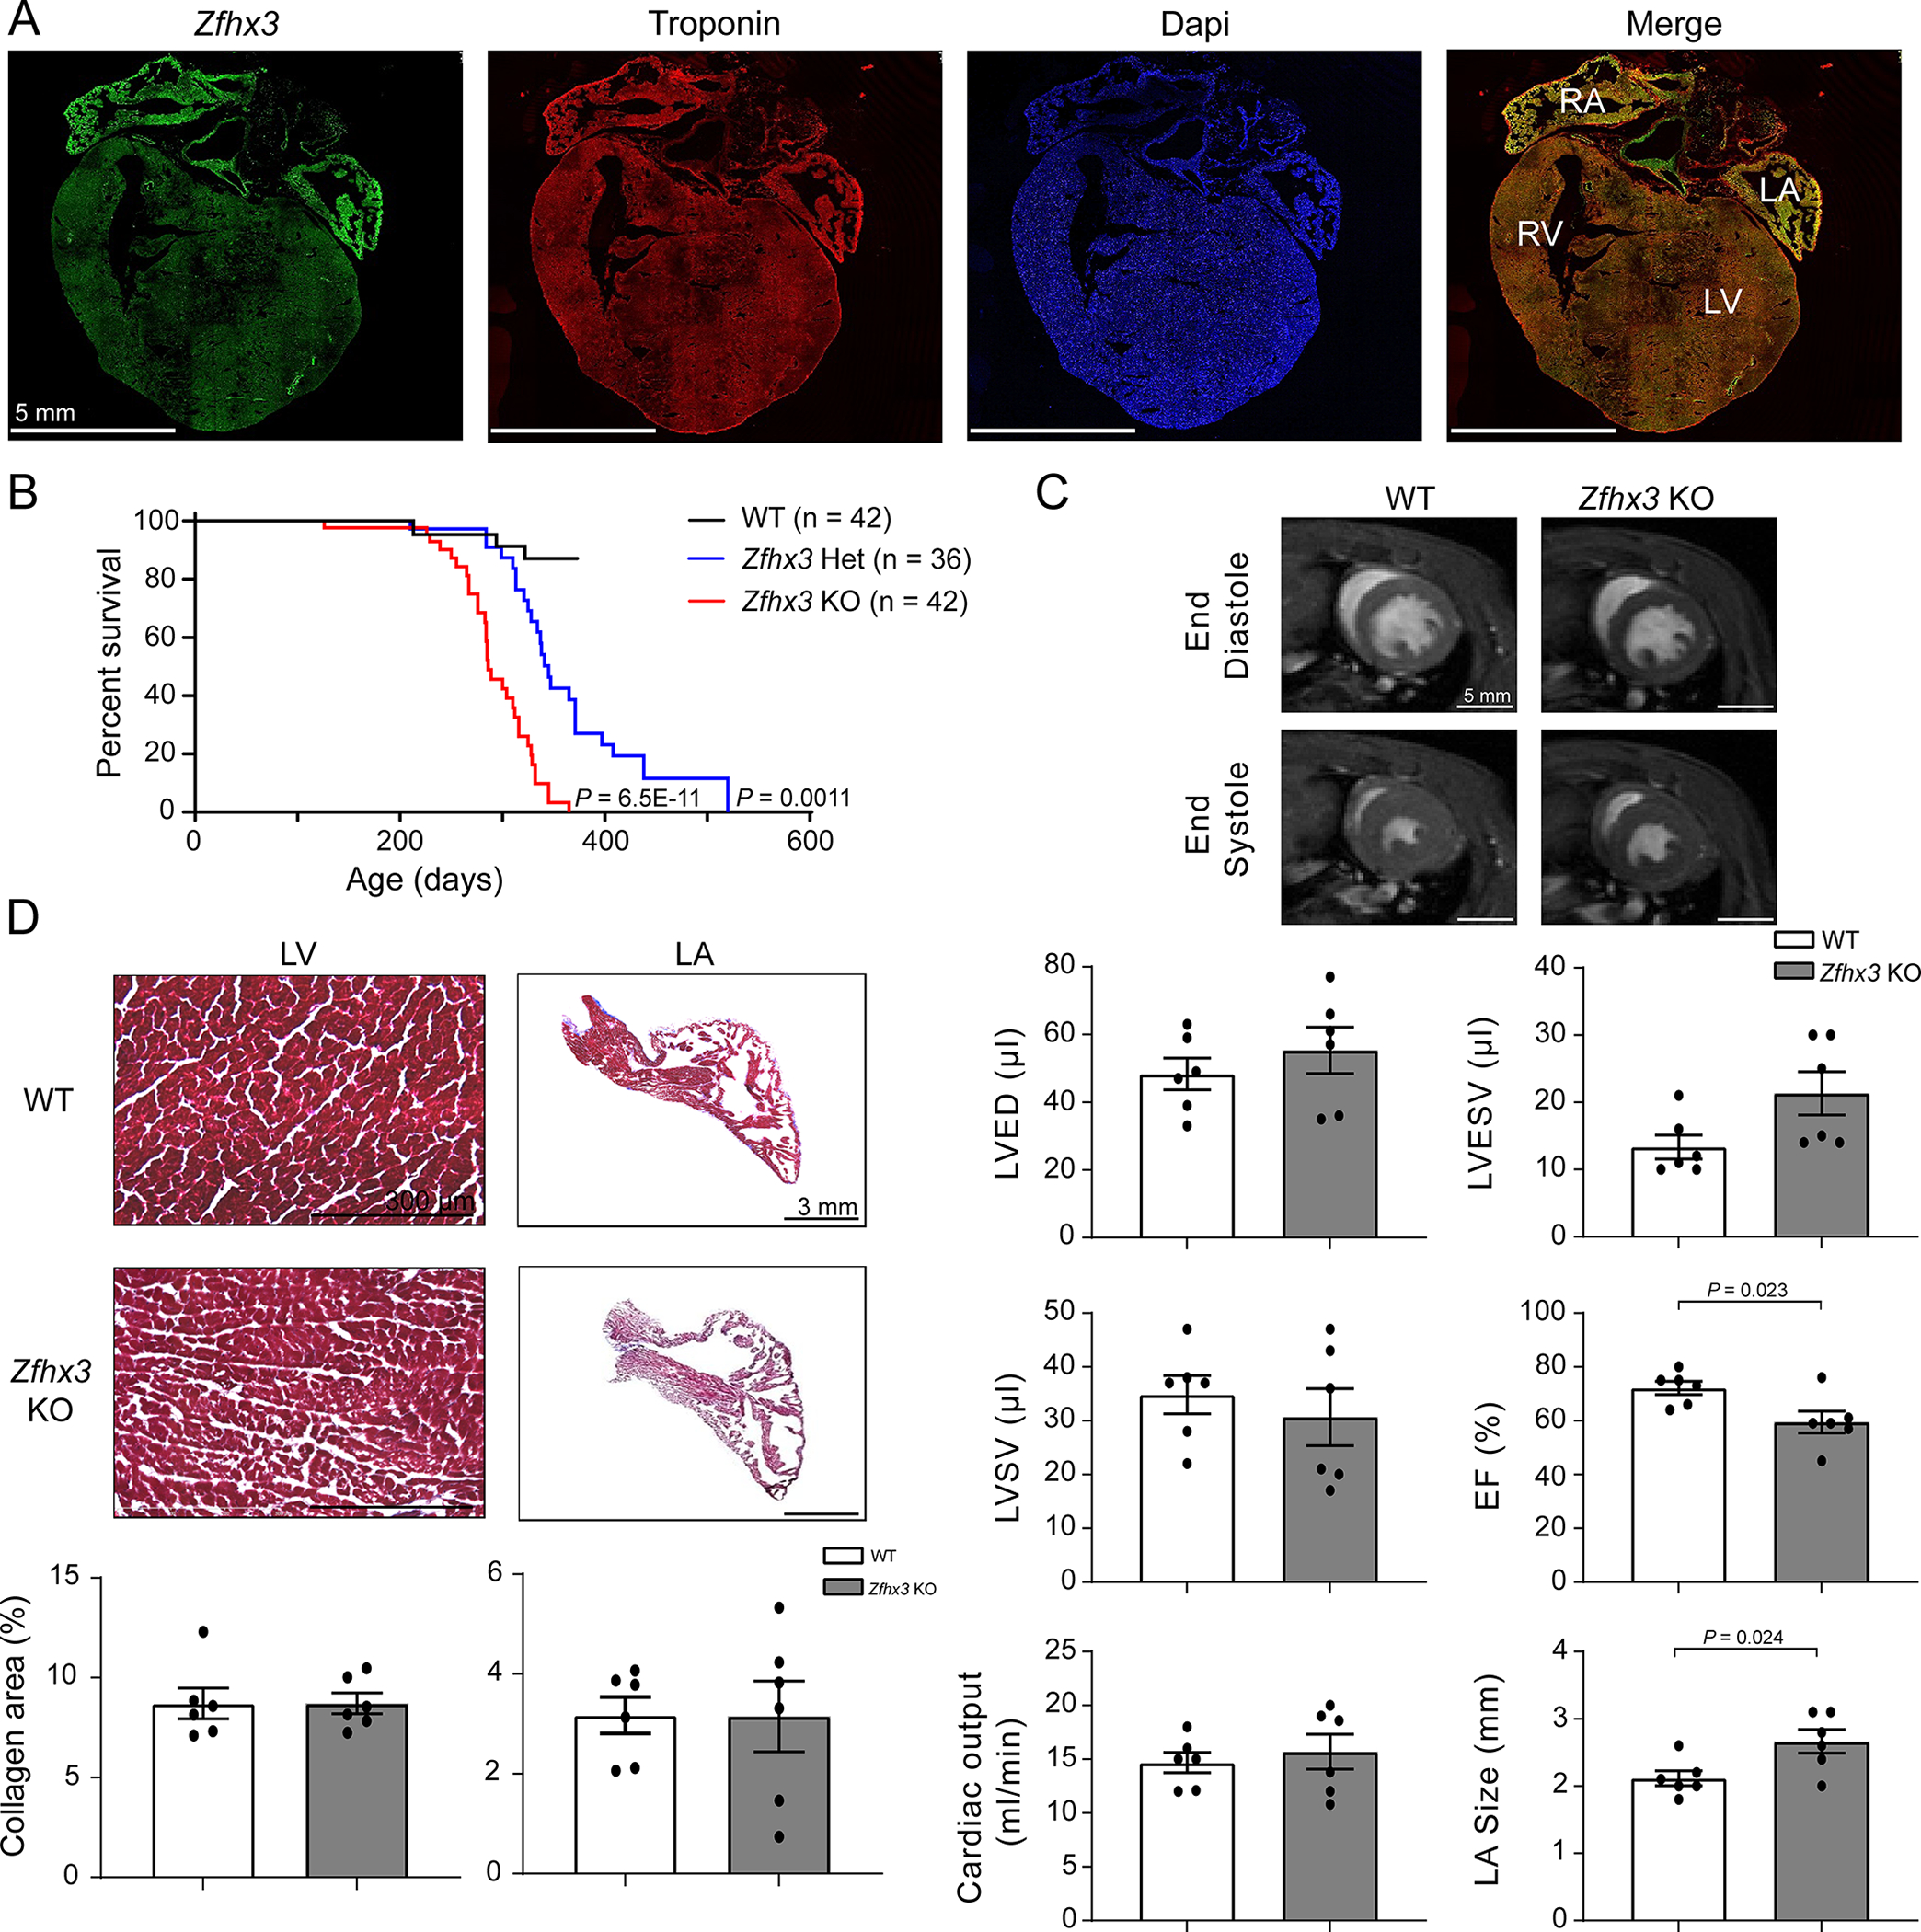
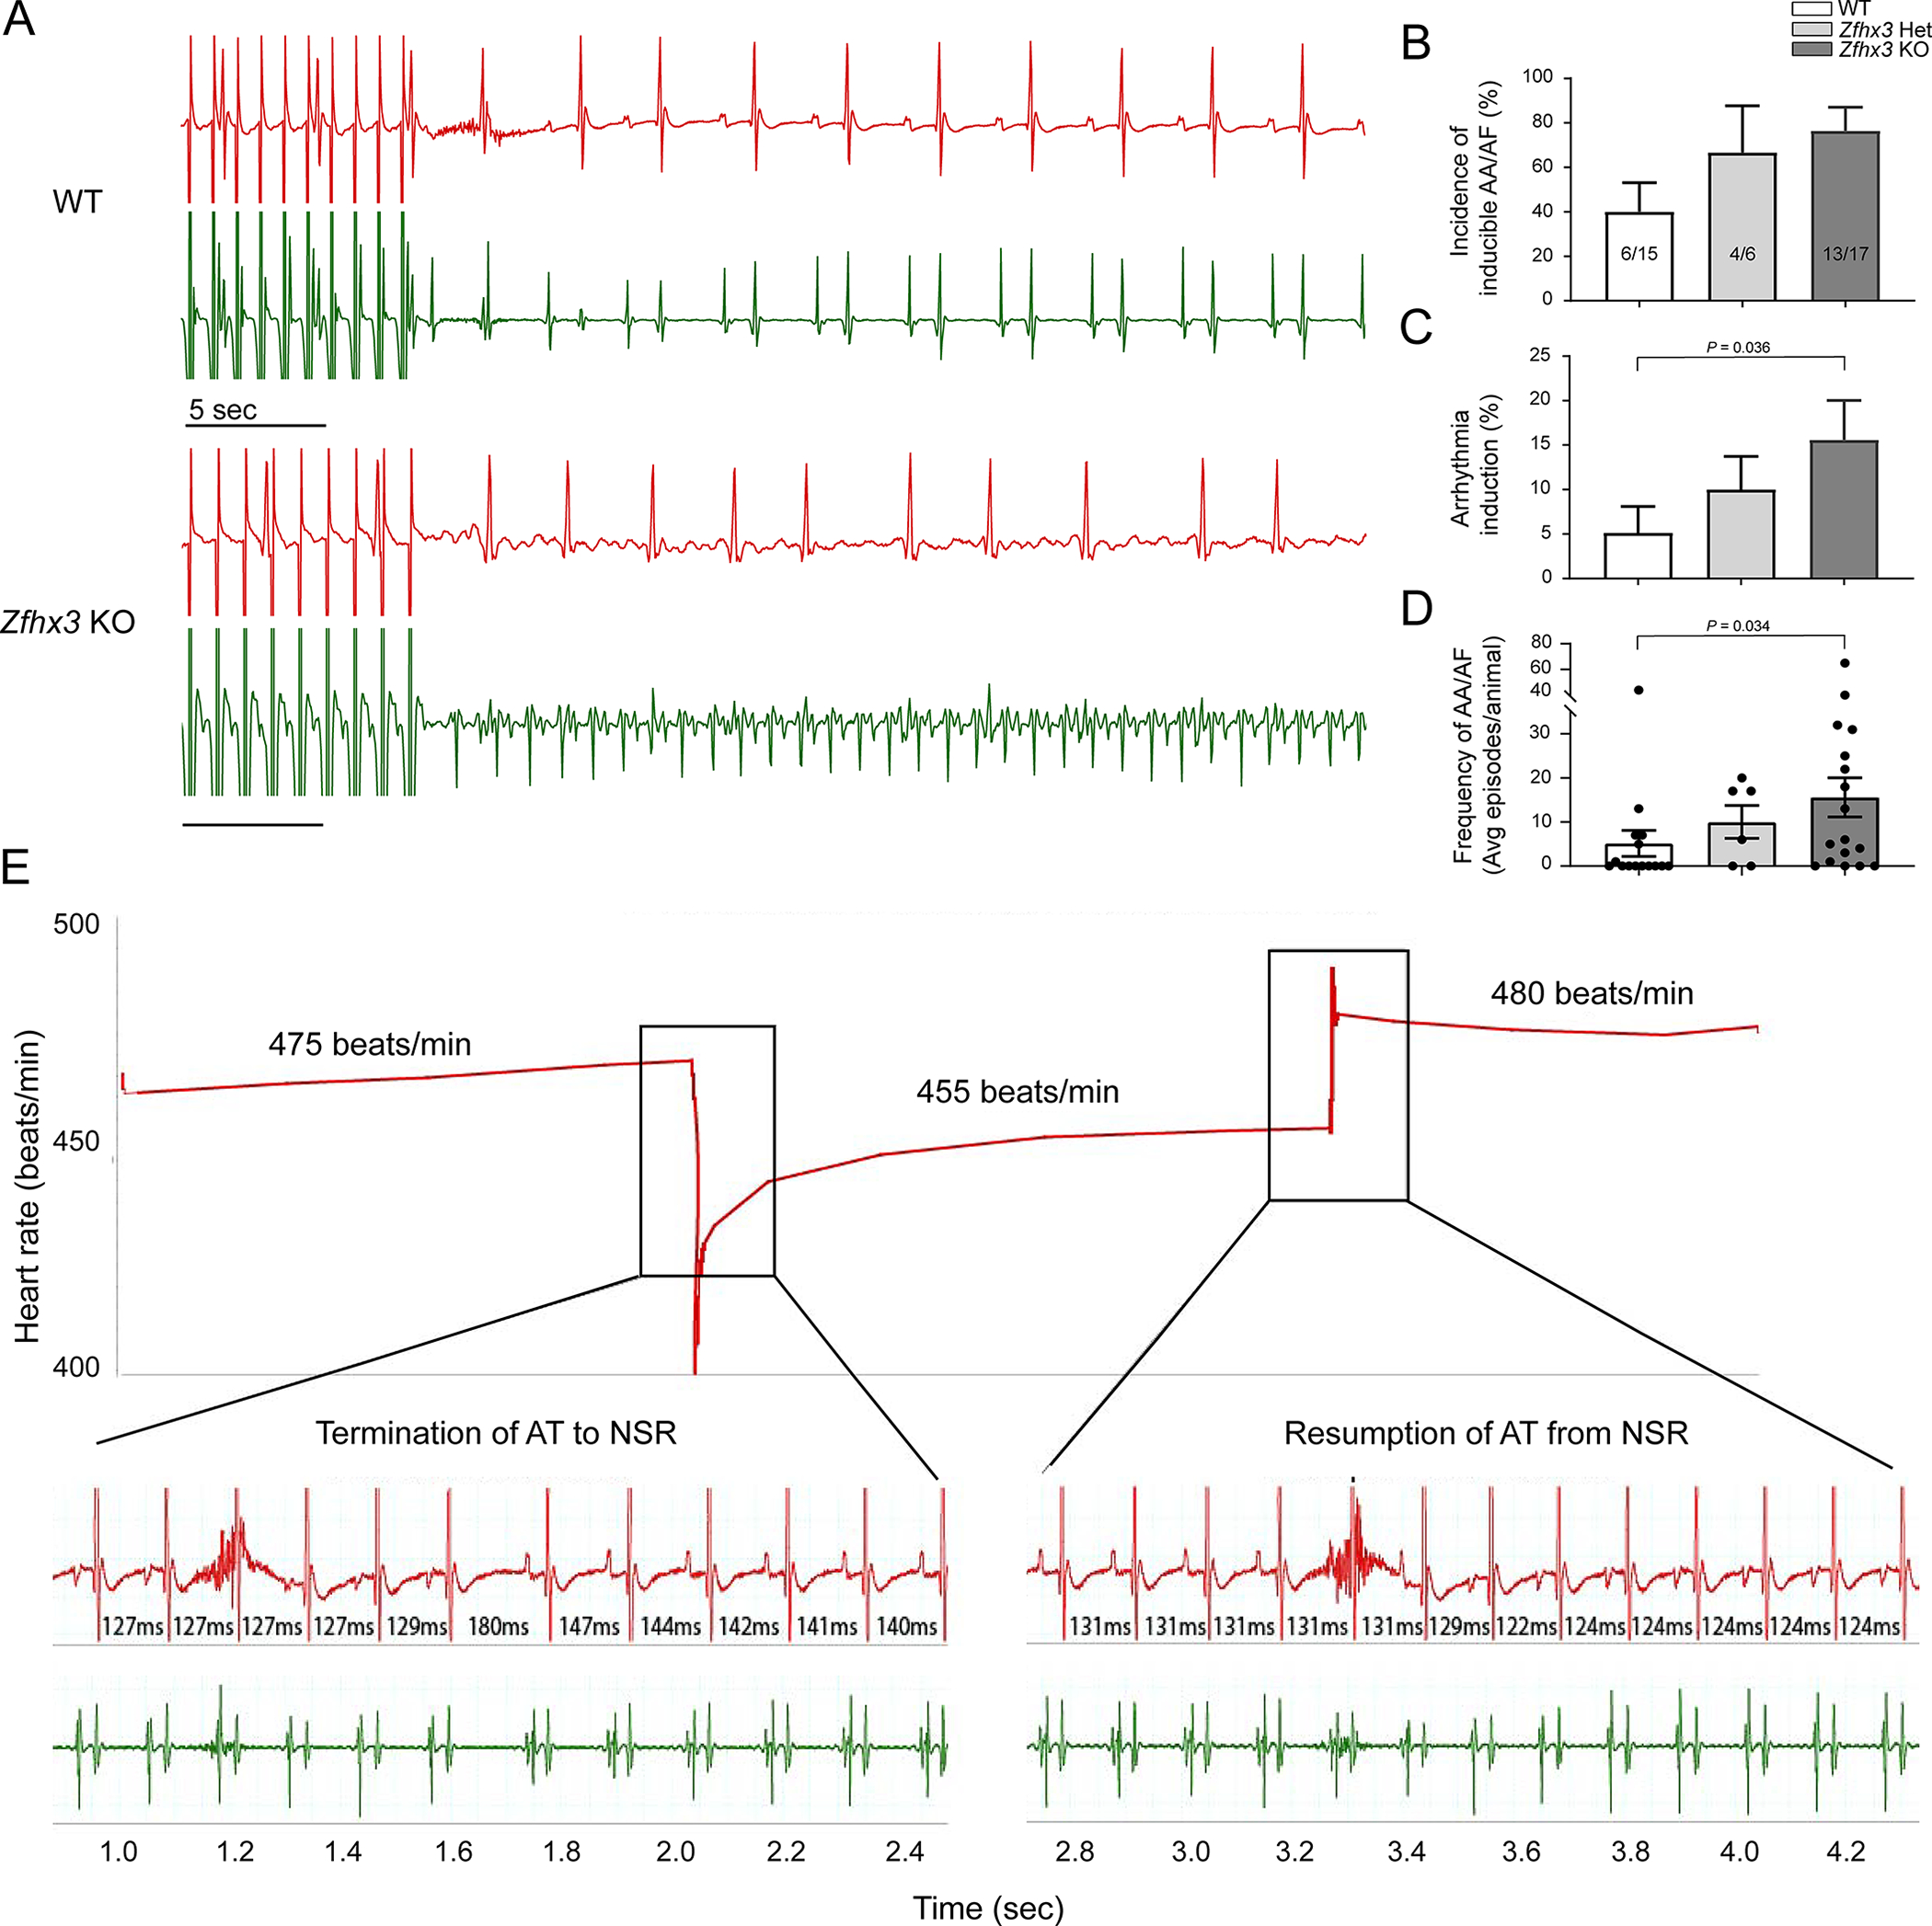
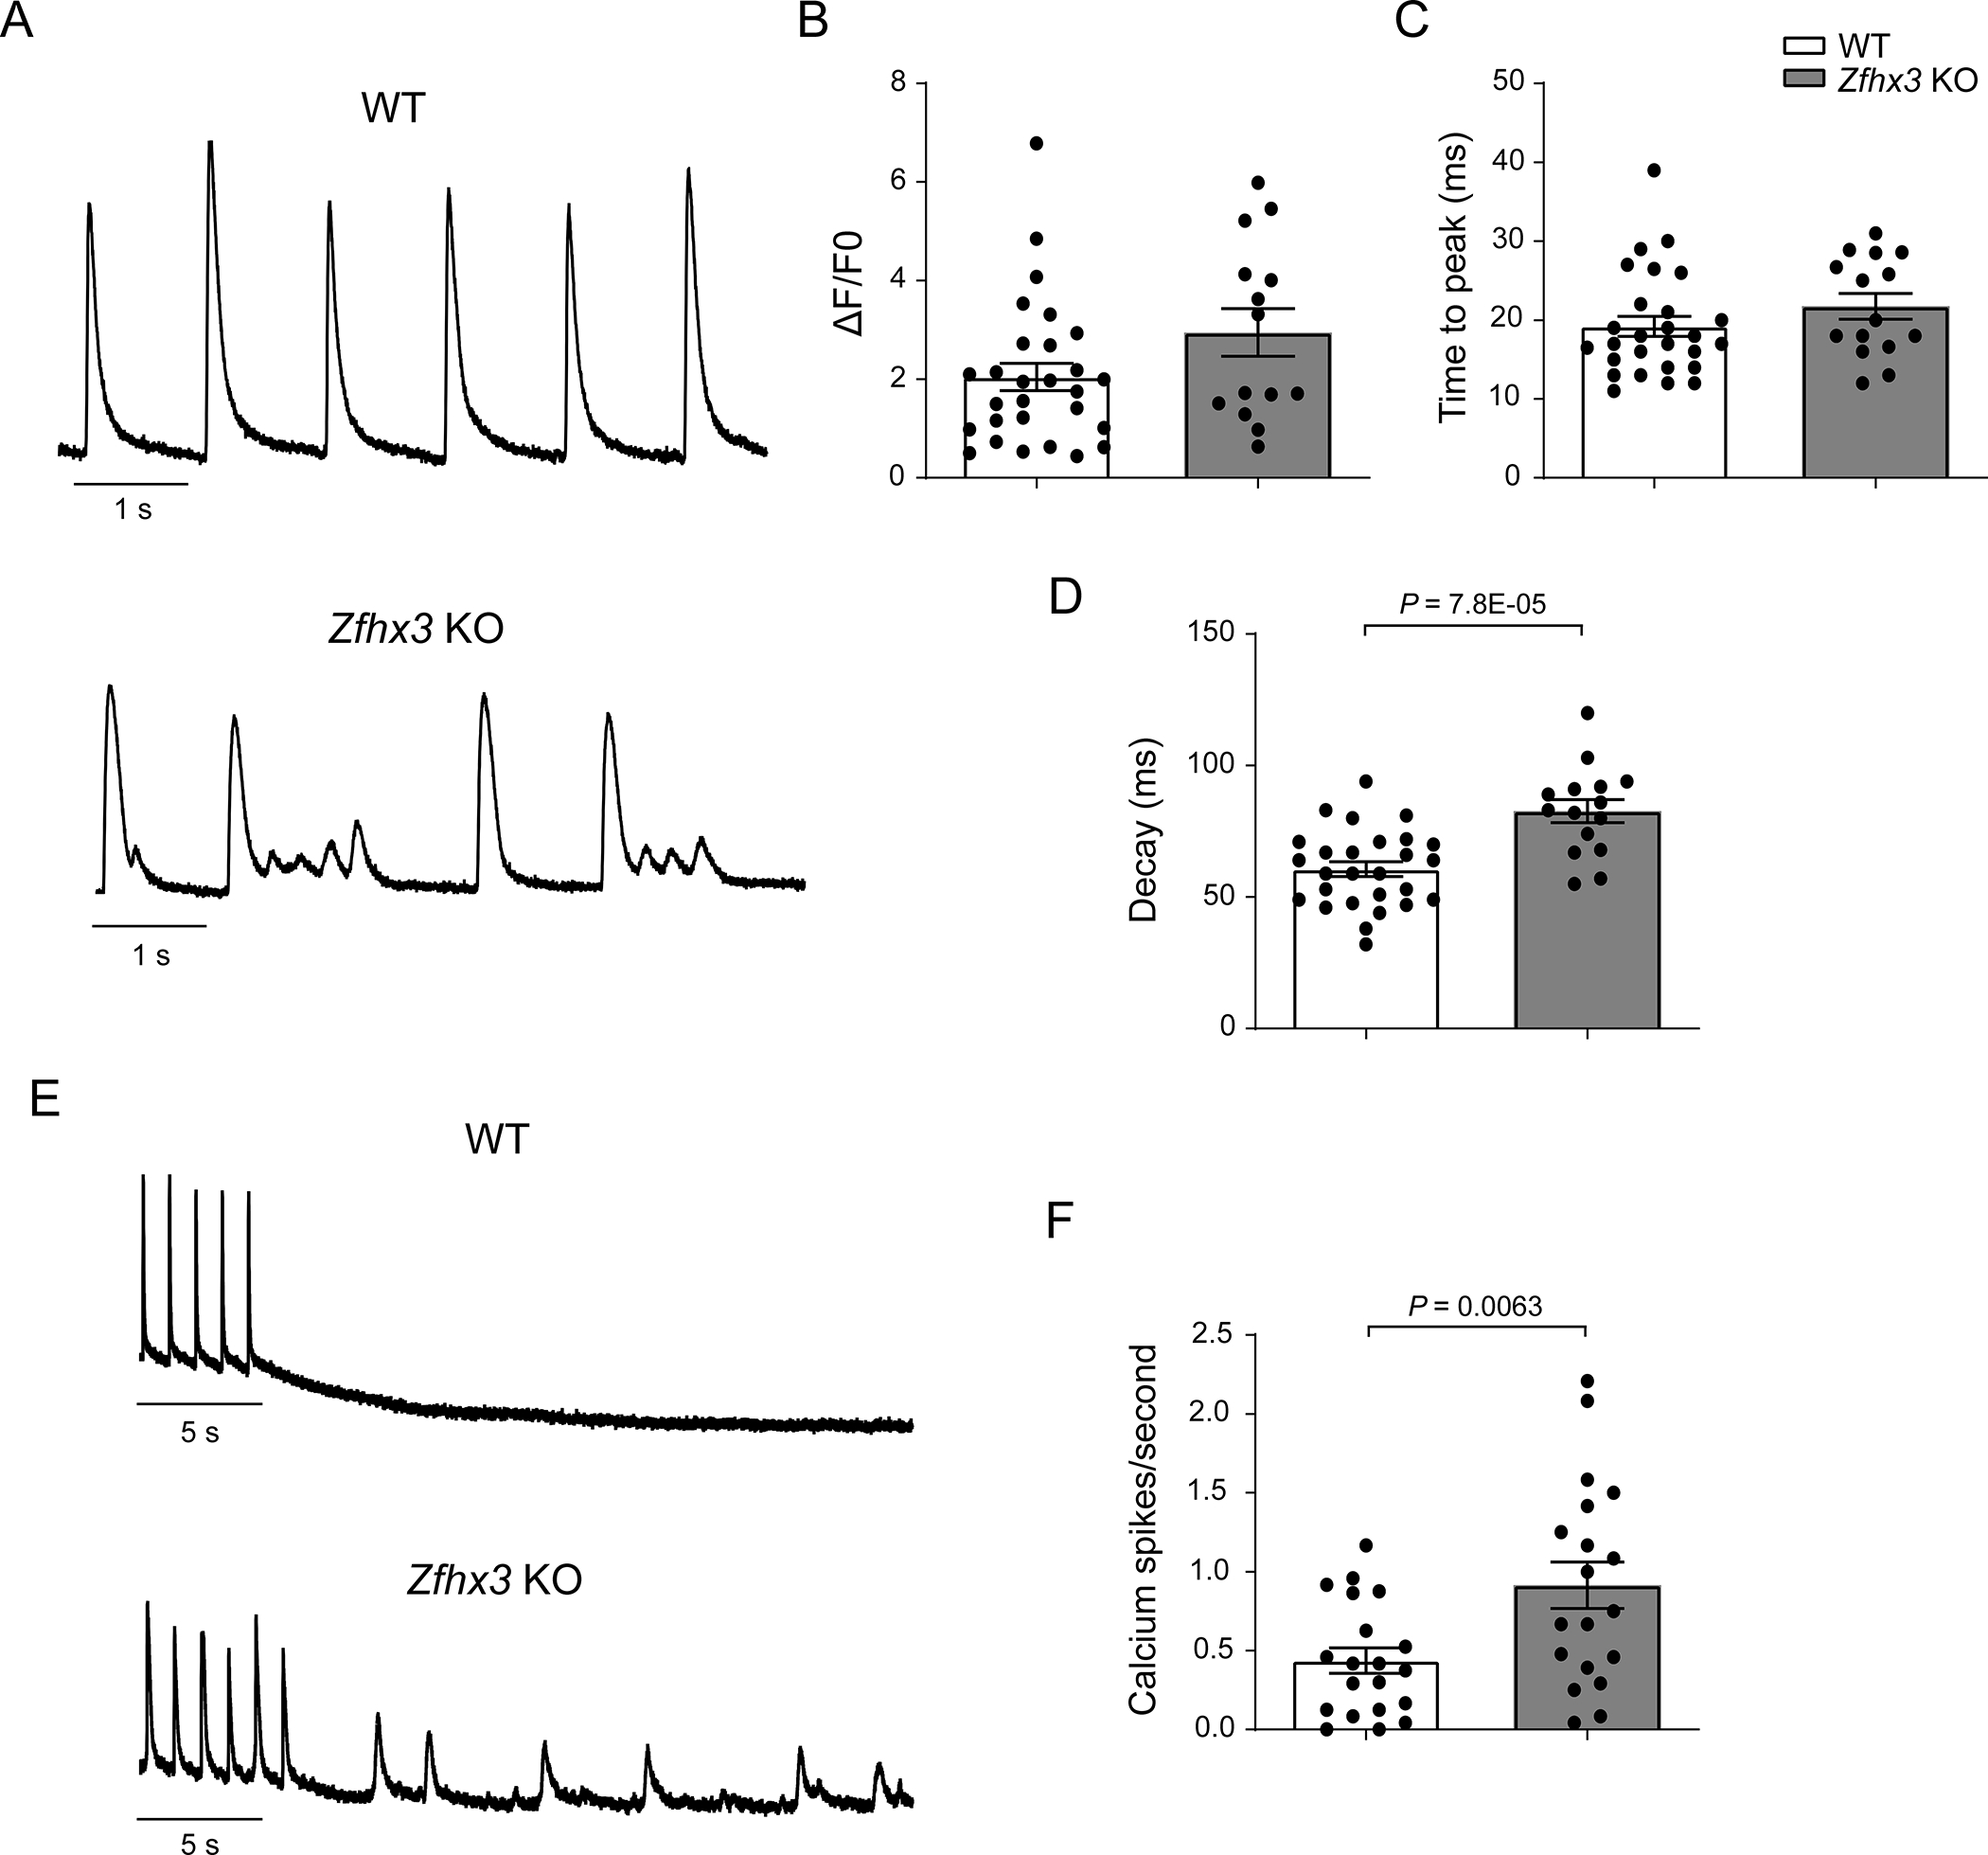
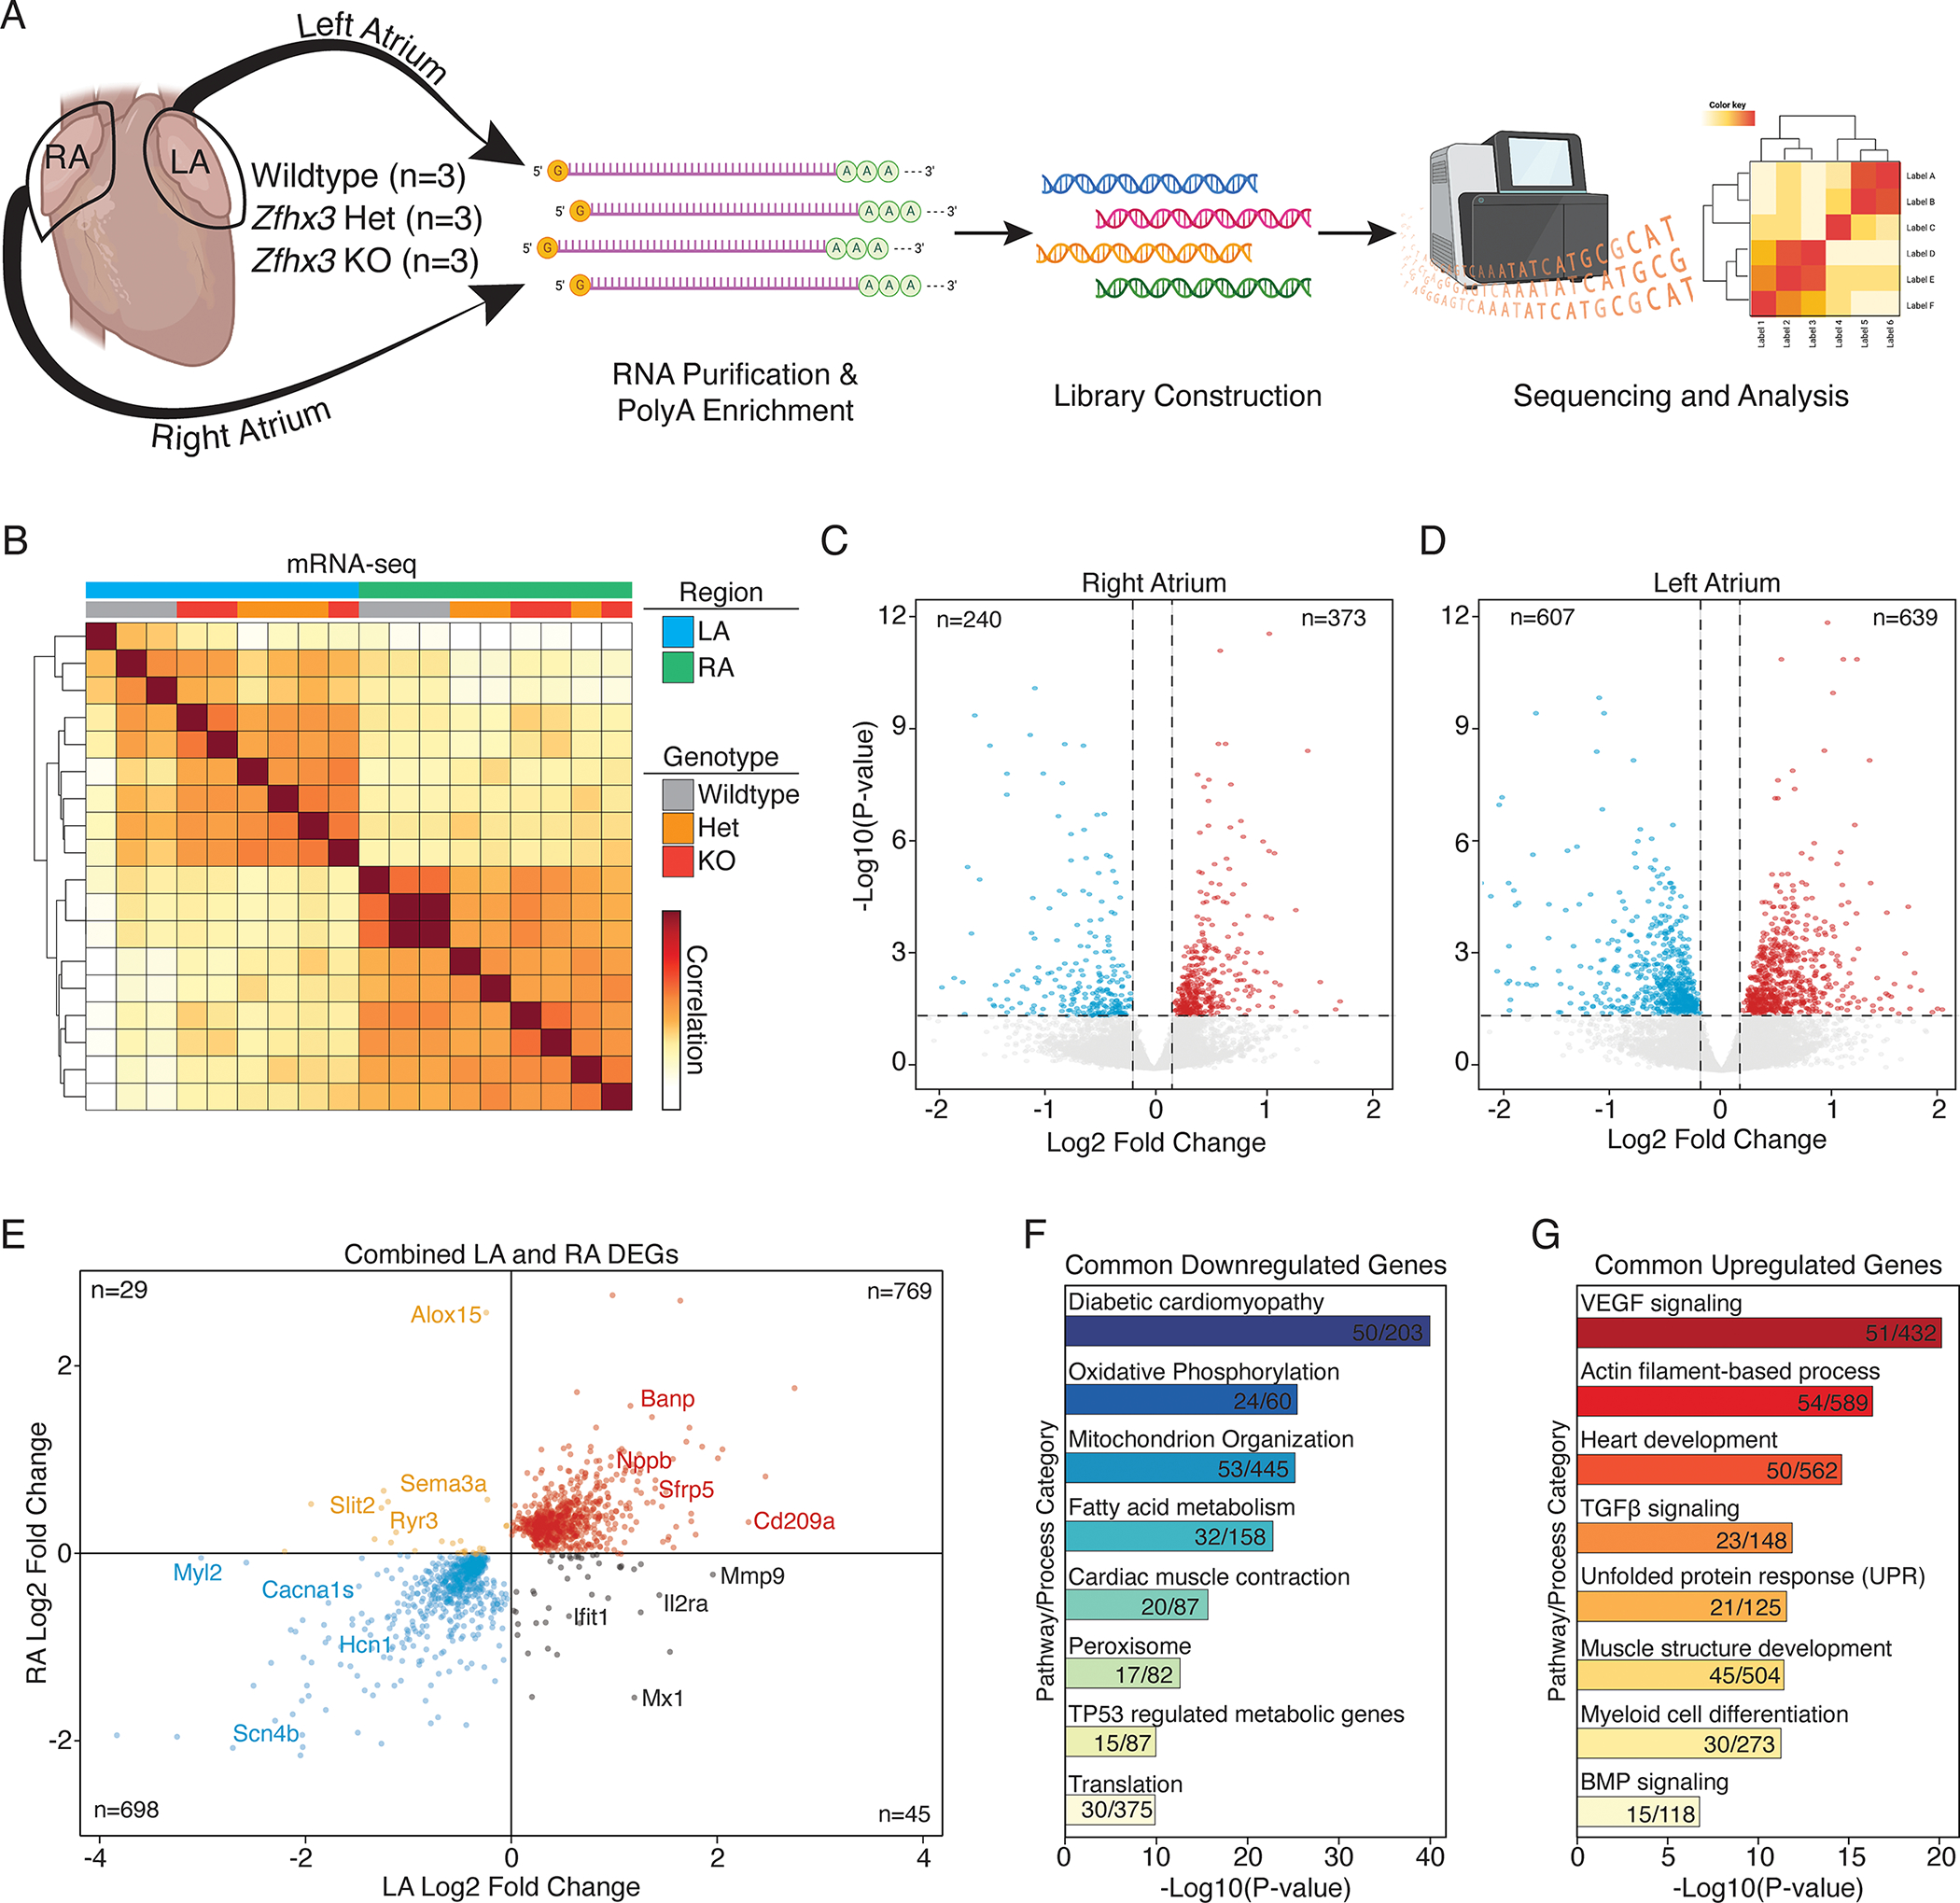
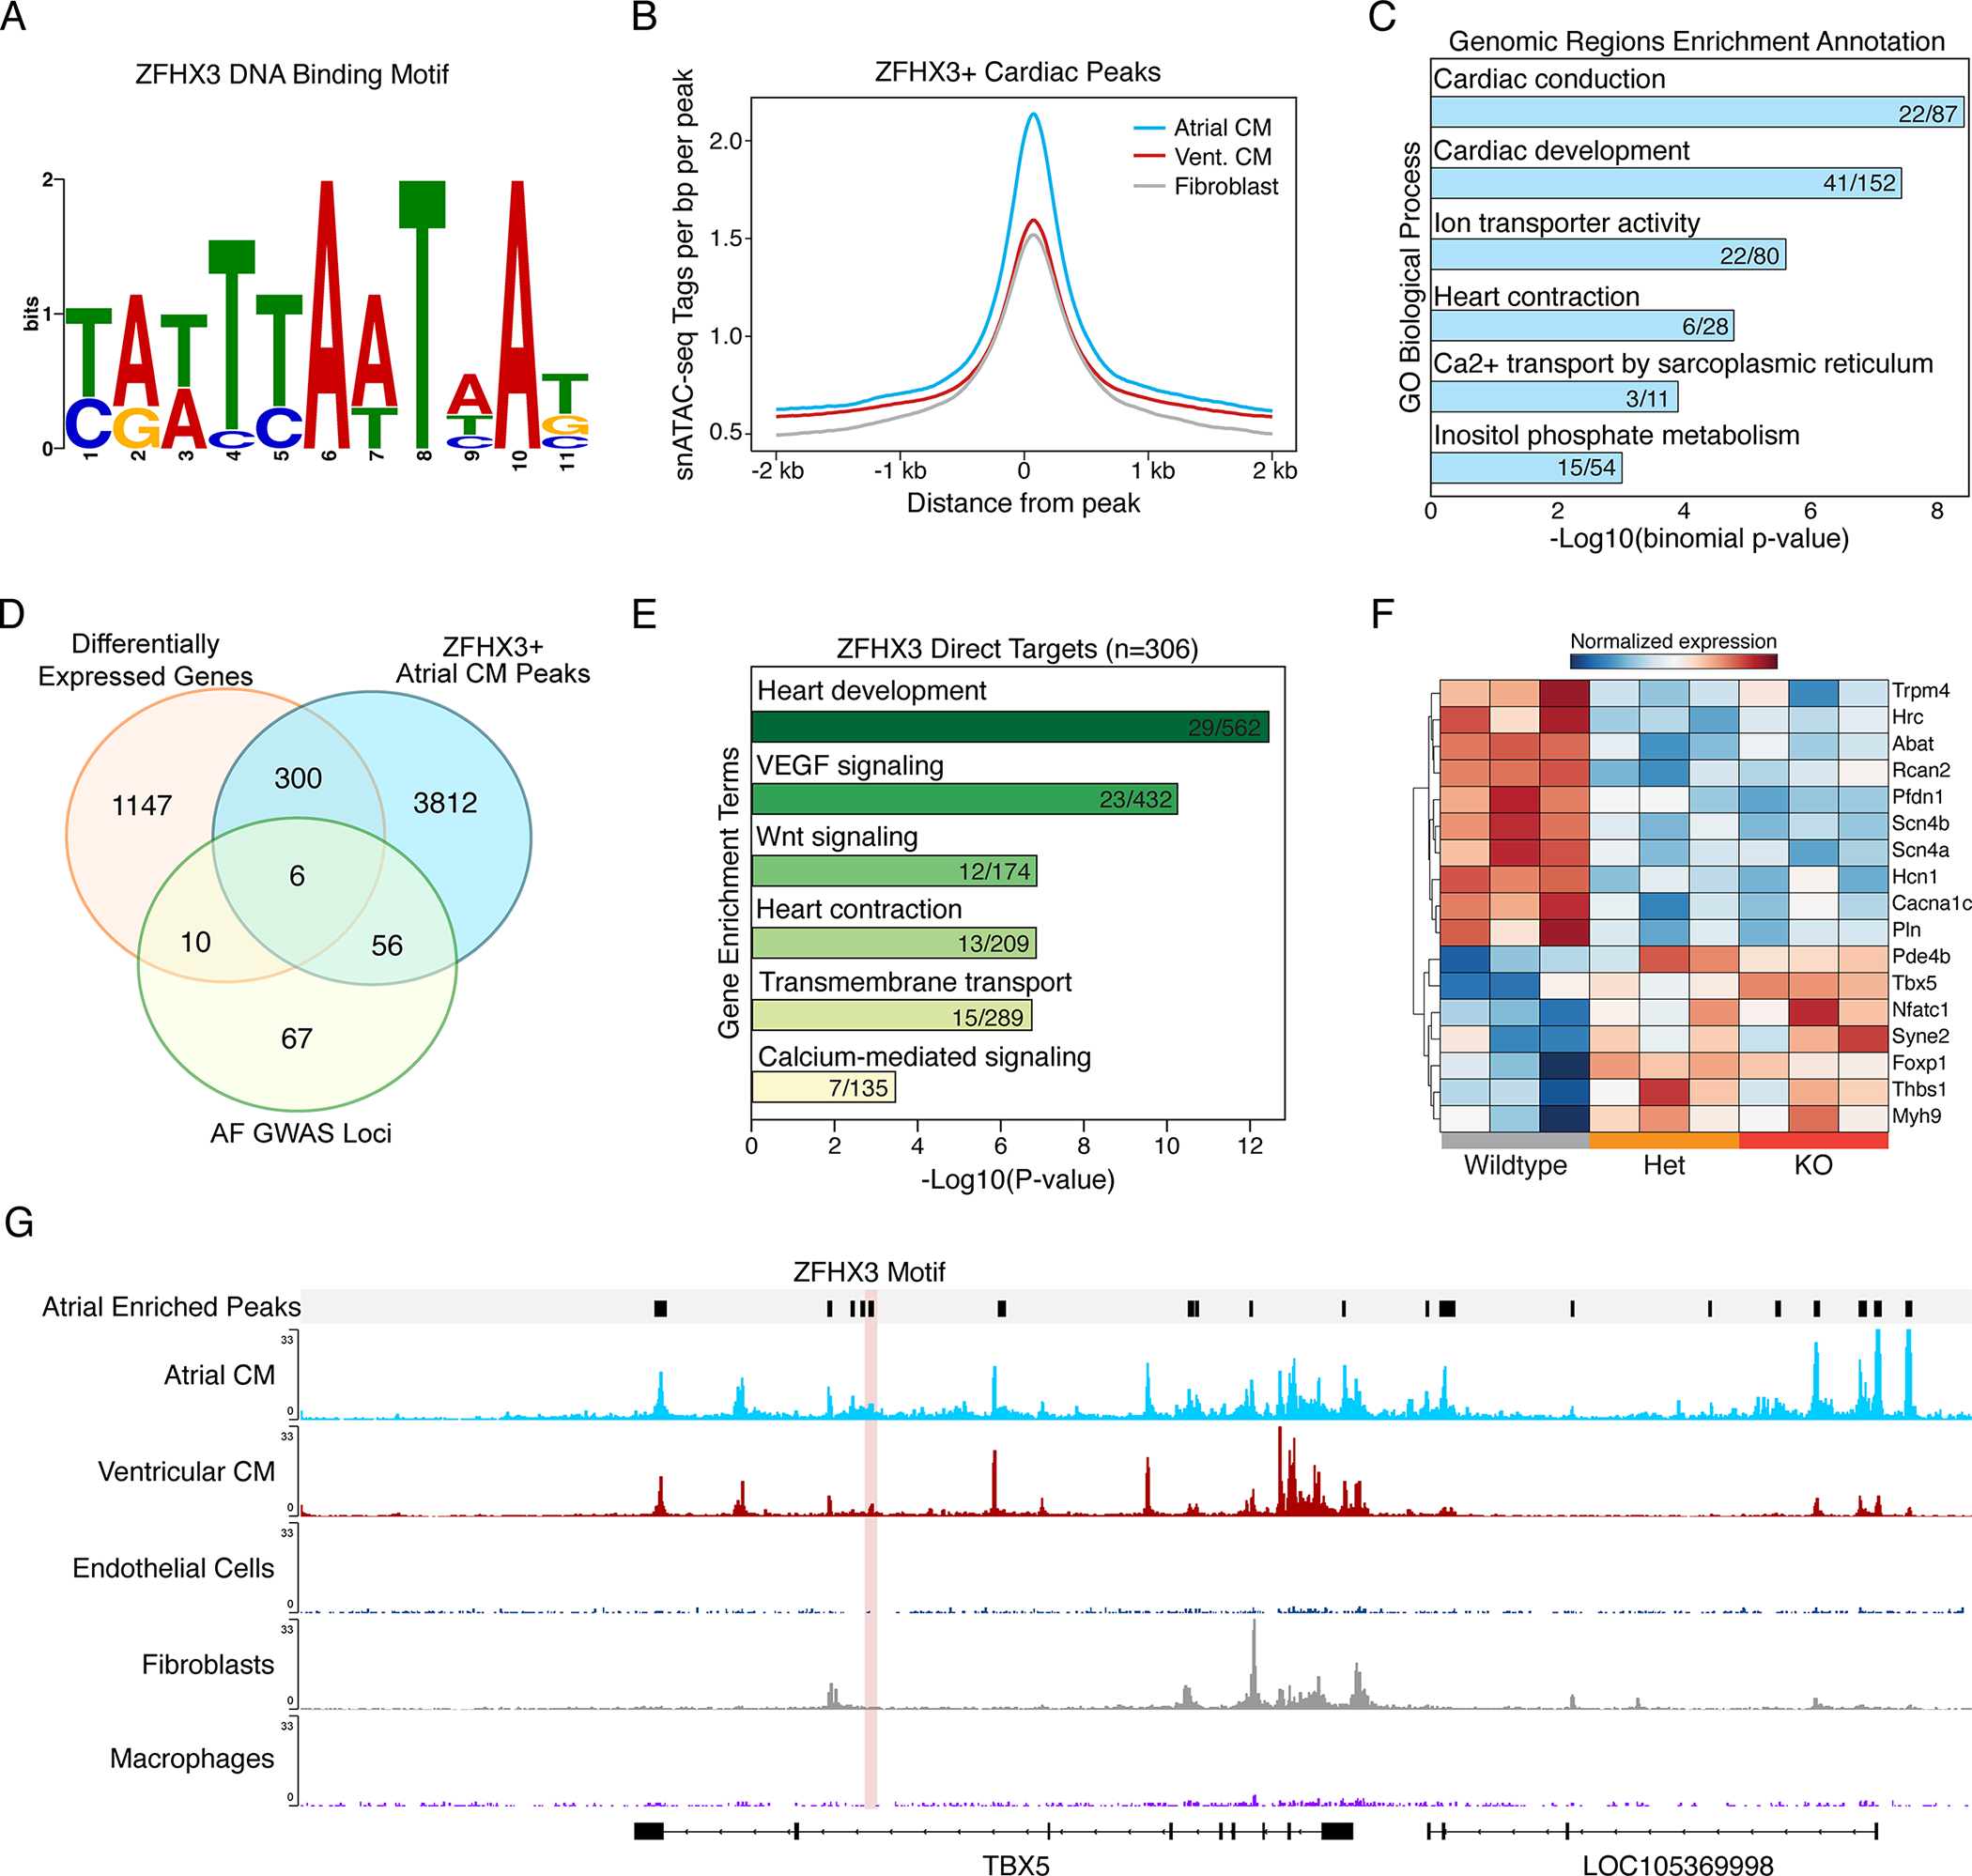
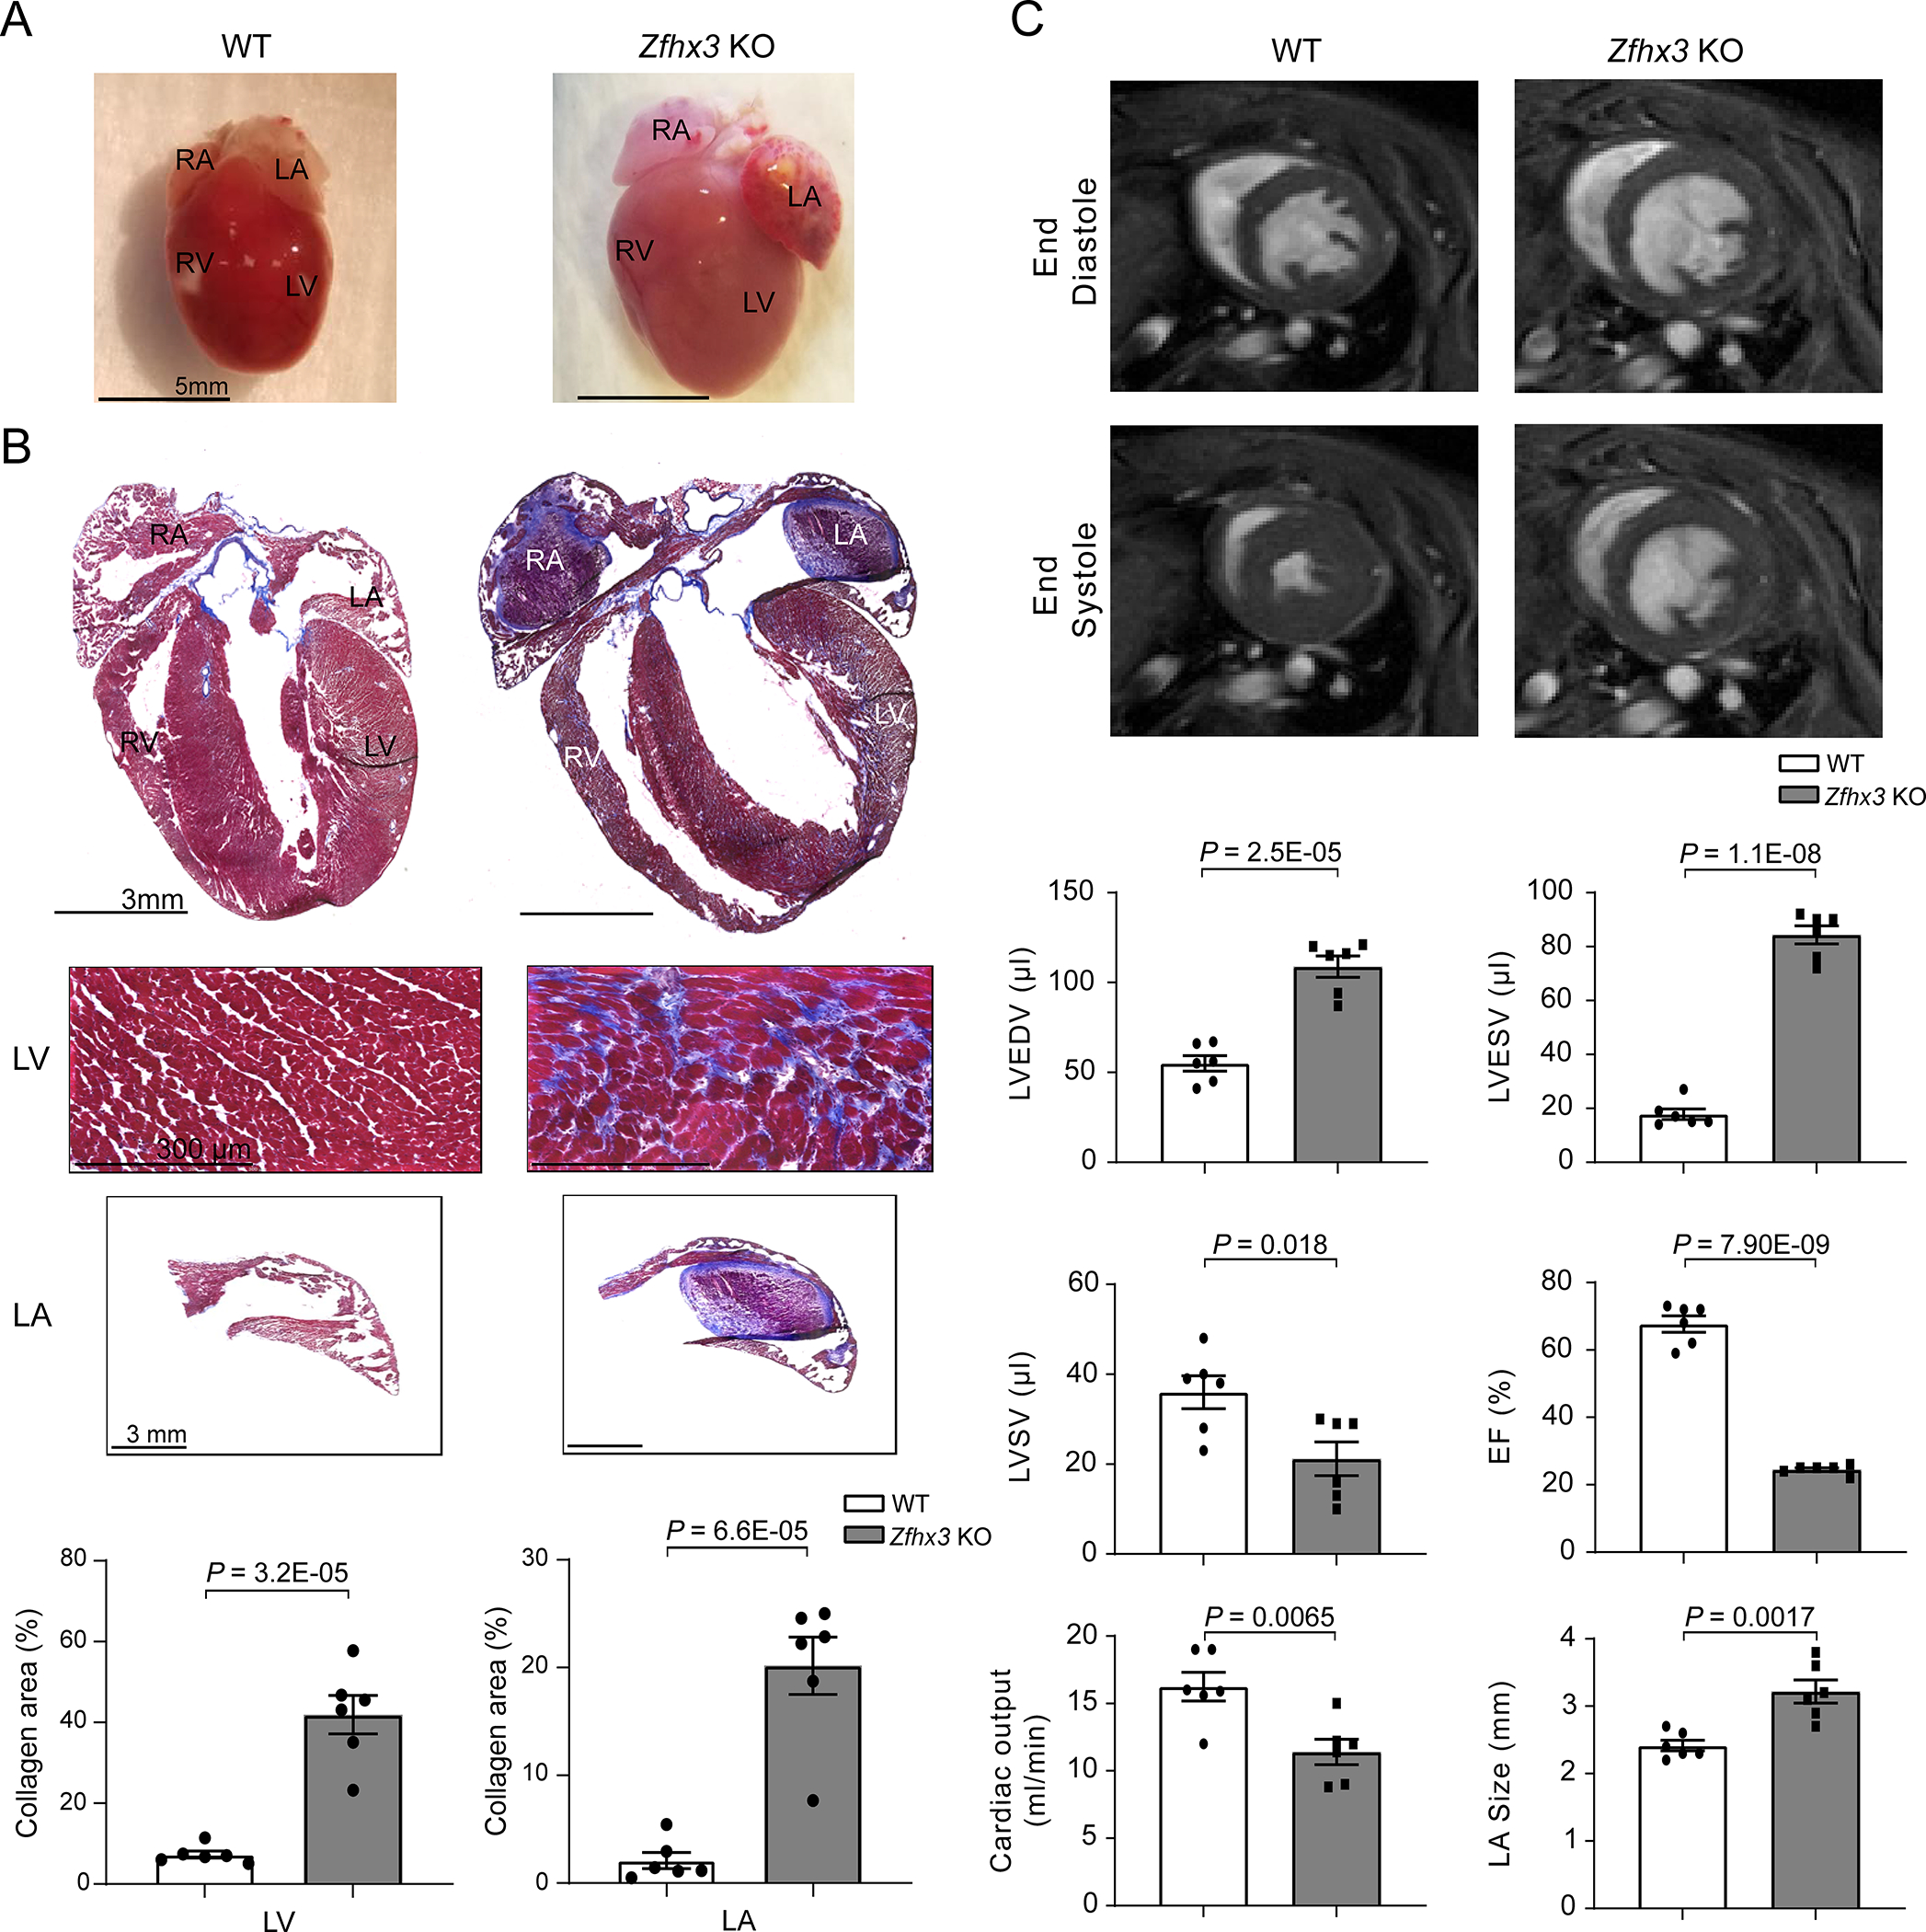
Methods: CRISPR-Cas9 genome editing, chromatin immunoprecipitation, and luciferase assays in pluripotent stem cell-derived cardiomyocytes were used to identify causative genetic variation related to AF at the ZFHX3 locus. Cardiac function was assessed by echocardiography, magnetic resonance imaging, electrophysiology studies, calcium imaging, and RNA sequencing in mice with heterozygous and homozygous cardiomyocyte-restricted Zfhx3 loss (Zfhx3 Het and knockout, respectively). Human cardiac single-nucleus ATAC (assay for transposase-accessible chromatin)-sequencing data was analyzed to determine which genes in atrial cardiomyocytes are directly regulated by ZFHX3.

Results: We found single-nucleotide polymorphism (SNP) rs12931021 modulates an enhancer regulating ZFHX3 expression, and the AF risk allele is associated with decreased ZFHX3 transcription. We observed a gene-dose response in AF susceptibility with Zfhx3 knockout mice having higher incidence, frequency, and burden of AF than Zfhx3 Het and wild-type mice, with alterations in conduction velocity, atrial action potential duration, calcium handling and the development of atrial enlargement and thrombus, and dilated cardiomyopathy. Zfhx3 loss results in atrial-specific differential effects on genes and signaling pathways involved in cardiac pathophysiology and AF.

Conclusions: Our findings implicate ZFHX3 as the causative gene at the 16q22 locus for AF, and cardiac abnormalities caused by loss of cardiac Zfhx3 are due to atrial-specific dysregulation of pathways involved in AF susceptibility. Together, these data reveal a novel and important role for Zfhx3 in the control of cardiac genes and signaling pathways essential for normal atrial function.

Keywords: atrial fibrillation; electrophysiology; mice; myocytes, cardiac; transcription factors.


Conflict of interest statement

Disclosures P.T. Ellinor receives sponsored research support from Bayer AG, IBM Research, Bristol Myers Squibb, and Pfizer; he has also served on advisory boards or consulted for Bayer AG, MyoKardia, and Novartis. The other authors report no conflicts.

Figures

Figure 1.
Figure 1.. Identification of a functional variant at the ZFHX3 locus on chromosome 16q22.
A. The region encompassing all common AF-associated SNPs with r2 > 0.3 with respect to the sentinel SNP rs2106261. The six candidate SNPs intersecting DNaseI hypersensitivity (DHS) signal are shown. The DHS signal in human cardiac myocytes and the mammalian conservation (Phylop) around this region were obtained from ENCODE. The 18-state models from Roadmap Epigenomics marking various regulatory elements in human left ventricles (LV) and right atria (RA) show regions of transcription, weak enhancer, active enhancer, transcription start site and repressed polycomb as green, yellow, orange, red and grey blocks, respectively. The red, green and black arrows indicate the position of rs2106261, rs12596810 and rs12931021, respectively. B. Luciferase data showing allele-specific activities for the six candidate SNPs in PSC-CMs. n = 3. C. Allele-specific ChIP-qPCR results in PSC-CMs heterozygous at rs12931021. The pulldown of H3K4me1 and H3K27ac were conducted to evaluate the enrichment of chromatin fragments containing either allele of rs12931021. n = 3. D. qPCR showing that deletion of rs12931021-containing regulatory element reduces the expression of ZFHX3 in PSC-CMs. n = 7. E. Relative expression of ZFHX3 in isogenic PSC-CMs carrying AA, AC or CC genotype at rs12931021. n = 24. P values are indicated (B-E). Data are mean ± s.e.m. Groups were compared using unpaired t tests (B-D). Groups were compared using ordinary one-way ANOVA with Tukey’s multiple comparisons test (E).
Figure 2.
Figure 2.. Zfhx3 Het and KO mice have diminished survival.
A. Confocal images of Zfhx3 (green), troponin (red), and DAPI (blue) in adult WT mouse heart tissue. B. Percent survival of WT (n = 42), Zfhx3 Het (n = 36), and Zfhx3 KO (n = 42) mice. C. Representative left ventricular end- diastolic (top) and systolic (bottom) frames of short axis myocardium slices for WT (left) and Zfhx3 KO (right) mice at 3 months of age. Quantitative comparison (bottom) of left ventricular end- diastolic volume (LVEDV), left ventricular end systolic volume (LVESV), left ventricular stroke volume (LVSV), ejection fraction (EF), and cardiac output, and left atrial (LA) size between WT and Zfhx3 KO mice. n = 6 per genotype. D. Masson’s trichrome staining in WT (top) and Zfhx3 KO (bottom) heart sections from 3-month-old mice. Bar graphs show quantification of fibrotic areas in histological sections (LV, left; LA, right; n = 6 samples per genotype). LV indicates left ventricle; RV, right ventricle; LA, left atrium; RA, right atrium. P values are indicated. Percent survival was compared using log-rank Mantel-Cox test, WT versus Zfhx3 Het and Zfhx3 KO (B). Data are mean ± s.e.m. Groups were compared using unpaired t tests (C and D).
Figure 3.
Figure 3.. Gene-dose response in susceptibility to AA/AF at 3-months-old.
A. Representative surface (red) and intracardiac atrial (green) ECGs (mV) in WT (top) and Zfhx3 KO mice (bottom) after rapid atrial pacing (cycle length of 25 ms). B. Percentage of mice with inducible AA/AF (6/15 WT, 4/6 Zfhx3 Het, and 13/17 Zfhx3 KO mice). C. Comparison of arrhythmia burden by genotype (n = 15 WT, 6 Zfhx3 Het, and 17 Zfhx3 KO mice). D. Frequency of AA/AF in each group at 3-months-old (n = 15 WT, 6 Zfhx3 Het, and 17 Zfhx3 KO mice). E. Representative surface (red) and intracardiac atrial (green) ECGs (mV) in Zfhx3 KO mice showing atrial tachycardia termination and resumption. Time between beats indicated in ms. AA indicates atrial arrhythmia; AF, atrial fibrillation; ECGs, electrocardiogram; AT, atrial tachycardia, NSR, normal sinus rhythm. Data are mean ± s.e.m. P values indicated. Significance of arrhythmia induction and frequency of AA/AF were determined with Mann-Whitney test.
Figure 4.
Figure 4.. Zfhx3 loss results in abnormal calcium handling at 3-months-old.
A. Representative traces of calcium transients recorded from WT (top) and Zfhx3 KO (bottom) mice left atrial cardiomyocytes with fluo-3AM and paced at 1 Hz. Mean amplitude (B, n = 28 WT and 14 Zfhx3 KO cells), time to peak (C, n = 27 WT and 15 Zfhx3 KO cells), and decay time constants (D, n = 27 WT and 15 Zfhx3 KO cells) of calcium transients. E. Representative traces of spontaneous calcium events after 1 min of pacing at 1 Hz. F. Mean spontaneous calcium events per second without pacing (n = 20 WT and 19 Zfhx3 KO cells). Data are mean ± s.e.m. P values are indicated. Groups were compared using unpaired t tests
Figure 5.
Figure 5.. Zfhx3 loss leads to differentially expressed genes in left and right atria at 6 months of age.
A. Experimental overview for RNA-seq. Both the LA and RA were profiled from 3 different animals of each genotype (total animals profiled = 9 and, mRNA-seq libraries = 18). B. Correlation heatmap of RNA-seq sample distances. Individual libraries annotated by region, and genotype. C, D. Volcano plot of total RNA sequencing of LA (C) and RA (D) in WT vs Zfhx3 KO and Het mouse hearts. E. Scatterplot of all combined significantly differentially expressed genes (DEGs) compared across the left atria (LA) and right atria (RA). F, G. GO and pathway for common downregulated (F) and upregulated (G) genes. LA indicates left atrium; RA, right atrium; GO; gene ontology.
Figure 6.
Figure 6.. ZFHX3 directly regulates genes related to atrial conduction and AF.
A. The consensus ZFHX3 motif derived from published AT sequences of genes regulated by Zfhx3. B. snATAC-seq fragment depth per cell cluster across high confidence ZFHX3 motif containing peaks (logs ratio >10). C. GREAT analysis for top atrial CM ZFHX3+ peaks. D. Venn diagram displaying the overlap of differentially expressed genes from Zfhx3 KO mice (adjusted P-value < 0.05) combined from both left and right atria, human ZFHX3 target genes identified from atrial CMs via snATAC and known AF GWAS loci. E. Gene ontology analysis for ZFHX3 target genes differentially expressed in Zfhx3-deficient hearts. F. Heatmap displaying genes expression of cardiac genes, identified in panel E. G. Genome browser track showing snATAC from the human heart separated by cardiac cell type. Atrial-enriched peak with a ZFHX3 motif is highlighted in light red. CM indicates cardiomyocyte; GREAT indicates genomic regions enrichment annotations.
Figure 7.
Figure 7.. 9-month-old Zfhx3 KO mice have dilated cardiomyopathy and atrial thrombus.
A. Representative gross heart size in WT (left) and Zfhx3 KO (right) mice. B. Representative Masson’s trichrome staining of whole hearts, WT (top left) and Zfhx3 KO mice (top right), and heart sections from LV (top) and LA (bottom). Bar graph shows quantification of left ventricular and left atrial fibrotic areas in histological sections. n = 6 samples per genotype. C. Representative left ventricular end- diastolic (top) and systolic (bottom) frames of short axis myocardium slices for WT (left) and Zfhx3 KO (right). Quantitative comparison (bottom) of left ventricular end- diastolic volume (LVEDV), left ventricular end systolic volume (LVESV), left ventricular stroke volume (LVSV), ejection fraction (EF), and cardiac output, and left atrial (LA) size between WT and Zfhx3 KO mice. n = 6 per genotype. LV indicates left ventricle; RV, right ventricle; LA, left atrium; RA, right atrium. Data are mean ± s.e.m. P values are indicated. Groups were compared using unpaired t tests

Comment in

References

    1. Zulkifly H, Lip GYH, Lane DA. Epidemiology of atrial fibrillation. Int J Clin Pract. 2018. - PubMed
    1. Lau DH, Nattel S, Kalman JM, Sanders P. Modifiable Risk Factors and Atrial Fibrillation. Circulation. 2017. - PubMed
    1. Roselli C, Chaffin MD, Weng L-C, Aeschbacher S, Ahlberg G, Albert CM, Almgren P, Alonso A, Anderson CD, Aragam KG, et al. Multi-ethnic genome-wide association study for atrial fibrillation. Nat Genet. 2018. - PMC - PubMed
    1. Benjamin EJ, Rice KM, Arking DE, Pfeufer A, Van Noord C, Smith AV., Schnabel RB, Bis JC, Boerwinkle E, Sinner MF, et al. Variants in ZFHX3 are associated with a trial fibrillation in individuals of European ancestry. Nat Genet. 2009. - PMC - PubMed
    1. Gudbjartsson DF, Holm H, Gretarsdottir S, Thorleifsson G, Walters GB, Thorgeirsson G, Gulcher J, Mathiesen EB, Njølstad I, Nyrnes A, et al. A sequence variant in ZFHX3 on 16q22 associates with a trial fibrillation and ischemic stroke. Nat Genet. 2009. - PMC - PubMed

Publication types