. 2023 Sep;54(9):2409-2419.
doi: 10.1161/STROKEAHA.123.042714. Epub 2023 Jul 14.

Targeting Neutrophil α9 Improves Functional Outcomes After Stroke in Mice With Obesity-Induced Hyperglycemia

Affiliations

Targeting Neutrophil α9 Improves Functional Outcomes After Stroke in Mice With Obesity-Induced Hyperglycemia

Rakesh B Patel et al. Stroke. 2023 Sep.

Abstract

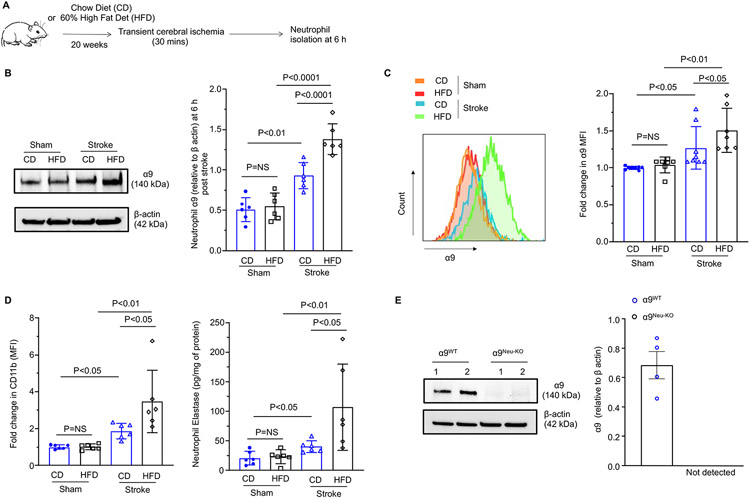
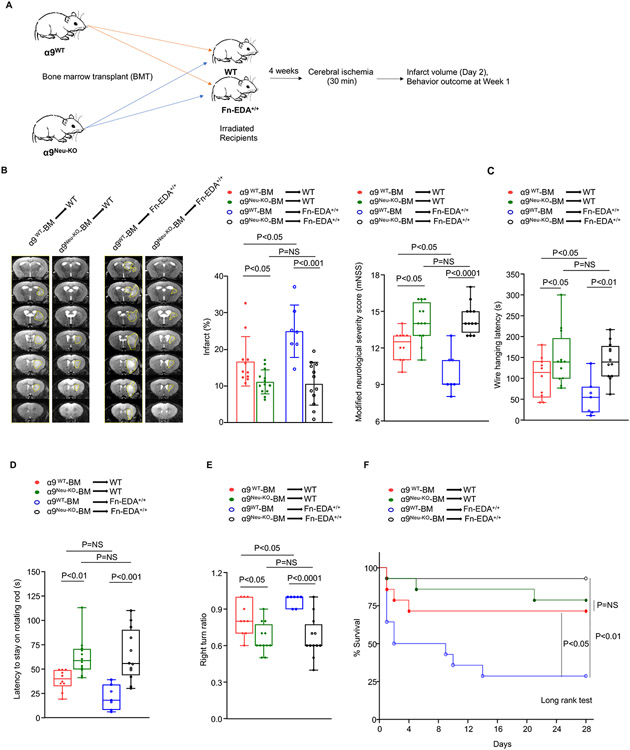
Background: Obesity-induced hyperglycemia is a significant risk factor for stroke. Integrin α9β1 is expressed on neutrophils and stabilizes adhesion to the endothelium via ligands, including Fn-EDA (fibronectin containing extra domain A) and tenascin C. Although myeloid deletion of α9 reduces susceptibility to ischemic stroke, it is unclear whether this is mediated by neutrophil-derived α9. We determined the role of neutrophil-specific α9 in stroke outcomes in a mice model with obesity-induced hyperglycemia.

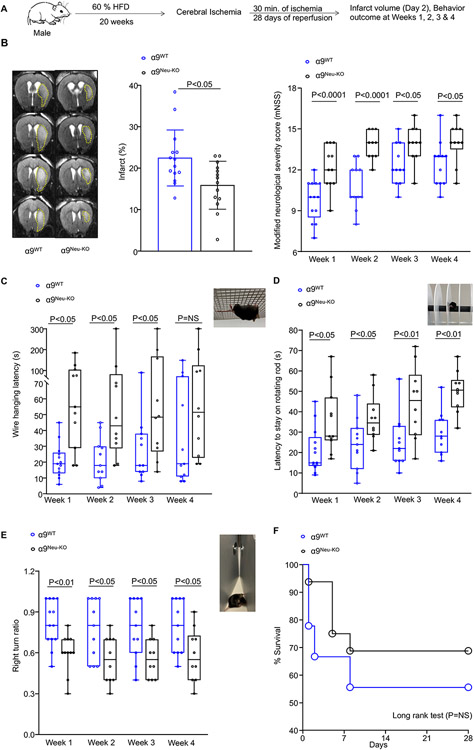
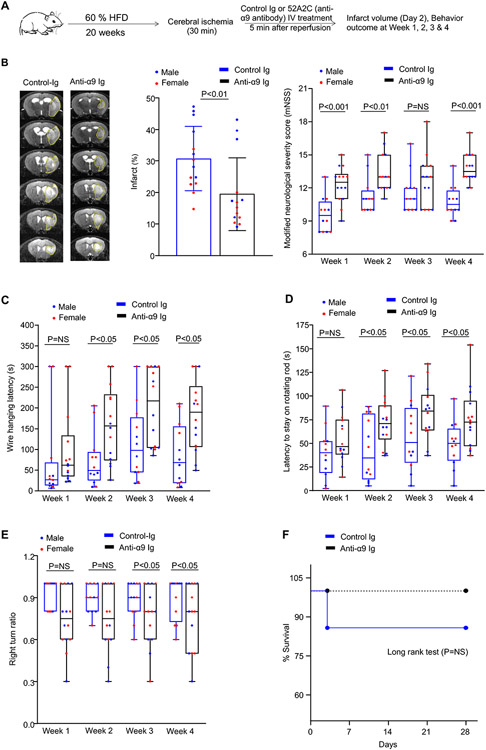
Methods: α9Neu-KO (α9fl/flMRP8Cre+) and littermate control α9WT (α9fl/flMRP8Cre-) mice were fed on a 60% high-fat diet for 20 weeks to induce obesity-induced hyperglycemia. Functional outcomes were evaluated up to 28 days after stroke onset in mice of both sexes using a transient (30 minutes) middle cerebral artery ischemia. Infarct volume (magnetic resonance imaging) and postreperfusion thrombo-inflammation (thrombi, fibrin, neutrophil, phospho-nuclear factor kappa B [p-NFκB], TNF [tumor necrosis factor]-α, and IL [interleukin]-1β levels, markers of neutrophil extracellular traps) were measured post 6 or 48 hours of reperfusion. In addition, functional outcomes (modified Neurological Severity Score, rota-rod, corner, and wire-hanging test) were measured for up to 4 weeks.

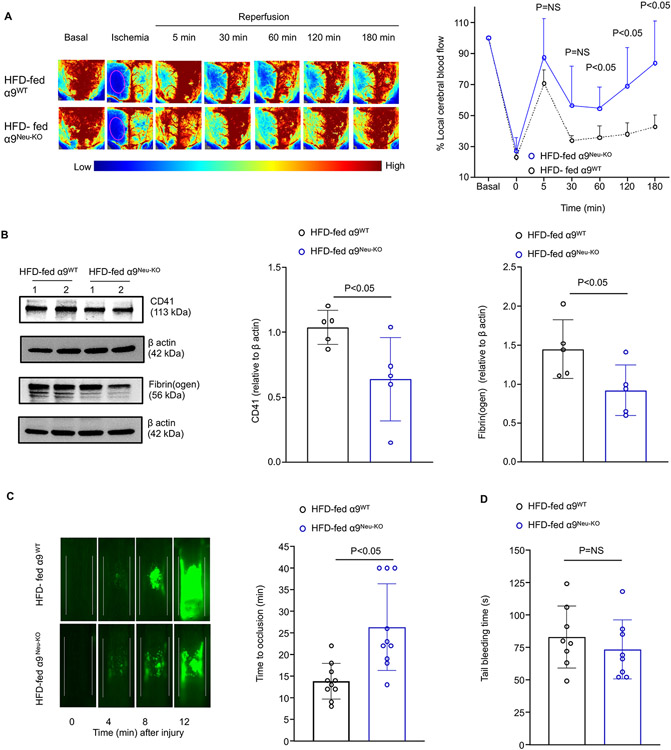
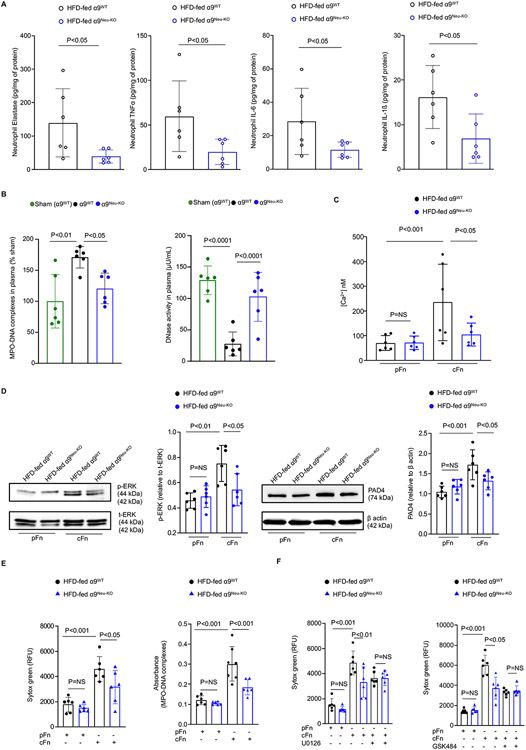
Results: Stroke upregulated neutrophil α9 expression more in obese mice (P<0.05 versus lean mice). Irrespective of sex, deletion of neutrophil α9 improved functional outcomes up to 4 weeks, concomitant with reduced infarct, improved cerebral blood flow, decreased postreperfusion thrombo-inflammation, and neutrophil extracellular traps formation (NETosis) (P<0.05 versus α9WT obese mice). Obese α9Neu-KO mice were less susceptible to thrombosis in FeCl3 injury-induced carotid thrombosis model. Mechanistically, we found that α9/cellular fibronectin axis contributes to NETosis via ERK (extracellular signal-regulated kinase) and PAD4 (peptidyl arginine deiminase 4), and neutrophil α9 worsens stroke outcomes via cellular fibronectin-EDA but not tenascin C. Obese wild-type mice infused with anti-integrin α9 exhibited improved functional outcomes up to 4 weeks (P<0.05 versus vehicle).

Conclusions: Genetic ablation of neutrophil-specific α9 or pharmacological inhibition improves long-term functional outcomes after stroke in mice with obesity-induced hyperglycemia, most likely by limiting thrombo-inflammation.

Keywords: hyperglycemia; ischemic stroke; mice; neutrophils; obesity; risk factor.


Conflict of interest statement

Disclosures None.

Figures

Figure 1:
Figure 1:. Stroke upregulated α9 expression.
(A) Schematic of experimental design. (B) Representative immunoblots and densitometric analysis of α9 expression in neutrophils following stroke onset in wild-type (WT) mice fed a chow diet (CD) and high-fat diet (HFD). n=6,6. (C) Representative flow cytometry and fold change in mean fluorescence intensity (MFI) of α9 expression. n=8,7,8,7. (D) Fold change in MFI of Neutrophil CD11b (Left) and elastase level (right) following stroke onset. n=6,6,6,6. (E) Representative immunoblot of α9 from the bone-marrow-derived neutrophils of the α9WT and α9Neu-KO mice. #1 and #2 represent samples from two individual mice and β-actin as a loading control. n=4,4. Data are mean ± SD. Statistical analysis: two-way ANOVA followed by Holm-Sidak multiple comparisons test (B-D). NS: non-significant.
Figure 2.
Figure 2.. Neutrophil-specific deletion of α9 improves stroke outcome in male obese mice.
(A) Schematic of experimental design. (B) Representative T2-MRI images (left) from one mouse on day 2 and mean infarct (middle) of each genotype. White (demarcated by yellow dots) is the infarct area. n=14,14. Right: Modified Neurological Severity Score (mNSS) in the same cohort of mice up to weeks 4 (a higher score indicates a better outcome). n=13,11 (week 1) & 11,10 (week 2-4). (C-E) Sensorimotor recovery in the same cohort of mice as analyzed by motor strength in the hanging-wire test (C), fall latency in the accelerated rota-rod test (D), and right turn ratio in the corner test (E). n=13,11 (week 1) & 11,10 (week 2-4). (F) Survival (%) up to day 28. Data are mean ± SD (infarct) and median ± range (functional outcome). Statistical analysis: unpaired t-test (infarct), two-way ANOVA followed by Holm-Sidak multiple comparisons test (functional outcome). The comparison of survival curves was evaluated by the log-rank (Mantel-Cox) test. NS: non-significant.
Figure 3.
Figure 3.. Neutrophil α9−/− obese mice exhibited improved local cerebral blood flow and reduced post-ischemia/reperfusion thrombosis.
(A) Left: Representative images were taken using laser speckle imaging of the cortical region's regional cerebral blood flow (CBF). Right: Quantification at different time points. n=8,8. (B) Representative Western blots of brain homogenates and densitometric analysis of platelets (CD4-positive) and fibrin(ogen) from the infarcted and peri-infarcted areas. β-Actin was used as a loading control. n=5,5. (C) Representative microphotographs of thrombus growth in FeCl3-injured carotid arteries as visualized by upright intravital microscopy. Platelets were labeled with calcein green. White lines delineate the arteries. Right: Mean time to complete occlusion. n=10,10. (D) The tail bleeding time was determined by the time taken for the initial cessation of bleeding after transection, n=8,8. Data are mean ± SD. Statistical analysis: two-way ANOVA followed by Holm-Sidak multiple comparisons test (A), Mann-Whitney test (B-D). NS: non-significant.
Figure 4.
Figure 4.. Neutrophil-specific deletion of α9 limits post-ischemic inflammation and NETosis.
(A) Quantification of elastase, tumor necrosis factor-α (TNF-α), interleukin-1β (IL-1β), and interleukin-6 (IL-6) levels in peripheral neutrophils 6 hours post-reperfusion by ELISA. n=6,6. (B) Plasma level of MPO-DNA complexes (left) and DNase activity (middle) 6 hours post-reperfusion. n=6,6. (C) BM derived neutrophils were stimulated with pFn or cFn (20 μg/ml) for 5 mins. Fluorometric quantitation of intracellular calcium flux using Fura-2 AM loaded neutrophils. n= 6,6, 6, 6. (D) BM derived neutrophils were stimulated with pFn or cFn (20 μg/ml) for 15 min (ERK1/2) and 3 h (PAD4). Left: Representative immunoblots and densitometric analysis of p-ERK1/2 and PAD4 in neutrophils lysates. β-Actin was used as a loading control. Right: Quantification. n=6,6,6,6. (E) BM derived neutrophils were stimulated with pFn or cFn (20 μg/ml). NETosis (left) was detected by SYTOX green fluorescence. Quantification of MPO-DNA complexes (right) by ELISA. n=6,6,7,6. (F) U0126 (10 μM) (left) and GSK484 (10 μM) (right) were added 30 min before cFn incubation. NETosis was detected by SYTOX green fluorescence. n=6,6,6,6,6,6. Data are mean ± SD. Statistical analysis: unpaired t-test (A), one-way ANOVA followed by Dunnett’s multiple comparisons tests (B), two-way ANOVA followed by Holm-Sidak multiple comparisons test (C-F). NS: non-significant.
Figure 5.
Figure 5.. Fn-EDA contributes to neutrophil α9-mediated stroke exacerbation in obese mice.
(A) Schematic of experimental design. (B) Representative T2-MRI images (left) from one mouse of each genotype on day 2 and mean infarct (middle) of each genotype. White (demarcated by yellow dots) is the infarct area. n=11,13,7,12. Right: Modified Neurological Severity Score (mNSS) in the same cohort of mice at day 7. n=10,12,7,12. (C-E) Sensorimotor recovery in the same cohort of mice as analyzed by motor strength in the hanging-wire test (C), fall latency in the accelerated rota-rod test (D), and right turn ratio in the corner test (E). n=10,12,7,12. (F) Survival (%) up to day 28. Data are mean ± SD (infarct) and median ± range (functional outcome). Statistical analysis: two-way ANOVA followed by Holm-Sidak multiple comparisons test. The comparison of survival curves was evaluated by the log-rank (Mantel-Cox) test. NS: non-significant.
Figure 6.
Figure 6.. Anti-integrin α9 antibody-treated obese mice exhibited improved long-term stroke outcomes.
(A) Schematic of experimental design. (B) Representative T2-MRI from one mouse of each group on day 2 (left) and corrected mean infarct of each genotype (middle). White (demarcated by yellow dots) is the infarct area. n=14,14. Modified Neurological Severity Score (mNSS) in the same cohort of mice up to weeks 4 (right) n=12,14. (C-E) Sensorimotor recovery in the same cohort mice as analyzed by motor strength in the hanging-wire test (C), fall latency in the accelerated rota-rod test (D), and right turn ratio in the corner test (E). n=12,14. (F) Survival rates up to day 28. Data are represented as mean ± SD (infarct) and median ± range (functional outcome). Statistical analysis: unpaired t-test (infarct area), two-way ANOVA followed by Holm-Sidak multiple comparisons test (functional outcome). The comparison of survival curves was evaluated by the log-rank (Mantel-Cox) test. NS: non-significant.

References

    1. Bhatia R, Hill MD, Shobha N, Menon B, Bal S, Kochar P, Watson T, Goyal M, Demchuk AM. Low rates of acute recanalization with intravenous recombinant tissue plasminogen activator in ischemic stroke: real-world experience and a call for action. Stroke. 2010;41:2254–2258. doi: 10.1161/STROKEAHA.110.592535 - DOI - PubMed
    1. Aronowski J, Roy-O'Reilly MA. Neutrophils, the Felons of the Brain. Stroke. 2019;50:e42–e43. doi: 10.1161/STROKEAHA.118.021563 - DOI - PMC - PubMed
    1. Denorme F, Portier I, Rustad JL, Cody MJ, de Araujo CV, Hoki C, Alexander MD, Grandhi R, Dyer MR, Neal MD, et al. Neutrophil extracellular traps regulate ischemic stroke brain injury. J Clin Invest. 2022;132. doi: 10.1172/JCI154225 - DOI - PMC - PubMed
    1. Valles J, Lago A, Santos MT, Latorre AM, Tembl JI, Salom JB, Nieves C, Moscardo A. Neutrophil extracellular traps are increased in patients with acute ischemic stroke: prognostic significance. Thromb Haemost. 2017;117:1919–1929. doi: 10.1160/TH17-02-0130 - DOI - PubMed
    1. Kang L, Yu H, Yang X, Zhu Y, Bai X, Wang R, Cao Y, Xu H, Luo H, Lu L, et al. Neutrophil extracellular traps released by neutrophils impair revascularization and vascular remodeling after stroke. Nat Commun. 2020;11:2488. doi: 10.1038/s41467-020-16191-y - DOI - PMC - PubMed

Publication types