. 2023 Sep 8;51(16):8587-8605.
doi: 10.1093/nar/gkad595.

Dynamic structure of T4 gene 32 protein filaments facilitates rapid noncooperative protein dissociation

Affiliations

Dynamic structure of T4 gene 32 protein filaments facilitates rapid noncooperative protein dissociation

Ben A Cashen et al. Nucleic Acids Res. .

Erratum in

Abstract

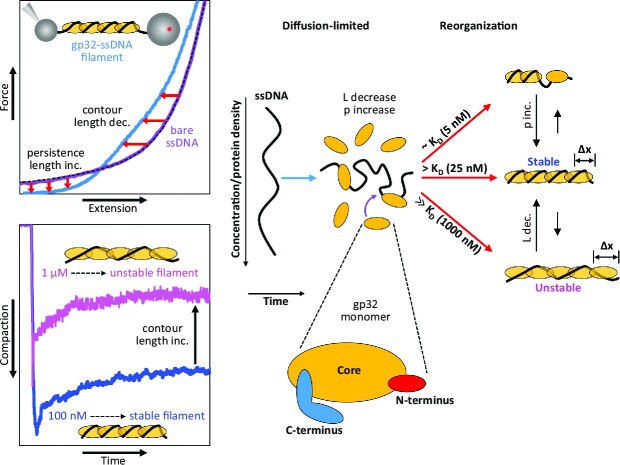
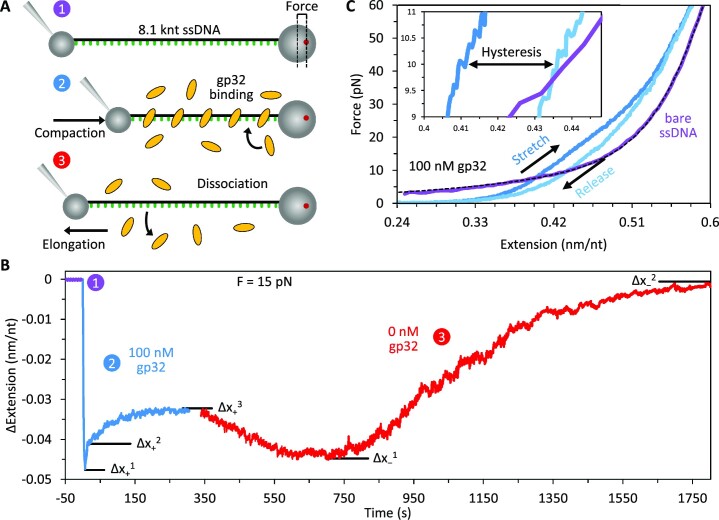
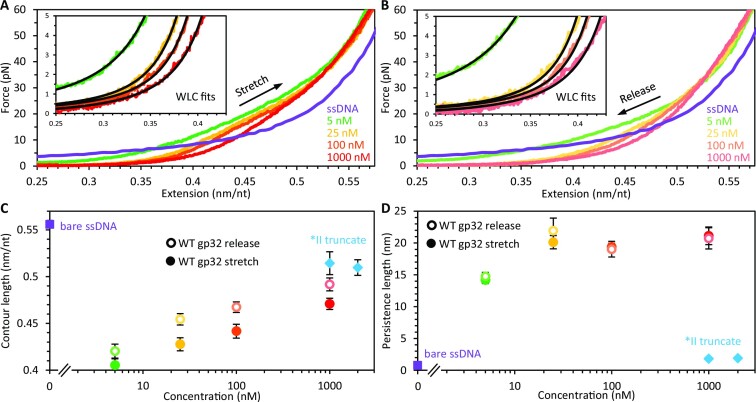
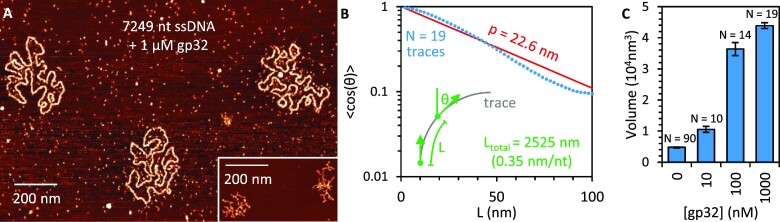
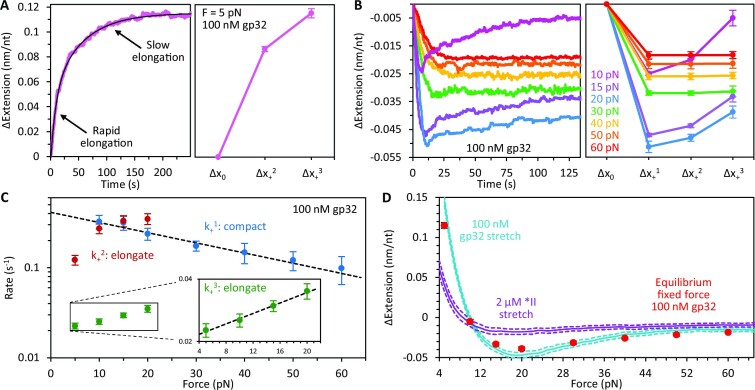
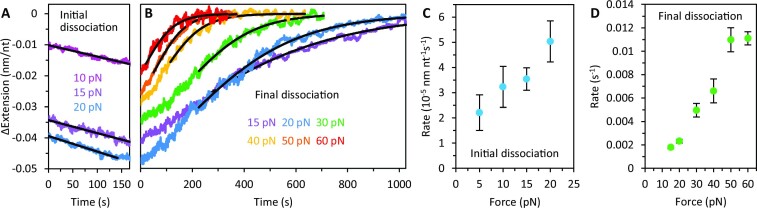
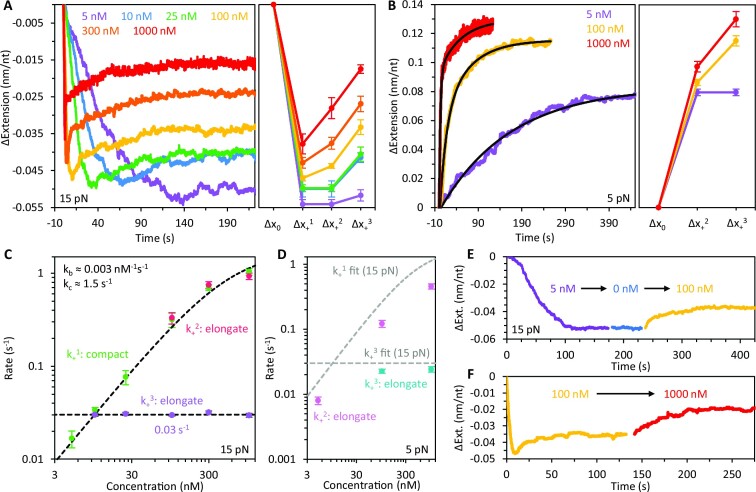
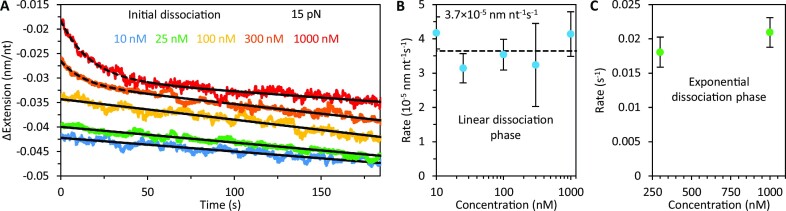
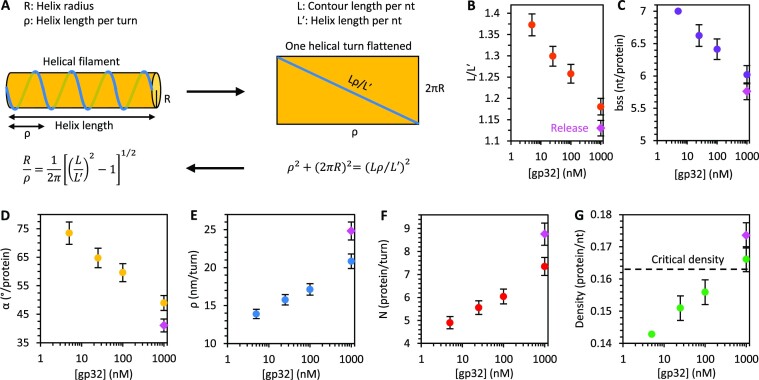
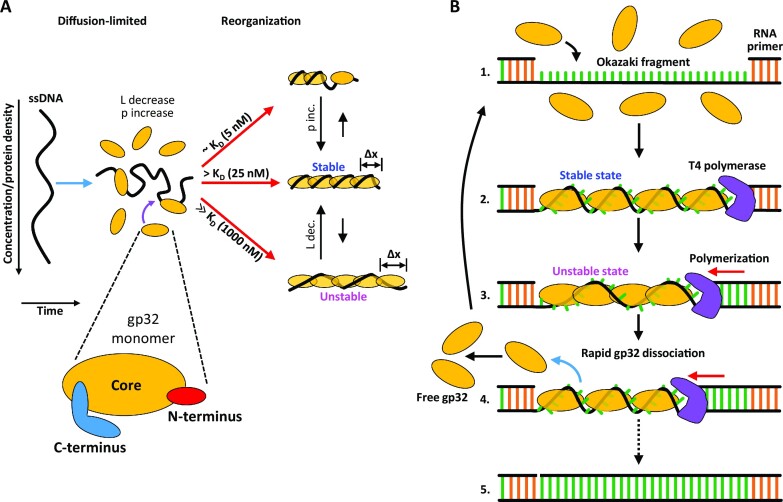
Bacteriophage T4 gene 32 protein (gp32) is a model single-stranded DNA (ssDNA) binding protein, essential for DNA replication. gp32 forms cooperative filaments on ssDNA through interprotein interactions between its core and N-terminus. However, detailed understanding of gp32 filament structure and organization remains incomplete, particularly for longer, biologically-relevant DNA lengths. Moreover, it is unclear how these tightly-bound filaments dissociate from ssDNA during complementary strand synthesis. We use optical tweezers and atomic force microscopy to probe the structure and binding dynamics of gp32 on long (∼8 knt) ssDNA substrates. We find that cooperative binding of gp32 rigidifies ssDNA while also reducing its contour length, consistent with the ssDNA helically winding around the gp32 filament. While measured rates of gp32 binding and dissociation indicate nM binding affinity, at ∼1000-fold higher protein concentrations gp32 continues to bind into and restructure the gp32-ssDNA filament, leading to an increase in its helical pitch and elongation of the substrate. Furthermore, the oversaturated gp32-ssDNA filament becomes progressively unwound and unstable as observed by the appearance of a rapid, noncooperative protein dissociation phase not seen at lower complex saturation, suggesting a possible mechanism for prompt removal of gp32 from the overcrowded ssDNA in front of the polymerase during replication.


Figures

Graphical Abstract
Graphical Abstract
Figure 1.
Figure 1.
Measuring gp32 binding and ssDNA conformation. (A) An 8.1 knt ssDNA was tethered between two functionalized microbeads and extended until reaching a set tension as measured by beam deflection in the optical trap (1). The extension of the DNA molecule was continuously adjusted to maintain constant tension after introducing free protein (2) and after removing free protein (3) to measure gp32 binding and dissociation. (B) At a fixed force of 15 pN, the extension of ssDNA in the presence of 100 nM gp32 (blue) shows multiple binding phases with measured amplitudes of DNA extension change (Δx): an initial fast compaction (Δx+1) followed by two distinct elongation events with different kinetic rates (Δx+2 and Δx+3). Upon removal of free, unbound gp32 (red), two dissociation steps are observed. Initial dissociation results in recompaction of the substrate (Δx1). Subsequent dissociation is marked by a slow increase in ssDNA extension as the DNA returns to its initial protein-free conformation (Δx2 = 0). (C) The DNA was slowly (∼10 nm/s) stretched (blue) and released (light blue) in the presence of 100 nM gp32. At forces above ∼10 pN, gp32 compacts the DNA. Below ∼10 pN, the protein-DNA complex is elongated relative to bare ssDNA (purple with dashed black line showing fit to FJC). Notably, the release curve exhibits hysteresis (inset) between ∼5 and 30 pN tension.
Figure 2.
Figure 2.
Binding dynamics of *II truncate. (A) The noncooperative *II gp32 truncate exhibits single-phase binding (blue, inset shows magnified exponential fit) with significantly reduced compaction relative to WT gp32. When free *II is removed (red) the ssDNA exponentially elongates back to its original length on a 10 s timescale, consistent with full dissociation of protein. (B) The measured rate of protein binding (ckon) is directly proportional to protein concentration and linearly fit to compute the concentration-independent bimolecular on-rate and KD of *II at 15 pN. (C) When the ssDNA is slowly stretched (∼10 nm/s) in the presence of a saturating concentration (2 μM) of *II, the DNA is measurably shorter at high force (>10 pN) and longer at low force (<10 pN) due to changes in the contour and persistence lengths. The force-extension curve of the *II-saturated DNA was fit with the freely jointed chain (FJC) up to 10 pN (inset) to compute the contour (L) and persistence (p) lengths of the complex. (D) The average extension change of ssDNA as a result of *II binding is calculated at every force (1 pN increments) and plotted as a function of ssDNA tension (purple curve with dashed lines showing SEM).
Figure 3.
Figure 3.
Contour and persistence lengths of gp32–ssDNA complexes. The ssDNA was slowly (∼10 nm/s) stretched (A) and released (B) in the presence of different concentrations of WT gp32. The protein–DNA complex becomes more extended as concentration is increased. In contrast to *II, the release curves exhibit an increase in extension (hysteresis, shown also in Figure 1C) relative to the initial stretch curves. The force-extension curves were fit with the WLC model up to 5 pN (insets) to compute the contour and persistence lengths of the complex. (C) The contour length reduction (relative to bare ssDNA, purple square) of WT is greater than *II (blue diamonds) but decreases with concentration during both stretch (filled circles) and release (empty circles). (D) Under the same conditions as shown in panel C, the WT complex exhibits a significantly greater persistence length than that of *II, plateauing to ∼20 nm at high protein concentration. The persistence lengths of the gp32–ssDNA complexes following release are nearly equivalent to those of the initial stretch.
Figure 4.
Figure 4.
AFM imaging of gp32–ssDNA complex. (A) AFM image of 7249 nt long ssDNA incubated with 1 μM gp32. While protein-free ssDNA (inset, same scale) is condensed due to its tendency to fold back on itself, a result of its short persistence length and the formation of secondary structure formed between complementary bases in different regions of the ssDNA, the protein-saturated ssDNA forms one long continuous filament that can be traced along the 2D surface. (B) Traces of individual molecules are used to measure the average value of the cosine of the change in orientation angle (θ) between any two points separated by a length (L) along the trace. Average cos(θ) decreases exponentially as L increases, consistent with the WLC model. Fitting this decay parameter yields an effective persistence length (red line). (C) The total integrated volume of ssDNA molecules incubated with varying concentrations of gp32 is measured as a proxy for total protein bound to the substrate. At high concentration, the volume increases nearly 10× as compared to protein-free ssDNA, indicating the ssDNA–gp32 complex is protein-saturated.
Figure 5.
Figure 5.
Force dependence of gp32 binding. (A) Representative curve (left) and average extension changes (right) associated with binding of 100 nM gp32 at 5 pN. At this force, no gp32-mediated compaction is observed (Δx+1 = 0). Instead, the DNA is immediately elongated in two kinetically distinct phases: an initial rapid elongation (Δx+2) followed by a slower elongation that equilibrates to a final extension (Δx+3). The curves are fit with a two-rate decaying exponential function to extract the rates and amplitudes associated with both phases of ssDNA elongation. (B) Representative curves (left) and average extension changes (right) associated with binding of 100 nM gp32 as a function of tension. At forces ≥10 pN, gp32 compacts the ssDNA. Between 10 and 20 pN the DNA compaction increases with tension and the extension of the substrate exhibits multiple phases during protein binding: an initial compaction (Δx+1) followed by two partial elongation events (Δx+2 and Δx+3). Following compaction, the curves are fit with a two-rate decaying exponential to extract the amplitude and rate associated with each phase of elongation. Further increase in tension results in a single-phased extension reduction that decreases with force. (C) The rate of each binding phase is calculated as a function of ssDNA tension. The initial compaction rate (k+1, blue) decreases exponentially with force (fit shown as dashed black line). The rate of rapid elongation (k+2, red) increases with tension and approaches the low force compaction rate. The secondary elongation rate (k+3, green) is significantly slower but increases exponentially with tension (fit shown as dashed black line in inset with log-linear scale). (D) The average ssDNA extension change as a result of gp32 binding is calculated at every force (1 pN increments, blue curve with dashed lines showing SEM) and compared with the extension change of ssDNA saturated with *II (purple curve, replotted from Figure 2D). WT extension changes are consistent with equilibrium extension changes from constant force measurements (red circles).
Figure 6.
Figure 6.
Force dependence of gp32 dissociation. Representative dissociation curves following incubation with 100 nM gp32. Note, representative initial and final dissociation curves are shown as separate panels for clarity (see Figure 1B for full trace of gp32 dissociation). (A) Upon removal of free protein, initial dissociation of gp32 leads to recompaction of the ssDNA at forces ≤20 pN. Recompaction of the DNA is linear in time and fit with a straight line to compute an initial dissociation rate. (B) Further dissociation, occurring after recompaction, is marked by an increase in extension as the DNA returns to its protein-free conformation (t = 0 s corresponds to the beginning of the elongation phase, occurring ∼200 s after free protein is removed). While at high tensions, dissociation is characterized by a single exponential, lower tensions result in an initial near linear elongation (up to ∼200 s), before exponentially decaying to the ssDNA’s protein-free extension. The curves are fit with a single decaying exponential following the linear phase of elongation (i.e. upon initial decay of the DNA elongation phase) to approximate a final dissociation rate. Both the initial (C) and final (D) dissociation rates increase with tension.
Figure 7.
Figure 7.
Concentration dependence of gp32 binding. (A) Representative curves (left) and average extension changes (right) associated with binding of gp32 as a function of free protein concentration at 15 pN. Both the maximum initial compaction (Δx+1) and the equilibrium extension reduction of the ssDNA decrease with protein concentration. Rapid elongation (Δx+2) is only observed at concentrations ≥100 nM. Additionally, slow partial elongation of the DNA (Δx+3) vanishes at 5 nM. Under the conditions in which we observe biphasic elongation, the curves are fit with a two-rate decaying exponential to extract the rates and amplitudes of those phases. (B) Representative curves (left) and average extension changes (right) associated with the binding of gp32 as a function of concentration at 5 pN. The elongation of the ssDNA is biphasic at concentrations ≥100 nM, marked by an initial rapid increase in DNA extension (Δx+2) which is followed by a slower elongation event that equilibrates to a final extension (Δx+3). Both the transient elongation and the equilibrium extension of the ssDNA increase with protein concentration. (C) The rate of each binding phase is calculated as a function of gp32 concentration at 15 pN. The rate of compaction (k+1, green) initially increases linearly with concentration before approaching an asymptote at high protein concentration. The rate of rapid elongation (k+2, red) increases with concentration and is approximately equivalent to the initial compaction rate. The slow elongation step (k+3, purple), however, is independent of the free protein concentration. (D) The rate of each binding phase is calculated as a function of gp32 concentration at 5 pN. The initial elongation of the DNA (k+2, pink) increases with concentration. However, this rate is ∼2-fold slower than at 15 pN (fit line from C replotted in grey for comparison). The secondary elongation step (k+3, blue) is slightly slower than that measured at 15 pN (fit line from C replotted in grey for comparison). (E) ssDNA compaction was monitored during sequential changes in protein concentration. In the presence of 5 nM gp32 (purple), the ssDNA exhibits compaction without subsequent elongation. When free protein is rinsed out (blue) and replaced with 100 nM gp32 (yellow), the extension increases and equilibrates to a length consistent with that observed when the DNA is incubated directly with 100 nM (panel A, yellow). (F) When the concentration is switched from 100 nM (yellow) to 1000 nM (red), the complex equilibrates to an extension consistent with that observed when the DNA is incubated directly with 1000 nM (panel A, red).
Figure 8.
Figure 8.
Concentration dependence of gp32 dissociation. (A) Representative curves associated with the initial dissociation phase of gp32. At protein incubation concentrations ≤100 nM recompaction of the ssDNA during initial dissociation is strictly linear in time. At high protein concentrations (≥300 nM) the DNA exhibits two phases of recompaction: an initial rapid exponential recompaction followed by a slower linear recompaction. The curves are fit with the sum of a linear and single decaying exponential function to extract the rates of both compaction phases. Both the linear (B) and fast exponential (C) dissociation rates are largely insensitive to initial protein incubation concentration.
Figure 9.
Figure 9.
Geometric parameters of gp32–ssDNA helix. (A) Geometrical model of an ideal protein–DNA helix relating the ssDNA contour length (L), helix length (length along translational axis, L′), radius (R) and pitch (ρ). gp32–ssDNA helix parameters are calculated as functions of protein concentration using the measured contour length of bare ssDNA (L = 0.56 nm/nt), effective contour lengths of the protein–DNA complex (L′, Figure 3C), and helix radius (R = 2.1 nm – measured by AFM, see Figure 4 and its discussion in the main text). The ratio L/L′ (B), the protein binding site size (bss, C), and the twist angle between neighboring proteins (α, D) decrease with free protein concentration. The helical pitch (ρ, E), number of proteins per turn (N, F) and the protein density (G) increase with concentration. The helical parameters associated with the longest observed gp32-DNA contour length measured at 1 μM [gp32] during release (Figure 3C, open red circle) are indicated by a magenta diamond. The protein density at which we begin to observe the rapid exponential dissociation phase is indicated by a dashed line in (G).
Figure 10.
Figure 10.
gp32 binding states and function. (A) Diagram illustrating the different concentration-dependent gp32 binding states and pathways measured in this study. gp32 binding reduces the contour length (L) and increases the persistence length (p) of ssDNA. At gp32 concentrations approximately equal to KD (∼5 nM), gp32 filamentation along the ssDNA is incomplete. At [gp32] > KD (∼25 nM), the DNA is optimally saturated and filamented with gp32, giving rise to an increase in persistence length as the complex reorganizes into its most stable conformation. At protein concentrations well above saturating (∼1000 nM), the protein density along the DNA increases further, resulting in an increase in the protein-DNA contour length as the complex equilibrates to a more extended (Δx) and less stable conformation. (B) Diagram illustrating a model for the function of gp32’s unstable binding mode during DNA replication. During lagging strand synthesis, Okazaki fragments are formed (1) and subsequently coated with gp32 in a stable binding conformation (2). Polymerization along the strand drives an increase in protein density as the ssDNA segment shortens, forcing the gp32 filament to adopt a less stable conformation (3) that results in rapid protein dissociation and recycling (4). This process continues until the lagging strand is completely synthesized (5).

Similar articles

Cited by

References

    1. Alberts B.M. Prokaryotic DNA replication mechanisms. Philos. Trans. R. Soc. Lond. B Biol. Sci. 1987; 317:395–420. - PubMed
    1. Johnson A., O’Donnell M. Cellular DNA replicases: components and dynamics at the replication fork. Annu. Rev. Biochem. 2005; 74:283–315. - PubMed
    1. Mueser T.C., Hinerman J.M., Devos J.M., Boyer R.A., Williams K.J.. Structural analysis of bacteriophage T4 DNA replication: a review in the Virology Journal series on bacteriophage T4 and its relatives. Virol J. 2010; 7:359. - PMC - PubMed
    1. Nossal N. Molecular biology of bacteriophage T4. Am. Soc. Microbiol. 1994; 43–53.
    1. Alberts B.M., Frey L.. T4 bacteriophage gene 32: a structural protein in the replication and recombination of DNA. Nature. 1970; 227:1313–1318. - PubMed

Publication types

MeSH terms