. 2023 Aug 4;13(8):1826-1843.
doi: 10.1158/2159-8290.CD-22-0412.

Spectrum of Response to Platinum and PARP Inhibitors in Germline BRCA-Associated Pancreatic Cancer in the Clinical and Preclinical Setting

Affiliations

Spectrum of Response to Platinum and PARP Inhibitors in Germline BRCA-Associated Pancreatic Cancer in the Clinical and Preclinical Setting

Chani Stossel et al. Cancer Discov. .

Abstract

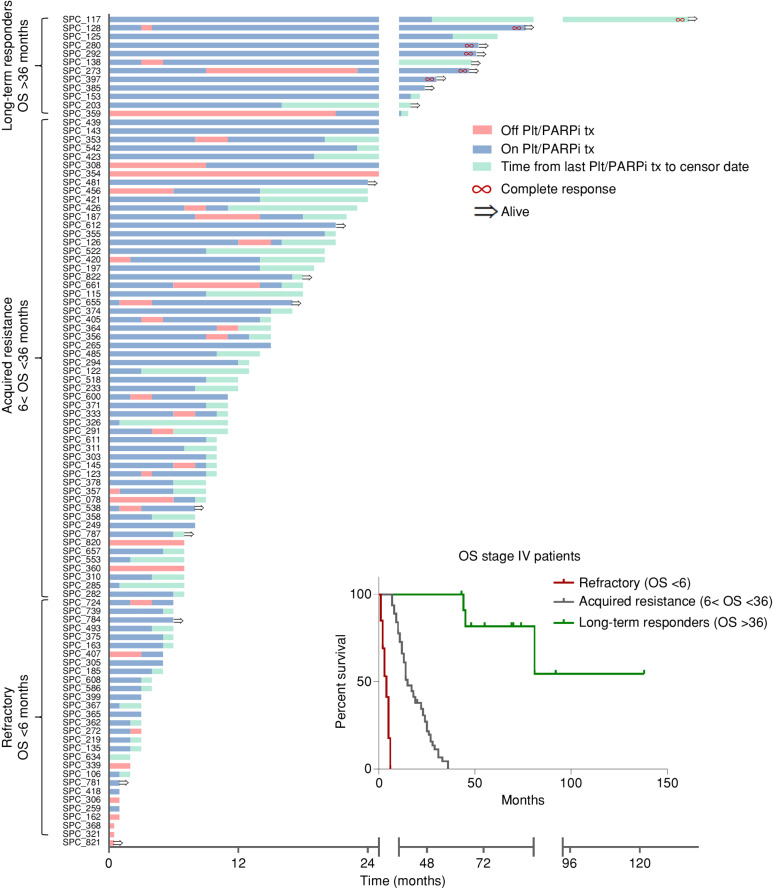
Germline BRCA-associated pancreatic ductal adenocarcinoma (glBRCA PDAC) tumors are susceptible to platinum and PARP inhibition. The clinical outcomes of 125 patients with glBRCA PDAC were stratified based on the spectrum of response to platinum/PARP inhibition: (i) refractory [overall survival (OS) <6 months], (ii) durable response followed by acquired resistance (OS <36 months), and (iii) long-term responders (OS >36 months). Patient-derived xenografts (PDX) were generated from 25 patients with glBRCA PDAC at different clinical time points. Response to platinum/PARP inhibition in vivo and ex vivo culture (EVOC) correlated with clinical response. We deciphered the mechanisms of resistance in glBRCA PDAC and identified homologous recombination (HR) proficiency and secondary mutations restoring partial functionality as the most dominant resistant mechanism. Yet, a subset of HR-deficient (HRD) patients demonstrated clinical resistance. Their tumors displayed basal-like molecular subtype and were more aneuploid. Tumor mutational burden was high in HRD PDAC and significantly higher in tumors with secondary mutations. Anti-PD-1 attenuated tumor growth in a novel humanized glBRCA PDAC PDX model. This work demonstrates the utility of preclinical models, including EVOC, to predict the response of glBRCA PDAC to treatment, which has the potential to inform time-sensitive medical decisions.

Significance: glBRCA PDAC has a favorable response to platinum/PARP inhibition. However, most patients develop resistance. Additional treatment options for this unique subpopulation are needed. We generated model systems in PDXs and an ex vivo system (EVOC) that faithfully recapitulate these specific clinical scenarios as a platform to investigate the mechanisms of resistance for further drug development. This article is highlighted in the In This Issue feature, p. 1749.


Figures

Figure 1. Spectrum of response for patients with stage IV glBRCA-mutated PDAC. Swimmer plot of glBRCA patients with stage IV PDAC: time from diagnosis until last follow-up or death, with time from diagnosis until last follow-up or death. Blue: time on platinum/PARPi treatment. Red: time off platinum/PARPi treatment. Green: time from last platinum/PARPi treatment to censor date. Red infinity symbol: patients with complete response. Black arrow: patients alive at censor date. Inset, Kaplan–Meier curves of patients by clinical subgroup (red, refractory; gray, acquired resistance; green, long-term responders). Plt/PARPi tx, platinum/PARPi treatment.
Figure 1.
Spectrum of response for patients with stage IV glBRCA-mutated PDAC. Swimmer plot of glBRCA patients with stage IV PDAC: time from diagnosis until last follow-up or death, with time from diagnosis until last follow-up or death. Blue: time on platinum/PARPi treatment. Red: time off platinum/PARPi treatment. Green: time from last platinum/PARPi treatment to censor date. Red infinity symbol: patients with complete response. Black arrow: patients alive at censor date. Inset, Kaplan–Meier curves of patients by clinical subgroup (red, refractory; gray, acquired resistance; green, long-term responders). Plt/PARPi tx, platinum/PARPi treatment.
Figure 2. Efficacy of cisplatin and olaparib in preclinical models and correlation to clinical response. A, In vivo antitumor activity of PARPi (olaparib) and cisplatin in glBRCA PDAC PDXs. Tumor growth (y-axis) for each PDX model after 28 to 52 days (x-axis) of cisplatin (2 mg/kg; i.p.; once weekly) or olaparib (50 mg/kg; i.p.; 5 days on/2 days off) treatment. The dashed line represented a 70% threshold for sensitivity. Columns color code models by the clinical subgroup of response to platinum/PARPi at the time of tissue acquisition (green, sensitive; yellow, refractory; red, acquired resistance; and gray, unknown). B, Tumor growth curves of sensitive (SPC_467; top) and acquired resistance (SPC_187) models. Average relative tumor volume (y-axis) of control, cisplatin-treated (2 mg/kg; i.p; once weekly), and olaparib-treated (50 mg/kg; i.p.; 5 days on/2 days off) mice (n = 6–8 mice/group). C, EVOC H&E representative images of sensitive (SPC_467) and resistant (SPC_187) PDX models. Scale bar indicated in the figure. Insert, magnification ×2.5. D, A 2 × 2 table showing the distribution of responders and nonresponders based on EVOC prediction and clinical actual response to PARPi and platinum agents. E, Correlation between the in vivo and EVOC efficacy for each model and treatment; y-axis, in vivo tumor growth (%); x-axis, EVOC score (0–60 resistant; 61–100 sensitive); black circles [cisplatin (Cis)]; and gray circles [olaparib (Olap)]. r2 = 0.59; P < 0.001.
Figure 2.
Efficacy of cisplatin and olaparib in preclinical models and correlation to clinical response. A,In vivo antitumor activity of PARPi (olaparib) and cisplatin in glBRCA PDAC PDXs. Tumor growth (y-axis) for each PDX model after 28 to 52 days (x-axis) of cisplatin (2 mg/kg; i.p.; once weekly) or olaparib (50 mg/kg; i.p.; 5 days on/2 days off) treatment. The dashed line represented a 70% threshold for sensitivity. Columns color code models by the clinical subgroup of response to platinum/PARPi at the time of tissue acquisition (green, sensitive; yellow, refractory; red, acquired resistance; and gray, unknown). B, Tumor growth curves of sensitive (SPC_467; top) and acquired resistance (SPC_187) models. Average relative tumor volume (y-axis) of control, cisplatin-treated (2 mg/kg; i.p; once weekly), and olaparib-treated (50 mg/kg; i.p.; 5 days on/2 days off) mice (n = 6–8 mice/group). C, EVOC H&E representative images of sensitive (SPC_467) and resistant (SPC_187) PDX models. Scale bar indicated in the figure. Insert, magnification ×2.5. D, A 2 × 2 table showing the distribution of responders and nonresponders based on EVOC prediction and clinical actual response to PARPi and platinum agents. E, Correlation between the in vivo and EVOC efficacy for each model and treatment; y-axis, in vivo tumor growth (%); x-axis, EVOC score (0–60 resistant; 61–100 sensitive); black circles [cisplatin (Cis)]; and gray circles [olaparib (Olap)]. r2 = 0.59; P < 0.001.
Figure 3. Preclinical olaparib maintenance therapy and establishment of an in vivo acquired resistant model. A, Tumor growth kinetics of two BRCA2-mutated PDAC PDXs with biallelic inactivation. i, SPC_285: Mice were initially randomized to control (vehicle; i.p.; once weekly) or cisplatin (2 mg/kg; i.p.; once weekly); n = 6–7/group. Cisplatin was administrated for 28 days, and mice were then split to continue cisplatin (n = 2) or to switch to maintenance olaparib (50 mg/kg; i.p.; 5 days on/2 days off). ii, SPC_467: Mice were randomized to control (n = 7), olaparib (n = 5), or cisplatin (n = 13). On day 50, cisplatin-treated mice were switched to olaparib (50 mg/kg/i.p.; 5 days on/2 days off). B, Tumor images of SPC_285 for each treatment group (top, control; middle, cisplatin → olaparib; and bottom, cisplatin) on sacrifice day as indicated. C, H&E representative images of tumors treated in control, cisplatin, and cisplatin → olaparib groups. AR, acquired resistance. D, Top: Venn diagrams showing SNV overlap between platinum-sensitive baseline and AR samples. Scatter plots comparing single-nucleotide variant (SNV) variant allele frequencies (VAF) of AR xenograft samples to paired baseline. Bottom, dotted black line represents y = x, where SNV VAF of AR xenograft is equal to SNV VAF of the baseline. Baseline unique variants are shown in gray, whereas AR unique variants are in red and shared variants in orange. E, Double nucleotide alterations characterized by doublet base substitutions of CT>AA/AC in the acquired resistance exposed to the platinum/PARPi model.
Figure 3.
Preclinical olaparib maintenance therapy and establishment of an in vivo acquired resistant model. A, Tumor growth kinetics of two BRCA2-mutated PDAC PDXs with biallelic inactivation. i, SPC_285: Mice were initially randomized to control (vehicle; i.p.; once weekly) or cisplatin (2 mg/kg; i.p.; once weekly); n = 6–7/group. Cisplatin was administrated for 28 days, and mice were then split to continue cisplatin (n = 2) or to switch to maintenance olaparib (50 mg/kg; i.p.; 5 days on/2 days off). ii, SPC_467: Mice were randomized to control (n = 7), olaparib (n = 5), or cisplatin (n = 13). On day 50, cisplatin-treated mice were switched to olaparib (50 mg/kg/i.p.; 5 days on/2 days off). B, Tumor images of SPC_285 for each treatment group (top, control; middle, cisplatin → olaparib; and bottom, cisplatin) on sacrifice day as indicated. C, H&E representative images of tumors treated in control, cisplatin, and cisplatin → olaparib groups. AR, acquired resistance. D, Top: Venn diagrams showing SNV overlap between platinum-sensitive baseline and AR samples. Scatter plots comparing single-nucleotide variant (SNV) variant allele frequencies (VAF) of AR xenograft samples to paired baseline. Bottom, dotted black line represents y = x, where SNV VAF of AR xenograft is equal to SNV VAF of the baseline. Baseline unique variants are shown in gray, whereas AR unique variants are in red and shared variants in orange. E, Double nucleotide alterations characterized by doublet base substitutions of CT>AA/AC in the acquired resistance exposed to the platinum/PARPi model.
Figure 4. WGS and mechanisms of resistance. A, Genomic mutational profiles of 26 whole-genome sequenced tumors. Tumor mutational burden (TMB), HR status, BRCA gene allelic state, mutated BRCA gene, patient clinical response, patient platinum exposure, presence of platinum mutational signature, HRDetect score, HRD mutational signature proportion, tumor ploidy, and mutations observed in PDAC driver genes are shown. HRD−SM, HRDsecond_mut; SV, structural variant. B, Table of resistant samples with specific information. WT, wild-type. C, Illustration of secondary mutation reversing reading frame back to WT in patient SPC_187. D, Integrative Genomics Viewer (IGV) snapshot of SPC_291 WGS reads mapping to the BRCA2 locus. Reads from normal are shown in the middle, where the blue box highlights a 1-bp germline frameshift with a zoomed-in view on the right. Reads from tumor are shown on top, where the orange box highlights a somatic SV that deletes the region around the germline frameshift. Zoomed-in view of somatic SV breakpoints at the bottom shows BRCA2 codons reverted to inframe as a result of SV. E, IGV snapshot capturing the BRCA2 germline (left) and the somatic (right) insertion or deletion (indel) frameshift in SPC285. Reads mapping to this region are shown for the germline reference (bottom), platinum-sensitive baseline xenograft (middle), and acquired resistance (AR) xenograft (top). The AR clone was analyzed by WGS and compared with baseline PDX. F, Distance from diploid [absolute(ploidy-2)] in resistant and sensitive samples (P < 0.05). G, Molecular subtype by response—basal-like score–classical score in resistant and sensitive samples (P < 0.05). H, SHAP analysis. A detailed perspective on the contribution of the various factors to the resistance classification score. Each line corresponds to one factor and each dot in it to a single sample (patient). The color of the dot represents the value of the factor for that sample (high BRCA allelic state value corresponds to monoallelic, high reversion-mutation value corresponds to the presence of the reverse mutation, high subtype value corresponds to “basal-like,” high sex value corresponds to female, and high BRCA value corresponds to BRCA2). The location of the dot on the x-axis is the relevant SHAP value of that factor for that sample. As an example, the red dots on the far right at the “Reversion mutation” line indicate that the presence of this mutation (in five patients) is a very strong indicator of resistance. The features on the y-axis are ordered by their average importance.
Figure 4.
WGS and mechanisms of resistance. A, Genomic mutational profiles of 26 whole-genome sequenced tumors. Tumor mutational burden (TMB), HR status, BRCA gene allelic state, mutated BRCA gene, patient clinical response, patient platinum exposure, presence of platinum mutational signature, HRDetect score, HRD mutational signature proportion, tumor ploidy, and mutations observed in PDAC driver genes are shown. HRD−SM, HRDsecond_mut; SV, structural variant. B, Table of resistant samples with specific information. WT, wild-type. C, Illustration of secondary mutation reversing reading frame back to WT in patient SPC_187. D, Integrative Genomics Viewer (IGV) snapshot of SPC_291 WGS reads mapping to the BRCA2 locus. Reads from normal are shown in the middle, where the blue box highlights a 1-bp germline frameshift with a zoomed-in view on the right. Reads from tumor are shown on top, where the orange box highlights a somatic SV that deletes the region around the germline frameshift. Zoomed-in view of somatic SV breakpoints at the bottom shows BRCA2 codons reverted to inframe as a result of SV. E, IGV snapshot capturing the BRCA2 germline (left) and the somatic (right) insertion or deletion (indel) frameshift in SPC285. Reads mapping to this region are shown for the germline reference (bottom), platinum-sensitive baseline xenograft (middle), and acquired resistance (AR) xenograft (top). The AR clone was analyzed by WGS and compared with baseline PDX. F, Distance from diploid [absolute(ploidy-2)] in resistant and sensitive samples (P < 0.05). G, Molecular subtype by response—basal-like score–classical score in resistant and sensitive samples (P < 0.05). H, SHAP analysis. A detailed perspective on the contribution of the various factors to the resistance classification score. Each line corresponds to one factor and each dot in it to a single sample (patient). The color of the dot represents the value of the factor for that sample (high BRCA allelic state value corresponds to monoallelic, high reversion-mutation value corresponds to the presence of the reverse mutation, high subtype value corresponds to “basal-like,” high sex value corresponds to female, and high BRCA value corresponds to BRCA2). The location of the dot on the x-axis is the relevant SHAP value of that factor for that sample. As an example, the red dots on the far right at the “Reversion mutation” line indicate that the presence of this mutation (in five patients) is a very strong indicator of resistance. The features on the y-axis are ordered by their average importance.
Figure 5. Anti–PD-1 efficacy in a humanized glBRCA2 PDAC PDX model. A, Preclinical illustration of humanized mouse model generation. CD34+ cells were isolated from umbilical cord blood by magnetic beads. Purity was validated by FACS analysis. CD34+ cells or PBS control was injected into 3- to 4-week-old sublethal irradiated NSG mice. Peripheral blood was obtained every 2 to 3 weeks, and human CD45 was assessed. On week 18, a PDX tumor chunk was subcutaneously transplanted to mice and treated with pembrolizumab (10 mg/kg; i.p.) or vehicle control. B, Average tumor volume in nonhumanized mice (blue); humanized control-treated (green) mice; and humanized/pembrolizumab-treated mice (red). C, Immune cell characterization: mouse CD45 (mCD45), human CD45 (hCD45), B cells (CD19), and T cells (CD3) in the blood, spleen, and bone marrow of all mice at study termination. D, IHC staining of tumors demonstrating T-cell infiltrate in the CD34+ engrafted mice. Created with BioRender.com.
Figure 5.
Anti–PD-1 efficacy in a humanized glBRCA2 PDAC PDX model. A, Preclinical illustration of humanized mouse model generation. CD34+ cells were isolated from umbilical cord blood by magnetic beads. Purity was validated by FACS analysis. CD34+ cells or PBS control was injected into 3- to 4-week-old sublethal irradiated NSG mice. Peripheral blood was obtained every 2 to 3 weeks, and human CD45 was assessed. On week 18, a PDX tumor chunk was subcutaneously transplanted to mice and treated with pembrolizumab (10 mg/kg; i.p.) or vehicle control. B, Average tumor volume in nonhumanized mice (blue); humanized control-treated (green) mice; and humanized/pembrolizumab-treated mice (red). C, Immune cell characterization: mouse CD45 (mCD45), human CD45 (hCD45), B cells (CD19), and T cells (CD3) in the blood, spleen, and bone marrow of all mice at study termination. D, IHC staining of tumors demonstrating T-cell infiltrate in the CD34+ engrafted mice. Created with BioRender.com.

Comment in

  • 2159-8274. doi: 10.1158/2159-8290.CD-13-8-ITI

References

    1. Conroy T, Desseigne F, Ychou M, Bouche O, Guimbaud R, Becouarn Y, et al. . FOLFIRINOX versus gemcitabine for metastatic pancreatic cancer. N Engl J Med 2011;364:1817–25. - PubMed
    1. Rahib L, Smith BD, Aizenberg R, Rosenzweig AB, Fleshman JM, Matrisian LM. Projecting cancer incidence and deaths to 2030: the unexpected burden of thyroid, liver, and pancreas cancers in the United States. Cancer Res 2014;74:2913–21. - PubMed
    1. Venkitaraman AR. Cancer susceptibility and the functions of BRCA1 and BRCA2. Cell 2002;108:171–82. - PubMed
    1. Golan T, Kanji ZS, Epelbaum R, Devaud N, Dagan E, Holter S, et al. . Overall survival and clinical characteristics of pancreatic cancer in BRCA mutation carriers. Br J Cancer 2014;111:1132–8. - PMC - PubMed
    1. Golan T, Kindler HL, Park JO, Reni M, Macarulla T, Hammel P, et al. . Geographic and ethnic heterogeneity of germline BRCA1 or BRCA2 mutation prevalence among patients with metastatic pancreatic cancer screened for entry into the POLO trial. J Clin Oncol 2020;38:1442–54. - PubMed

Publication types

MeSH terms

Substances