. 2023 Jul 27;66(14):9445-9465.
doi: 10.1021/acs.jmedchem.2c01859. Epub 2023 Jul 14.

Discovery and Characterization of PROTACs Targeting Tissue Transglutaminase (TG2)

Affiliations

Discovery and Characterization of PROTACs Targeting Tissue Transglutaminase (TG2)

Andres Valdivia et al. J Med Chem. .

Abstract

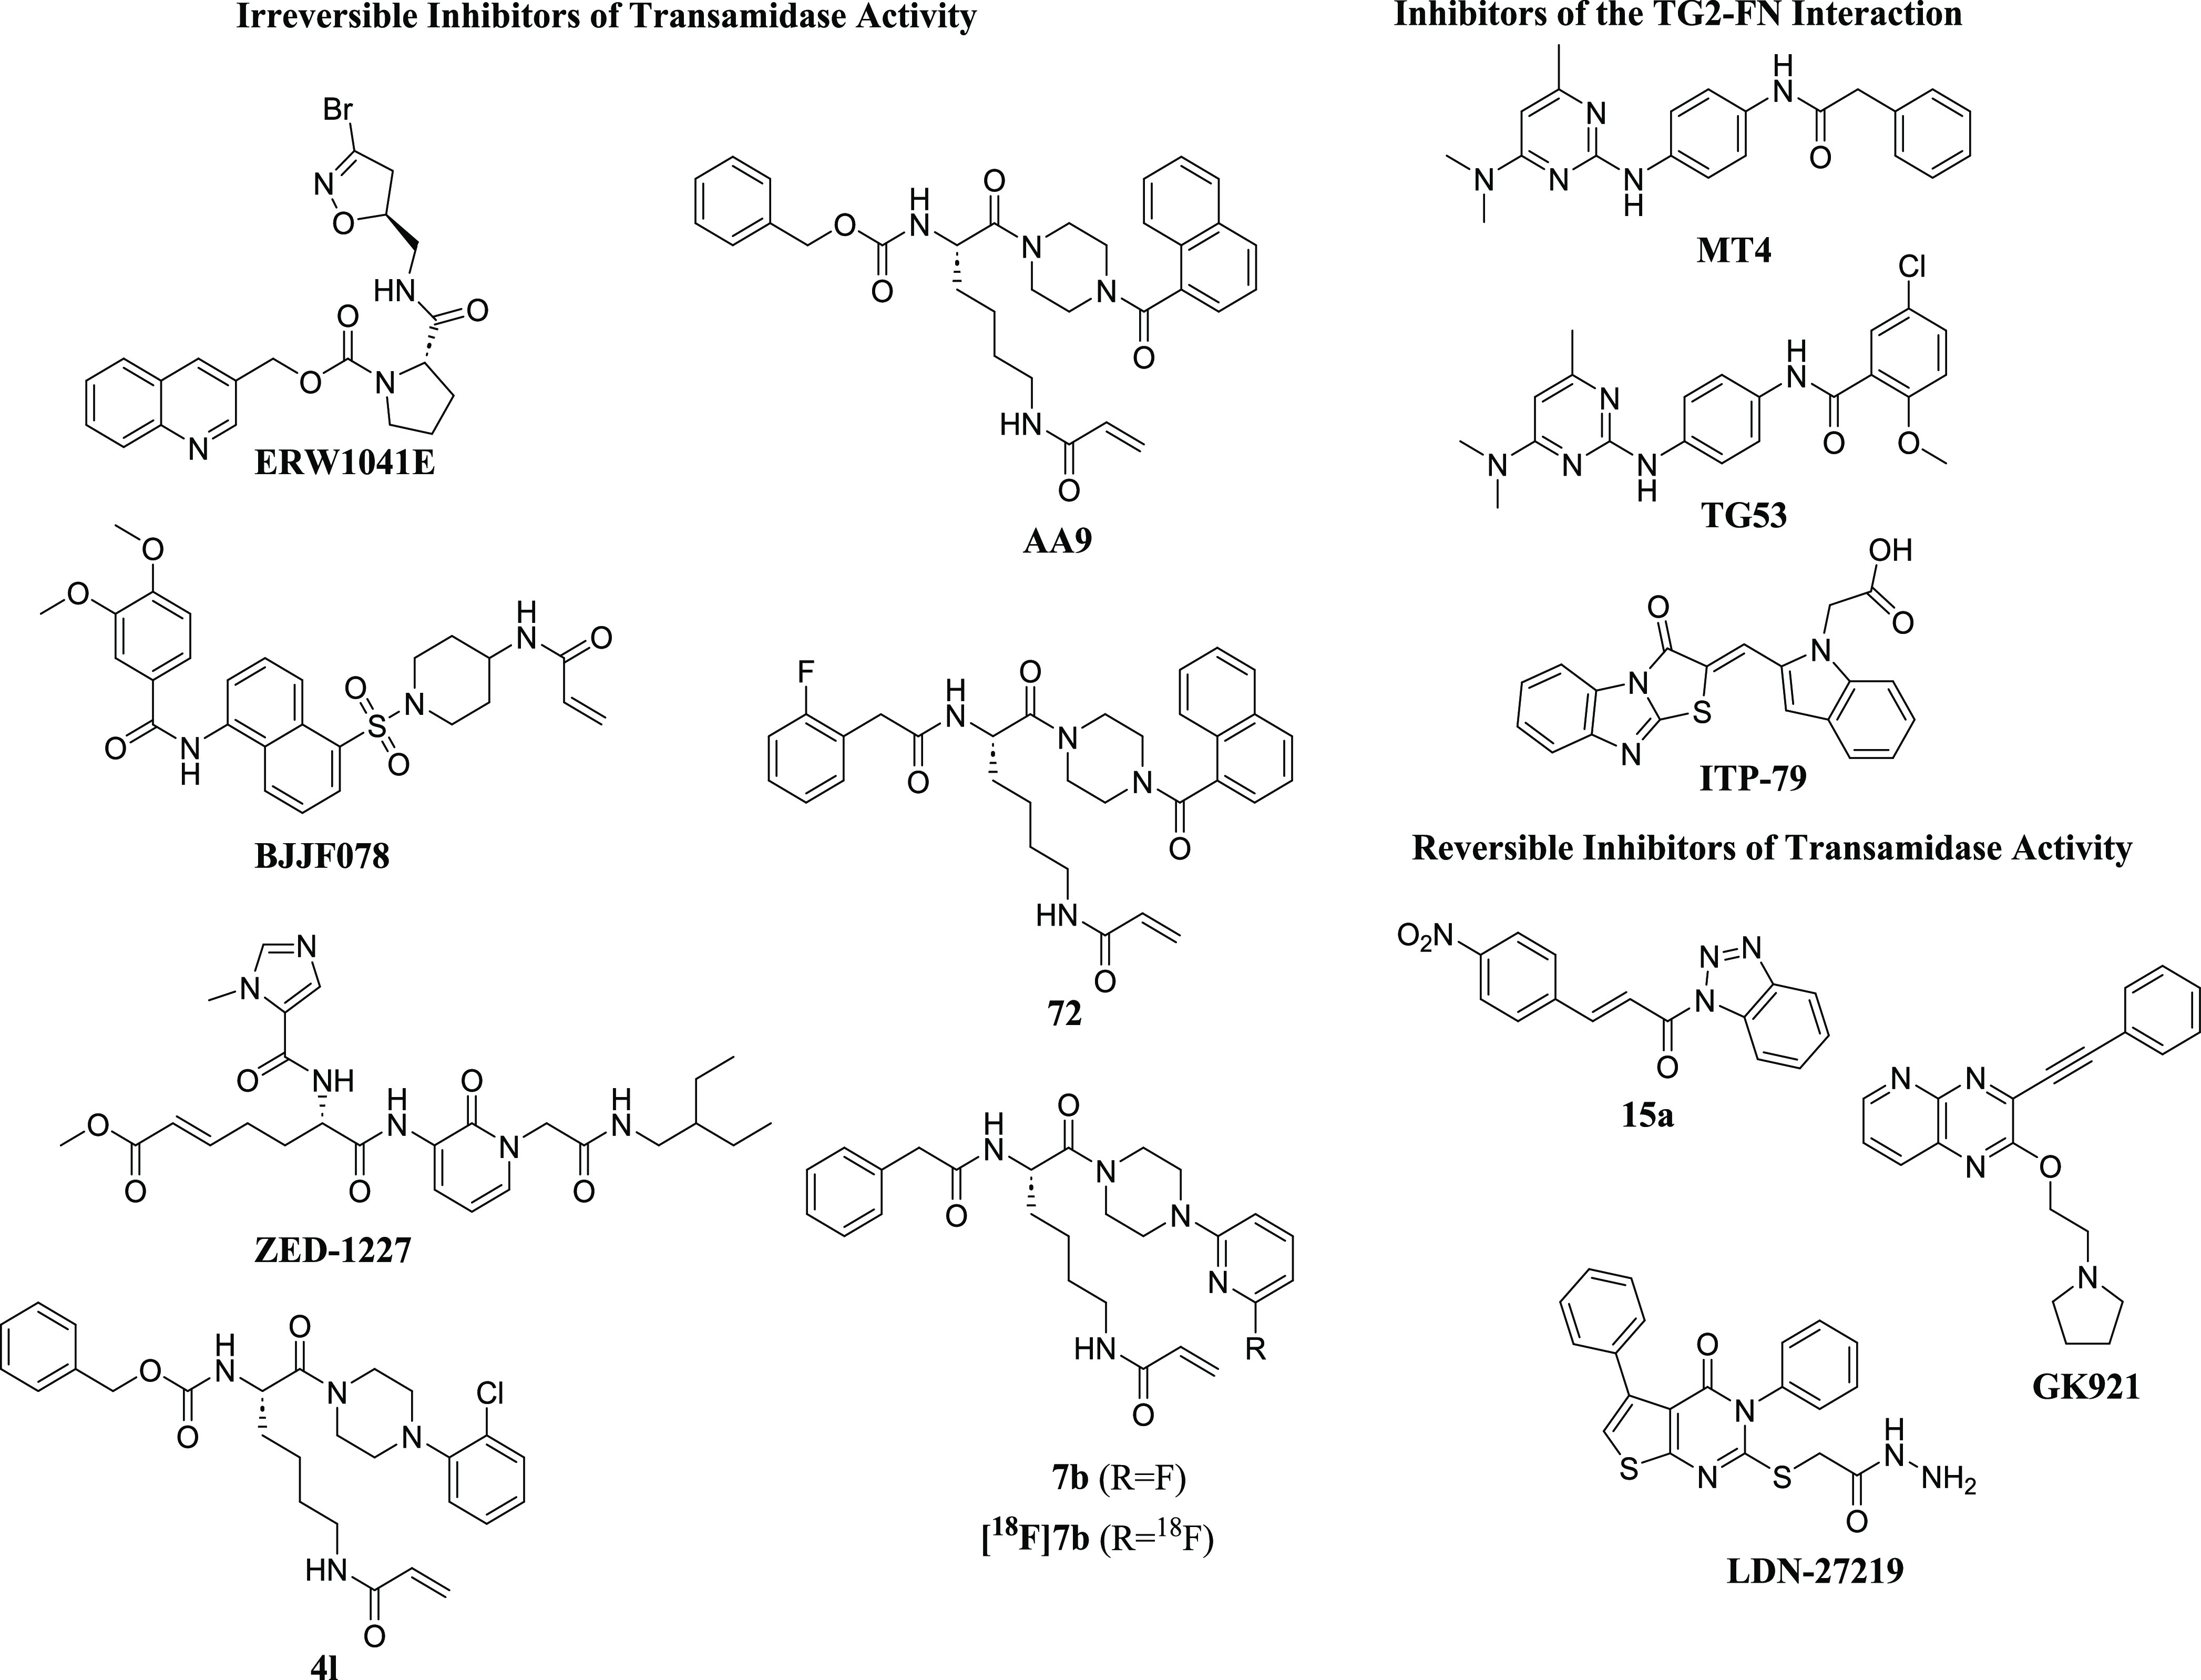
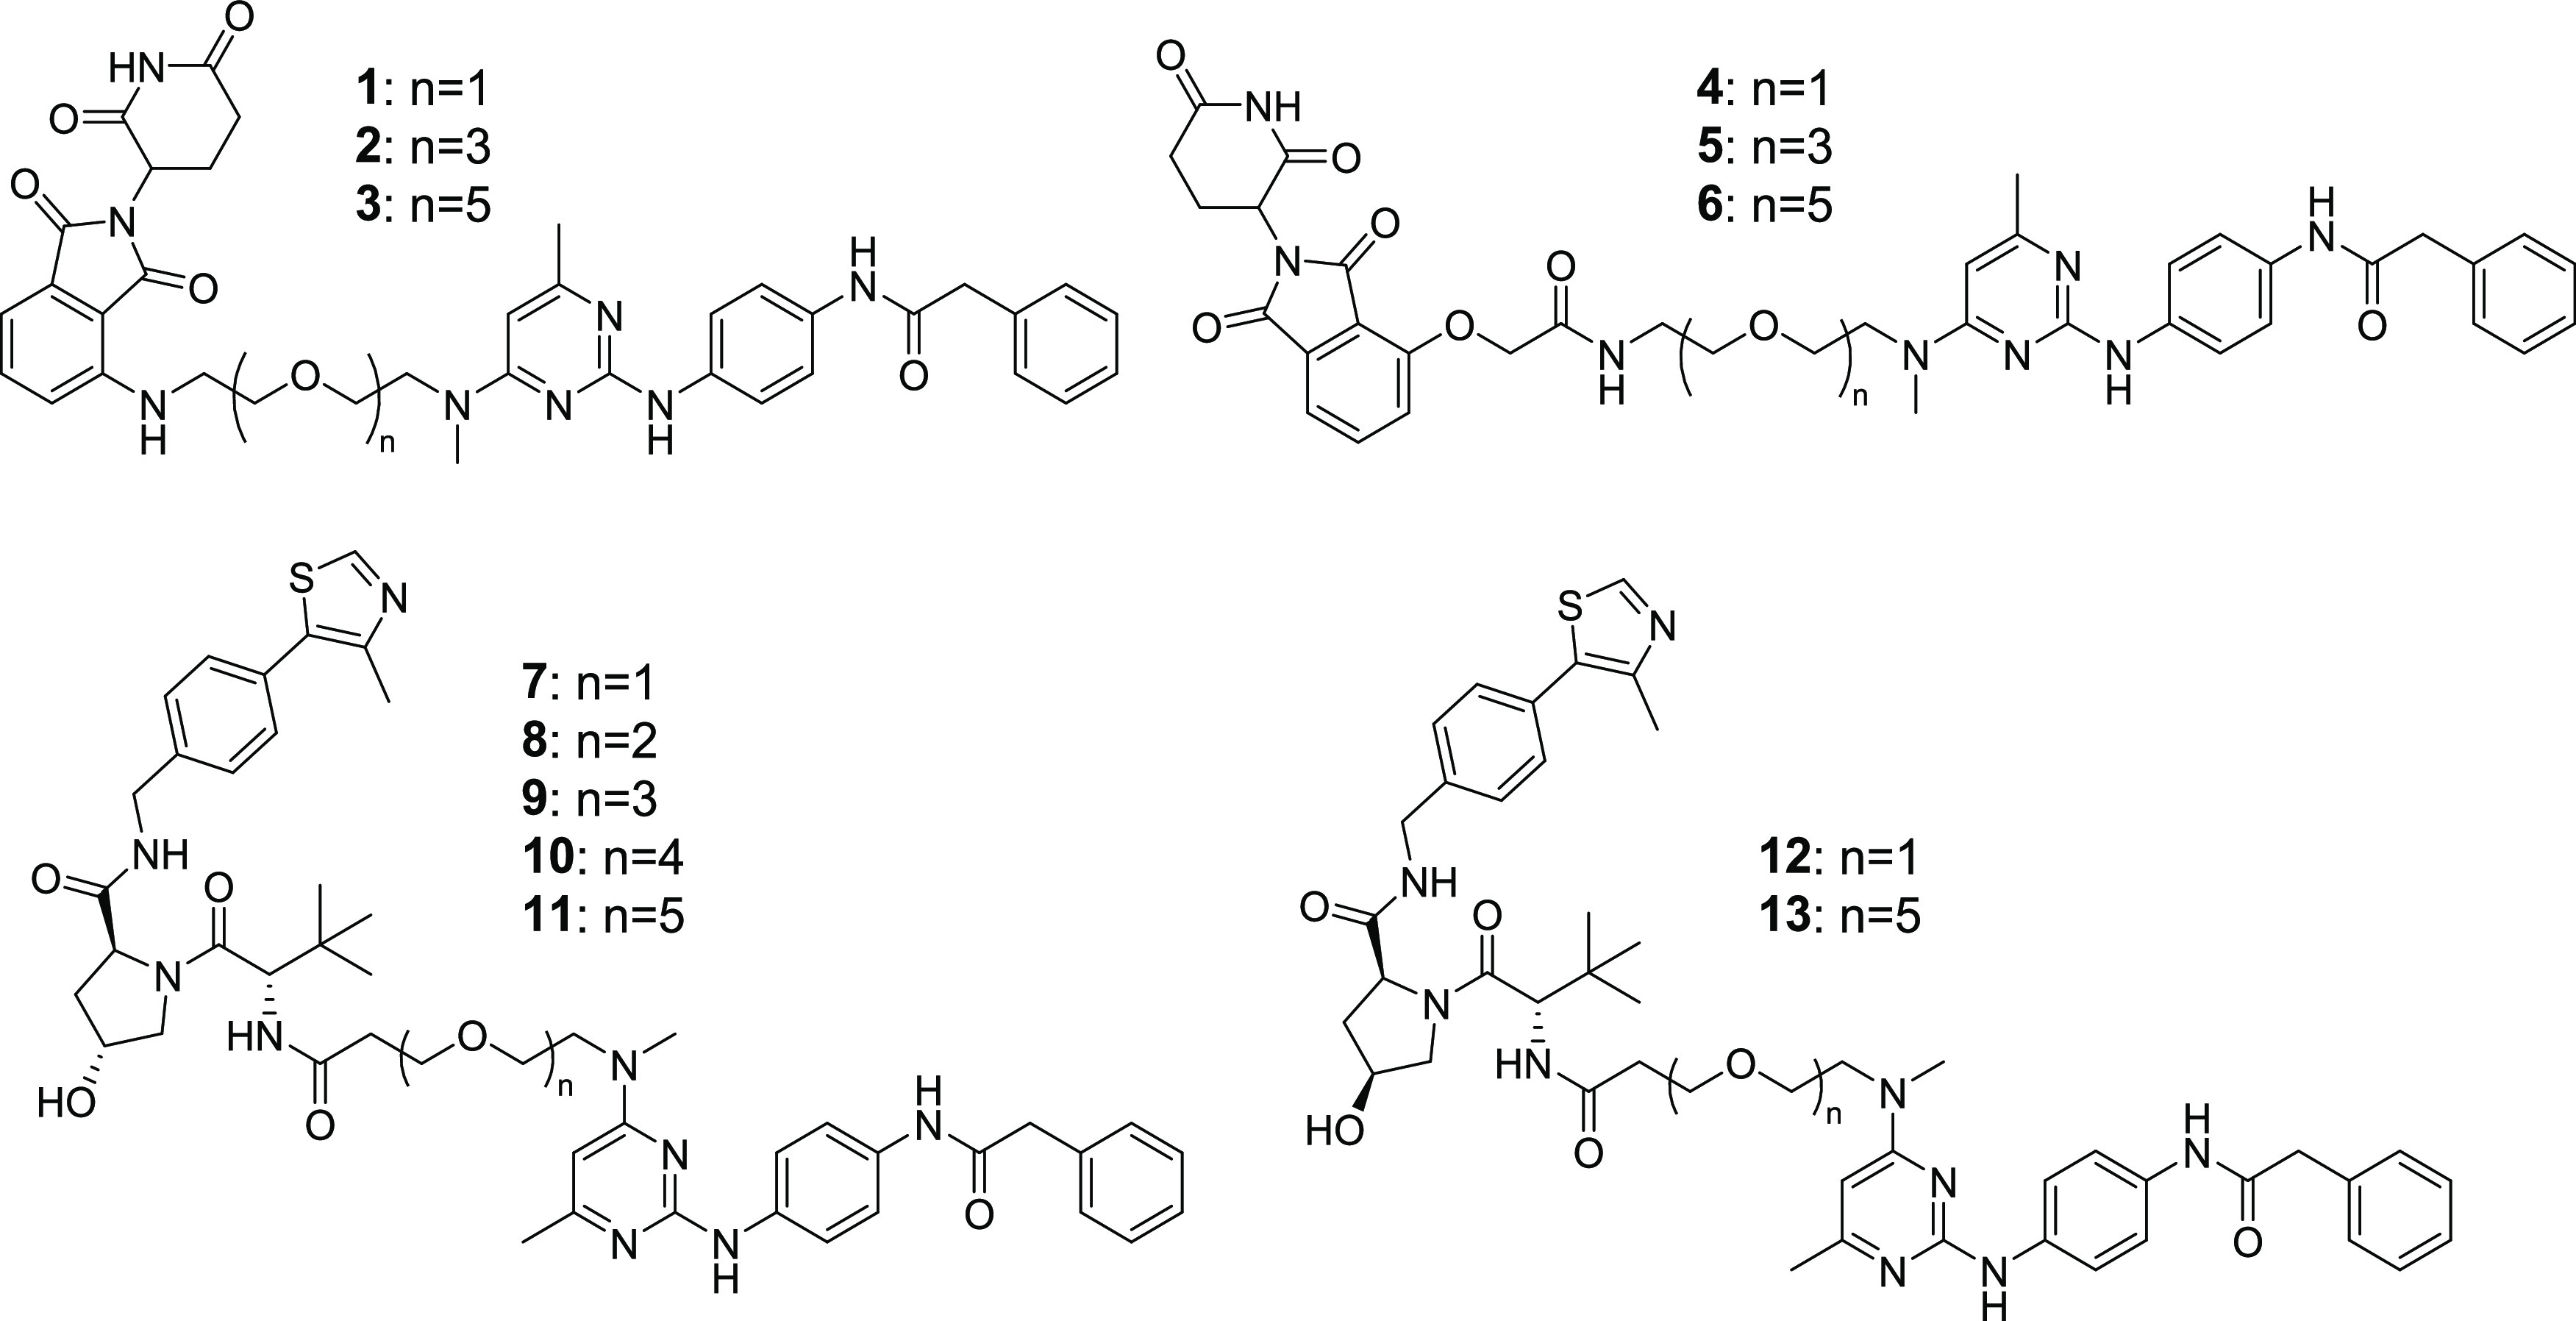
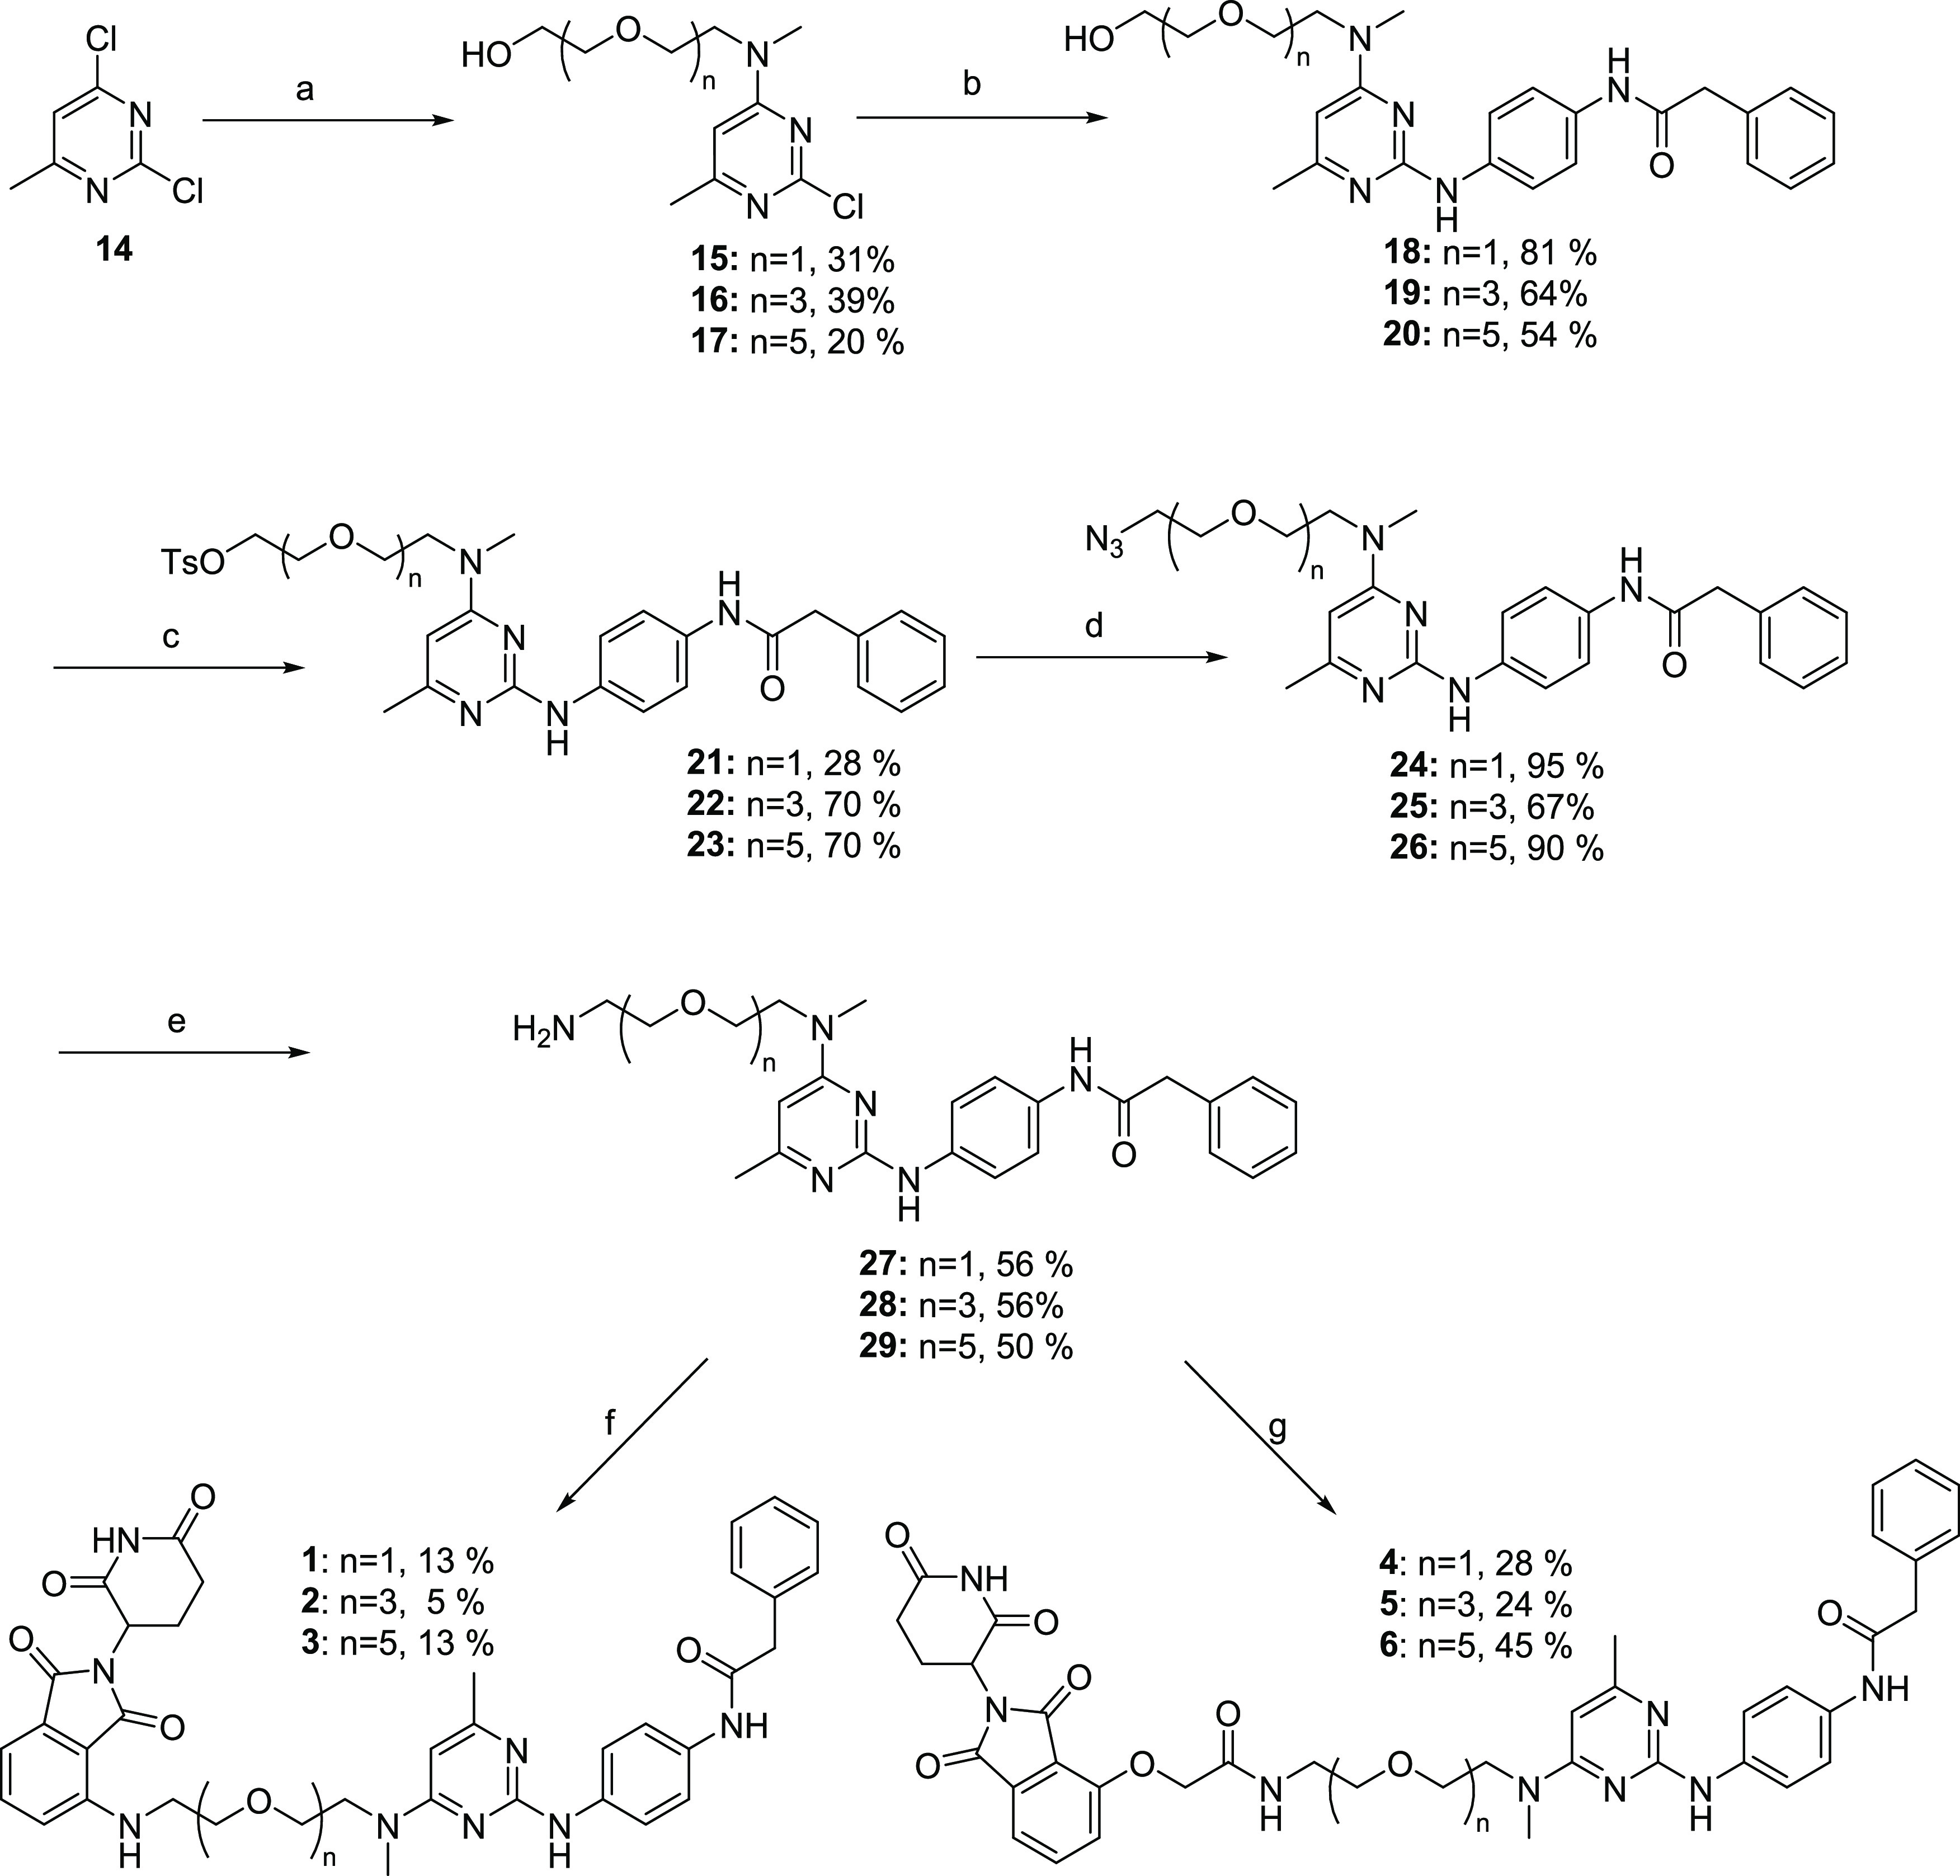
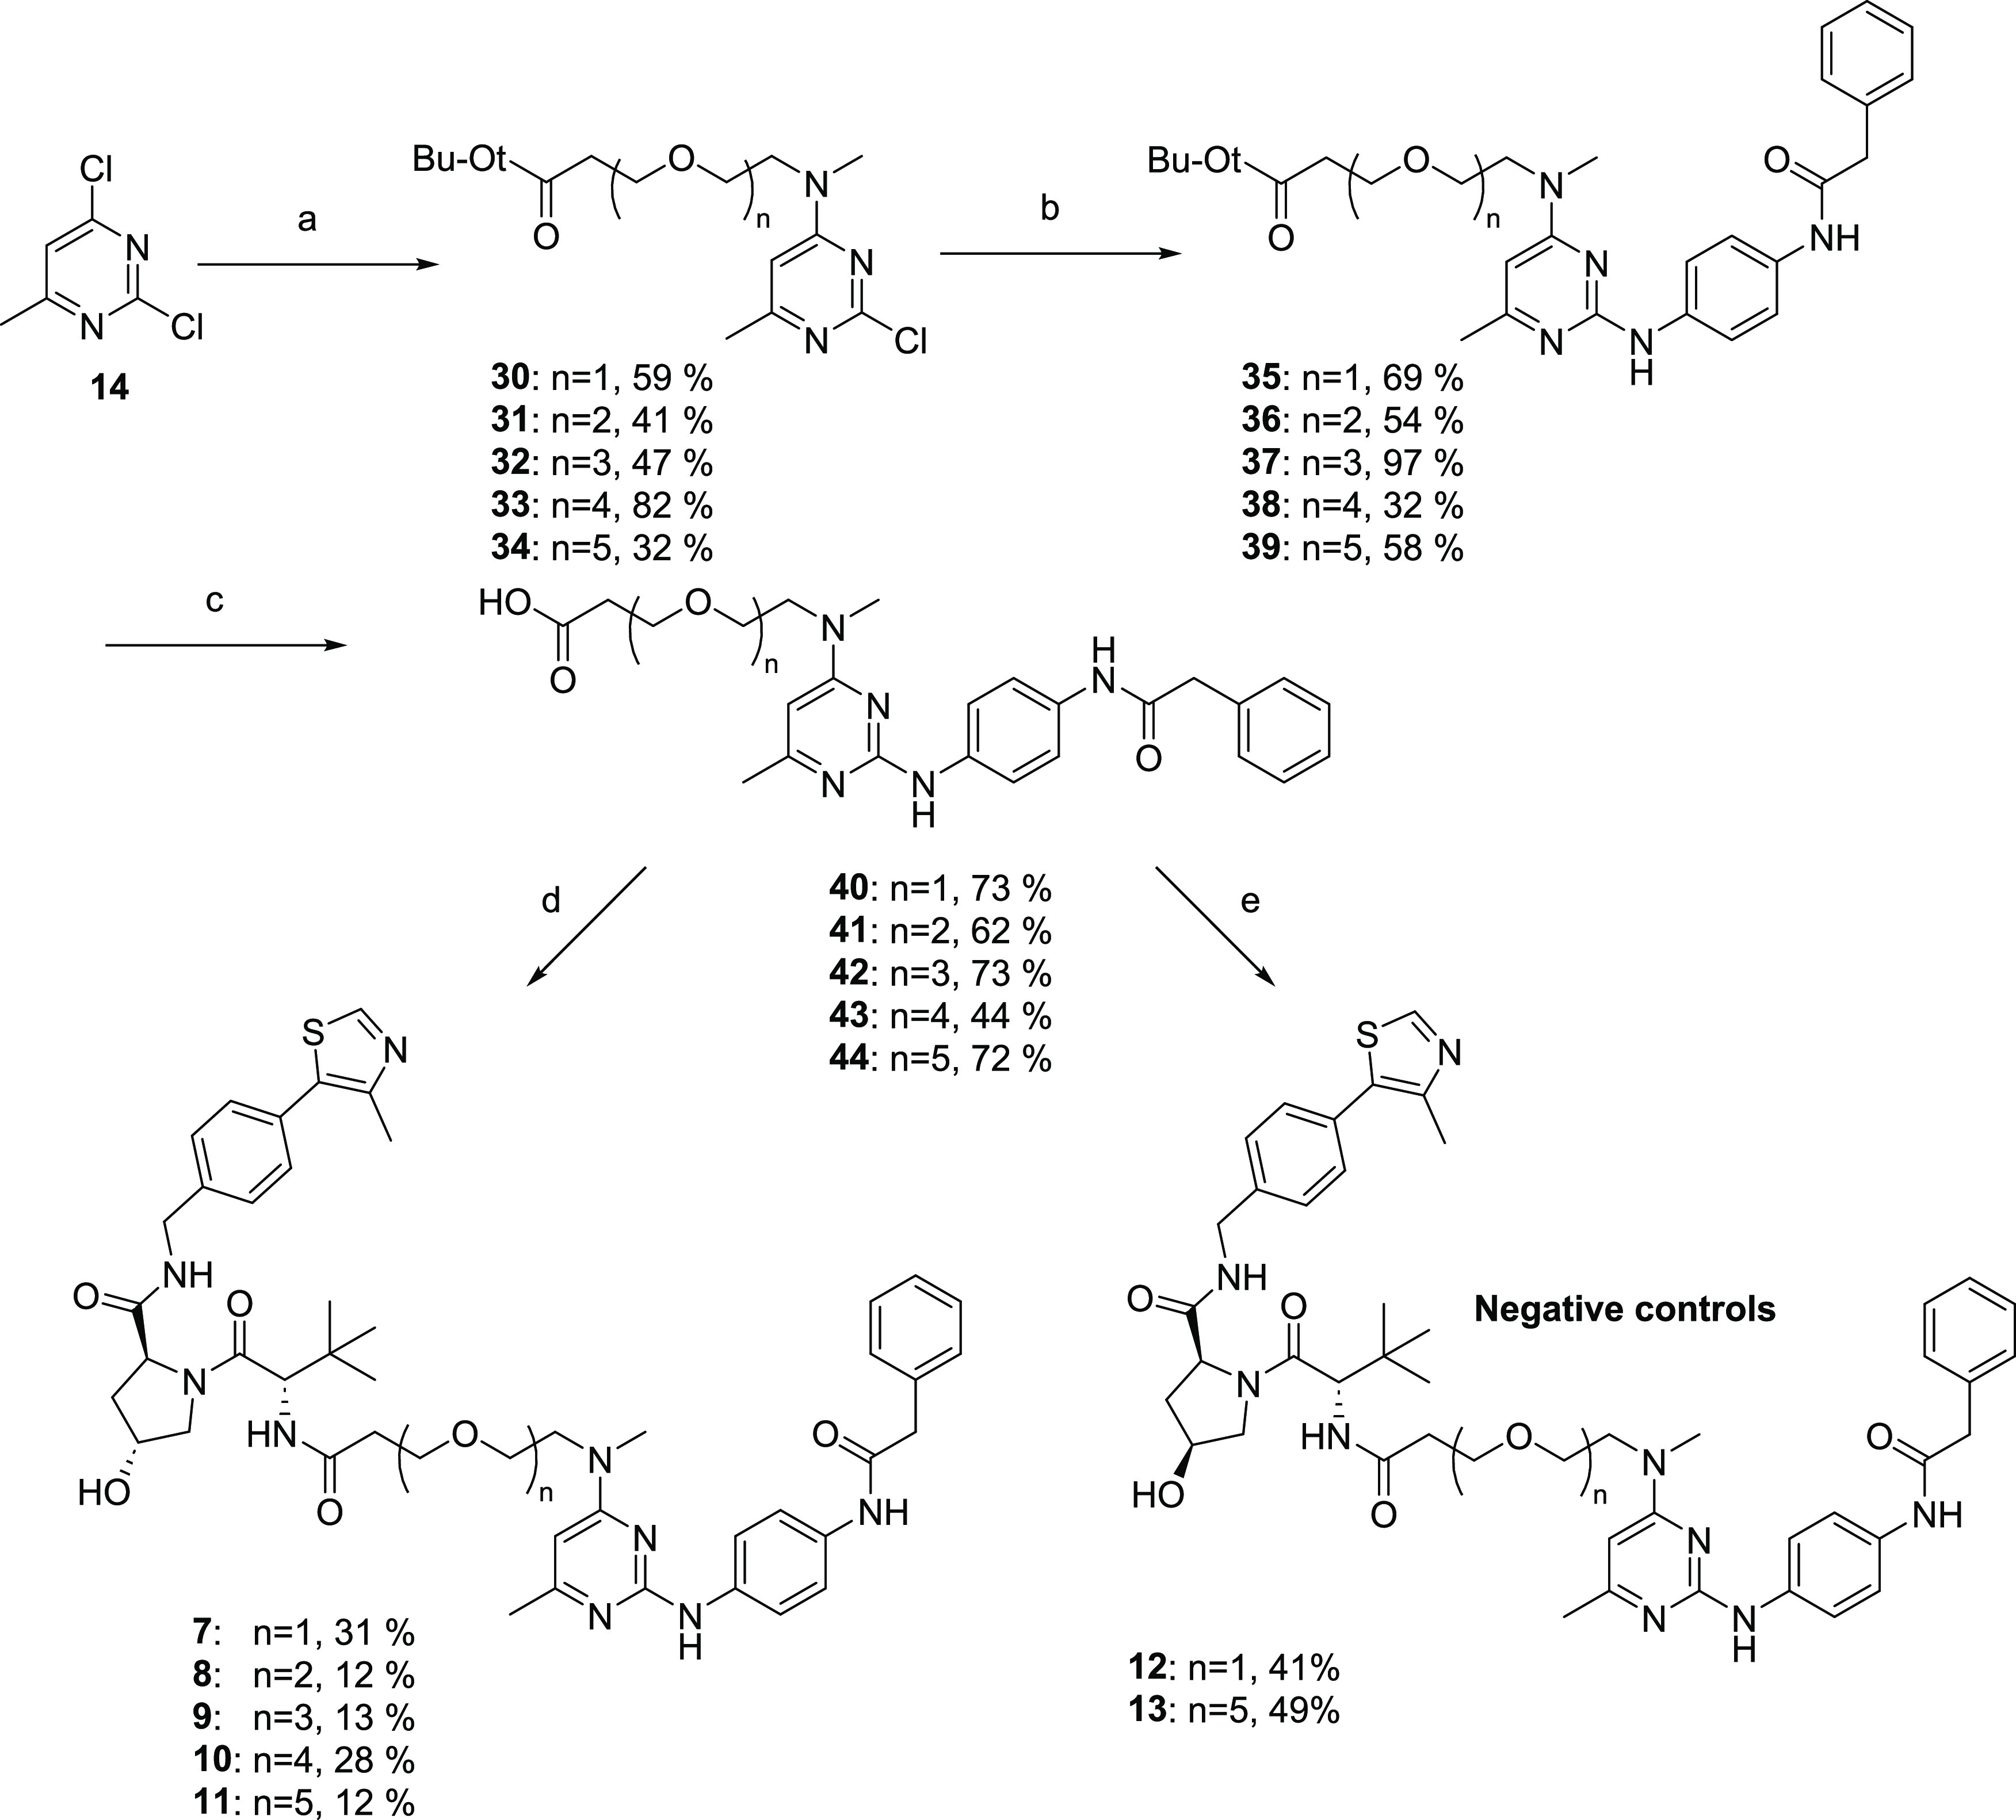
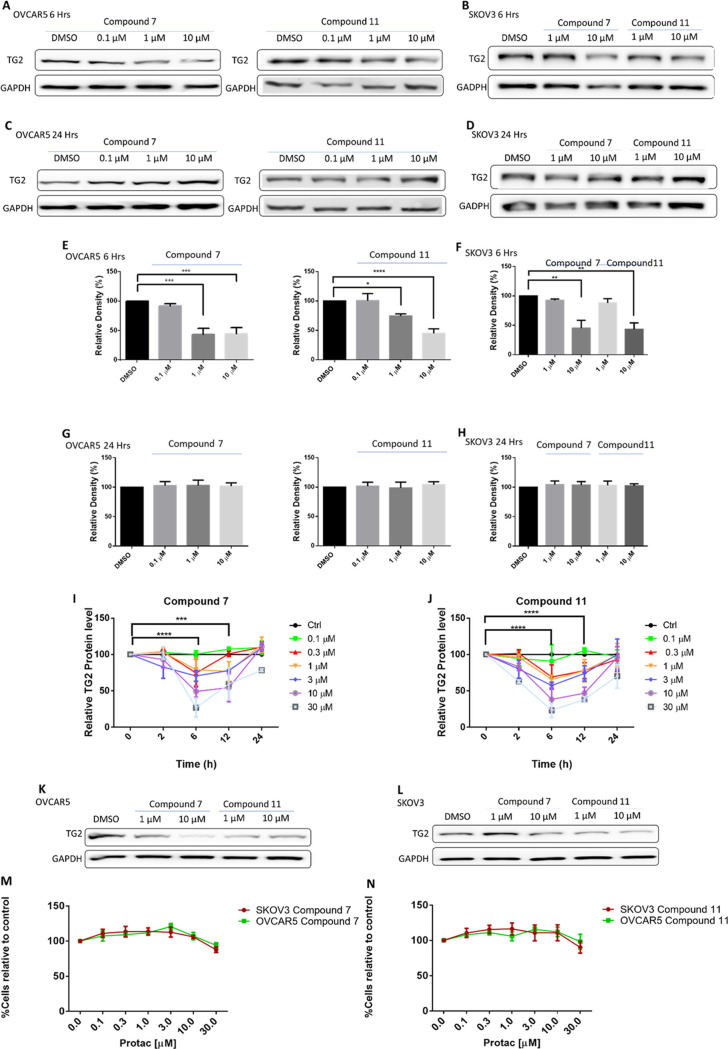
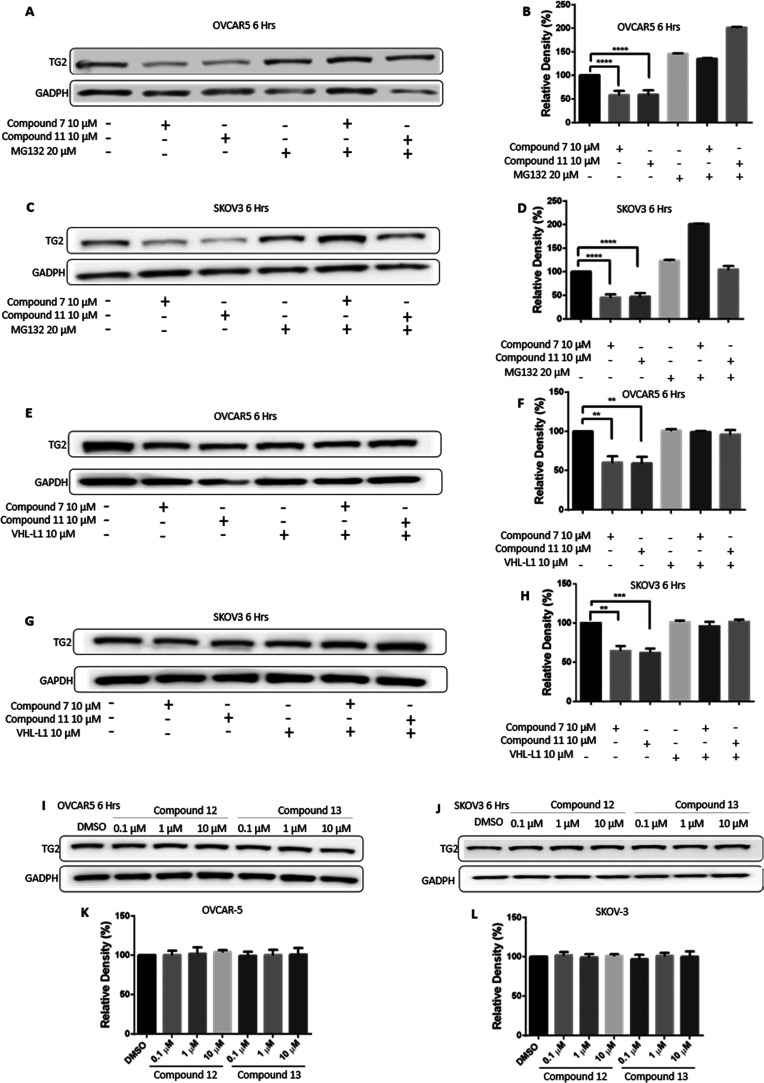
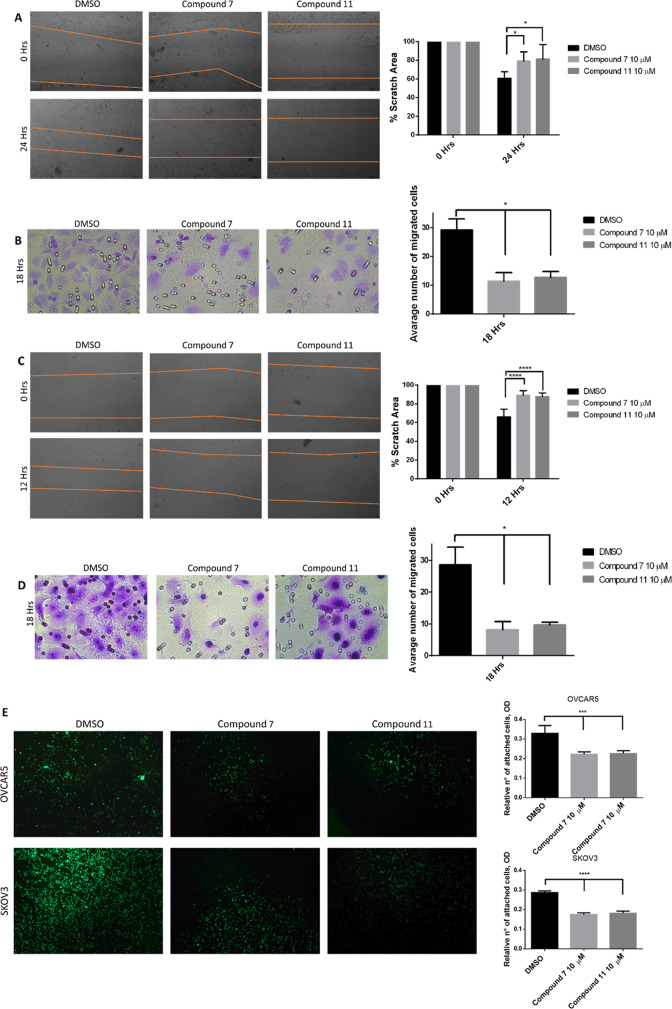
Tissue transglutaminase (TG2) is a multifunctional enzyme involved in the cross-linking of extracellular matrix proteins, formation of complexes with fibronectin (FN) and integrins, and GTP hydrolysis. TG2 is activated in several pathological conditions, including cancer. We recently described a novel series of ligands that bind to TG2 and inhibit its interaction with FN. Because TG2 acts via multiple mechanisms, we set out to pursue a targeted protein degradation strategy to abolish TG2's myriad functions. Here, we report the synthesis and characterization of a series of VHL-based degraders that reduce TG2 in ovarian cancer cells in a proteasome-dependent manner. Degradation of TG2 resulted in significantly reduced cancer cell adhesion and migration in vitro in scratch-wound and migration assays. These results strongly indicate that further development of more potent and in vivo efficient TG2 degraders could be a new strategy for reducing the dissemination of ovarian and other cancers.


Conflict of interest statement

The authors declare no competing financial interest.

Figures

Figure 1
Figure 1
Representative structures of known TG2 inhibitors (same numbering/naming as in references).
Figure 2
Figure 2
Structures of TG2 PROTACs.
Scheme 1
Scheme 1. Synthesis of New CRBN-Based TG2 Degrader Compounds
Reagents and conditions: (a) diisopropylamine (DIPEA), tetrahydrofuran (THF), methylamino-PEGn-OH, 20 °C, 12 h; (b) N-(4-aminophenyl)-2-phenyl-acetamide, AcOH, Isopropanol (IPA), 80 °C, 12 h; (c) TosCl, triethylamine (TEA), dichloromethane (DCM), 20 °C, 8 h; (d) NaN3, dimethylformamide (DMF), 50 °C, 12 h; (e) H2, Pd/C, NH4OH, MeOH, 20 °C, 12 h; (f) 2-(2,6-dioxopiperidin-3-yl)-4-fluoroisoindoline-1,3-dione, DIPEA, dimethylsulfoxide (DMSO), 60 °C, 12 h; and (g) 2-((2-(2,6-dioxopiperidin-3-yl)-1,3-dioxoisoindolin-4-yl)oxy)acetic acid, HATU, DIPEA, DMF, 20 °C, 12 h.
Scheme 2
Scheme 2. Synthesis of New VHL-Based TG2 Degrader Compounds
Reagents and conditions: (a) DIPEA, THF, methylamino-PEGn-t-butyl ester, 0 to 15 °C, 10 h; (b) N-(4-aminophenyl)-2-phenyl-acetamide, AcOH, IPA, 80 °C, 12 h; (c) HCl in ethyl acetate (4 M), 25 °C, 12 h; (d) (S,R,S)-AHPC, HATU, DIPEA, DMF, 25 °C, 12 h; and (e) (S,S,S)-AHPC hydrochloride, HATU, DIPEA, DMF, 25 °C, 12 h.
Figure 3
Figure 3
Characterization of TG2 degradation in OVCAR5 and SKOV3 cells. (A) Western blot analysis of TG2 in OVCAR5 cells treated with compounds 7 and 11 at 0.1, 1, and 10 μM at 6 h. DMSO was used as a control. (B) Western blot analysis of TG2 in SKOV3 cells treated with compounds 7 and 11 for 6 h at 1 and 10 μM. DMSO was used as a control. (C) Western blot analysis of TG2 in OVCAR5 cells treated with compounds 7 and 11 at 0.1, 1, and 10 μM at 24 h. DMSO was used as a control. (D) Western blot analysis of TG2 in SKOV3 cells treated with compounds 7 and 11 for 24 h at 1 and 10 μM. DMSO was used as a control. (E) Quantification of western blots is shown in (A) (n = 3 experimental replicates; *p < 0.05; ***p < 0.001; ****p < 0.0001). (F) Quantification of western blots is shown in (B) (n = 3 experimental replicates; **p < 0.01). (G) Quantification of western blots shown in (C) (n = 3 experimental replicates; n.s.). (H) Quantification of western blot shown in (D) (n = 3 experimental replicates; n.s.). (I) Kinetics of TG2 degradation with compound 7 based on western blot analysis in SKOV3 cells. Western blot for TG2 was performed at 0, 2, 6, 12, and 24 h using 0.1, 0.3, 1, 3, 10, and 30 μM of Compound 7. Maximum inhibition was observed at 6 h using the highest concentrations (n = 3 experimental replicates included in Supplementary Figure S2; ***p < 0.001; ****p < 0.0001). (J) Kinetics of TG2 degradation with compound 11 based on western blot analysis in SKOV3 cells. Western blot for TG2 was performed at 0, 2, 6, 12, and 24 h using 0.1, 0.3, 1, 3, 10, and 30 μM of Compound 11. Maximum inhibition was observed at 6 and 12 h using the highest concentrations (n = 3 experimental replicates included in Supplementary Figure S2; ***p < 0.001; ****p < 0.0001). (K) Western blot analysis of compounds 7 and 11 dosed every 6–8 h over 24 h in OVCAR5 cells at doses of either 1 or 10 μM. (L) Western blot analysis of compounds 7 and 11 dosed every 6–8 h over 24 h in SKOV3 cells at doses of either 1 or 10 μM. (M) The cell viability assay of OVCAR5 and SKOV3 cells treated with compound 7; no cell death was observed in either cell line when using 0.1, 0.3, 1, 3, 10, and 30 μM over the course of 5 days, dosed every 6–8 h (n = 3 replicates; n.s.). (N) The cell viability assay of OVCAR5 and SKOV3 cells treated with compound 11; no cell death was observed in either cell line using 0.1, 0.3, 1, 3, 10, and 30 μM over the course of 5 days, dosed every 6–8 h (n = 3 replicates; n.s.).
Figure 4
Figure 4
TG2 degradation is proteasome-dependent. (A) Western blot analysis for TG2 in OVCAR5 cells treated with 10 μM of compounds 7 and 11 for 6 h and the proteasome inhibitor MG132 (20 μM) for 8 h. (B) Quantification of the western blot is shown in (A). Bars represent band intensity for each condition relative to control (DMSO) (n = 3 replicates; ****p < 0.0001). (C) Western blot analysis for TG2 in SKOV3 cells using the same conditions as in (A). (D) Quantification of the western blot is shown in (C) (n = 3 replicates; ****p < 0.0001). (E) Western blot analysis for TG2 in OVCAR5 cells treated with 10 μM of Compounds 7 and 11 for 6 h along with 10 μM of the VHL ligand as a competitive inhibitor. (F) Quantification of the western blot is shown in (E) (n = 3 replicate; **p < 0.01). (G) Western blot analysis for TG2 in SKOV3 cells treated using the same conditions as in (E). (H) Quantification of the western blot is shown in (G) (n = 3 replicates; **p < 0.01; ***p < 0.001). (I) Western blot analysis using negative control compounds 12 and 13 in OVCAR5 cells. (J) Western blot analysis using negative control compounds 12 and 13 in SKOV3 cells. (K–L) Quantification of the western blot is shown in (I) and (J) (n = 3 replicates; n.s.).
Figure 5
Figure 5
Compounds 7 and 11 reduce the migration and adhesion capability of cancer cells. Cell migration was analyzed on both OVCAR5 and SKOV3 cells. (A) The wound-healing assay of the OVCAR5 cells treated with compounds 7 and 11, including quantification (n = 3 replicates; *p < 0.05). (B) The transwell migration assay of the OVCAR5 cells treated with compounds 7 and 11, including quantification (n = 3 replicates; *p < 0.05). (C) The wound-healing assay of the SKOV3 cells treated with compounds 7 and 11 and quantification (n = 3 replicates; ****p < 0.0001). (D) The transwell migration assay of the SKOV3 cells (n = 3; *p < 0.05). (E) The solid phase assay measures the adhesion of OVCAR5 and SKOV3 cells to fibronectin in the presence of control or of compounds 7 and 11 (n = 3 replicates; ***p < 0.001; ****p < 0.0001).
Figure 6
Figure 6
Isothermal calorimetry (ITC) binding studies of compounds to TG2. (A) Calorimetric titrations of 100 μM MT4 into 2 μM TG2 at 30 °C; each peak corresponds to a single injection of 2 μL. Binding of MT4 to TG2 shows a KD = 7.8 μM. The c value for this experiment is 0.26. (B) Calorimetric titrations of 200 μM 11 into 20 μM TG2 at 30 °C; each peak corresponds to a single injection of 2 μL. The binding of 11 to TG2 shows a KD = 68.9 μM. The c value for this experiment is 0.29.

Similar articles

Cited by

References

    1. Huang X.; Lin T.; Gu J.; Zhang L.; Roth J. A.; Stephens L. C.; Yu Y.; Liu J.; Fang B. Combined TRAIL and Bax gene therapy prolonged survival in mice with ovarian cancer xenograft. Gene Ther. 2002, 9, 1379–1386. 10.1038/sj.gt.3301810. - DOI - PubMed
    1. Stephens P.; Grenard P.; Aeschlimann P.; Langley M.; Blain E.; Errington R.; Kipling D.; Thomas D.; Aeschlimann D. Crosslinking and G-protein functions of transglutaminase 2 contribute differentially to fibroblast wound healing responses. J. Cell Sci. 2004, 117, 3389–3403. 10.1242/jcs.01188. - DOI - PubMed
    1. Fesus L.; Piacentini M. Transglutaminase 2: an enigmatic enzyme with diverse functions. Trends Biochem. Sci. 2002, 27, 534–539. 10.1016/S0968-0004(02)02182-5. - DOI - PubMed
    1. Akimov S. S.; Belkin A. M. Cell surface tissue transglutaminase is involved in adhesion and migration of monocytic cells on fibronectin. Blood 2001, 98, 1567–1576. 10.1182/blood.V98.5.1567. - DOI - PubMed
    1. Akimov S. S.; Krylov D.; Fleischman L. F.; Belkin A. M. Tissue transglutaminase is an integrin-binding adhesion coreceptor for fibronectin. J. Cell Biol. 2000, 148, 825–838. 10.1083/jcb.148.4.825. - DOI - PMC - PubMed

Publication types

Substances

LinkOut - more resources