Meta-Analysis
. 2023 Aug 15;29(16):3037-3050.
doi: 10.1158/1078-0432.CCR-23-0212.

ENIGMA CHEK2gether Project: A Comprehensive Study Identifies Functionally Impaired CHEK2 Germline Missense Variants Associated with Increased Breast Cancer Risk

Lenka Stolarova #  1 Petra Kleiblova #  2   3 Petra Zemankova  2   4 Barbora Stastna  2 Marketa Janatova  2 Jana Soukupova  2 Maria Isabel Achatz  5 Christine Ambrosone  6   7 Paraskevi Apostolou  8 Banu K Arun  9 Paul Auer  10   11 Mollie Barnard  12 Birgitte Bertelsen  13 Biobank JapanMarinus J Blok  14 Nicholas Boddicker  15   16 Joan Brunet  17   18 Elizabeth S Burnside  19   20 Mariarosaria Calvello  21 Ian Campbell  22   23 Sock Hoai Chan  24   25 Fei Chen  26   27 Jian Bang Chiang  24 Anna Coppa  28 Laura Cortesi  29 Ana Crujeiras-González  30   31 Consortium CZECANCAKim De Leeneer  32 Robin De Putter  32 Allison DePersia  33 Lisa Devereux  23   34 Susan Domchek  16   35 Anna Efremidis  36 Christoph Engel  37 Corinna Ernst  38 D Gareth R Evans  39 Lidia Feliubadaló  17   18 Florentia Fostira  40 Olivia Fuentes-Ríos  30   31 Encarna B Gómez-García  14 Sara González  17   18 Christopher Haiman  26   27 Thomas van Overeem Hansen  41   42 Jan Hauke  38 James Hodge  43   44 Chunling Hu  16   45 Hongyan Huang  46   47 Nur Diana Binte Ishak  24 Yusuke Iwasaki  48 Irene Konstantopoulou  40 Peter Kraft  46   47 James Lacey  49   50 Conxi Lázaro  17   18 Na Li  22 Weng Khong Lim  51 Sara Lindstrom  11   52 Adriana Lori  43   53 Elana Martinez  51   54 Alexandra Martins  55 Koichi Matsuda  56 Giuseppe Matullo  57 Simone McInerny  58 Kyriaki Michailidou  59 Marco Montagna  60 Alvaro N A Monteiro  61 Luigi Mori  62   63 Katherine Nathanson  16   35 Susan L Neuhausen  64 Heli Nevanlinna  65 Janet E Olson  15   66 Julie Palmer  12 Barbara Pasini  57 Alpa Patel  67   68 Maria Piane  69 Bruce Poppe  32 Paolo Radice  70 Alessandra Renieri  71 Nicoletta Resta  72 Marcy E Richardson  73 Toon Rosseel  32 Kathryn J Ruddy  66   74 Marta Santamariña  30   31   75 Elizabeth Santana Dos Santos  5 Lauren Teras  67   68 Amanda E Toland  76 Amy Trentham-Dietz  20   77 Celine M Vachon  78   79 Alexander E Volk  80 Nana Weber-Lassalle  38 Jeffrey N Weitzel  16   81 Lisa Wiesmuller  82 Stacey Winham  79   83 Siddhartha Yadav  16   84 Drakoulis Yannoukakos  40 Song Yao  7   85 Valentina Zampiga  86 Magnus Zethoven  22 Ze Wen Zhang  24 Tomas Zima  2 Amanda B Spurdle  87 Ana Vega  30   31   75 Maria Rossing  13 Jesús Del Valle  17   18 Arcangela De Nicolo  88 Eric Hahnen  38 Kathleen B M Claes  32 Joanne Ngeow  24   25 Yukihide Momozawa  48 Paul A James  23   55 Fergus J Couch  16   43 Libor Macurek #  1 Zdenek Kleibl #  2   4
Collaborators, Affiliations
Meta-Analysis

ENIGMA CHEK2gether Project: A Comprehensive Study Identifies Functionally Impaired CHEK2 Germline Missense Variants Associated with Increased Breast Cancer Risk

Lenka Stolarova et al. Clin Cancer Res. .

Abstract

Purpose: Germline pathogenic variants in CHEK2 confer moderately elevated breast cancer risk (odds ratio, OR ∼ 2.5), qualifying carriers for enhanced breast cancer screening. Besides pathogenic variants, dozens of missense CHEK2 variants of uncertain significance (VUS) have been identified, hampering the clinical utility of germline genetic testing (GGT).

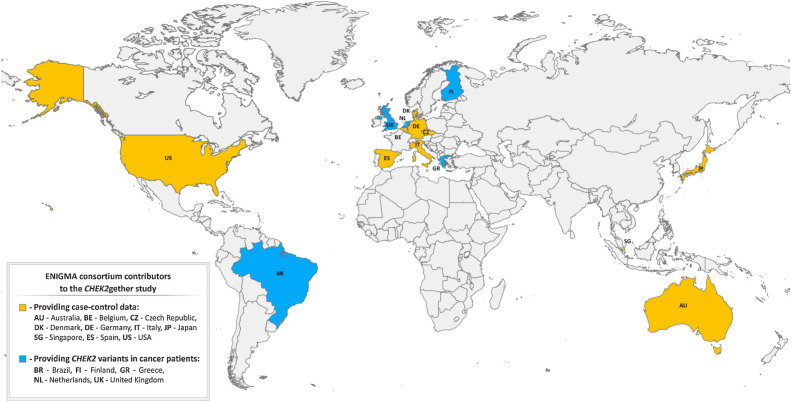
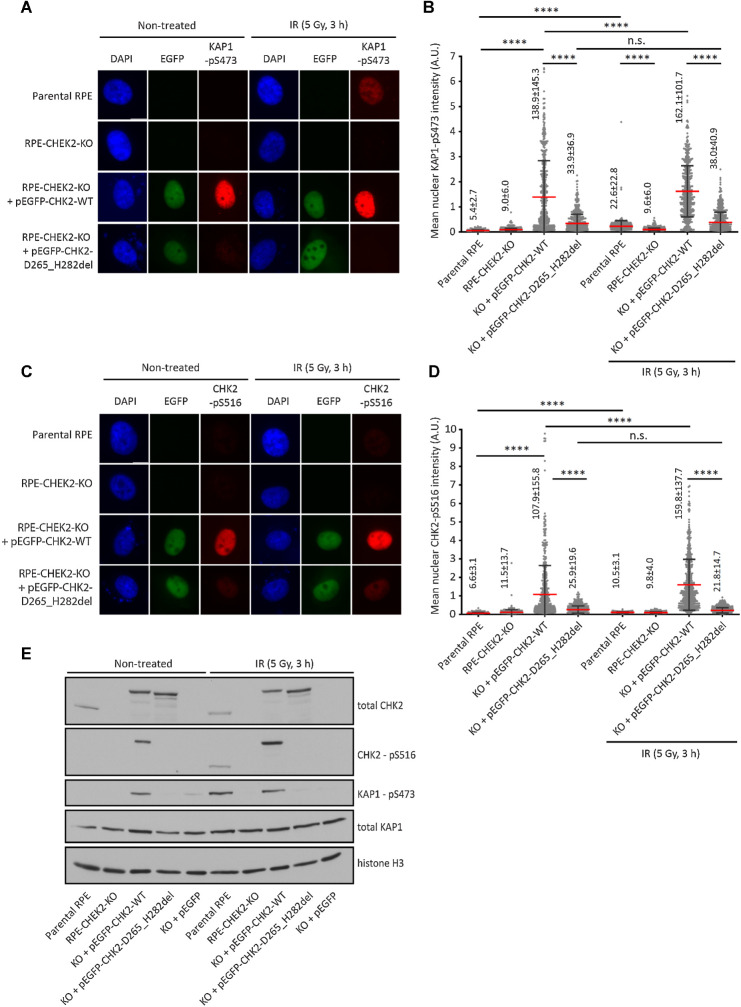
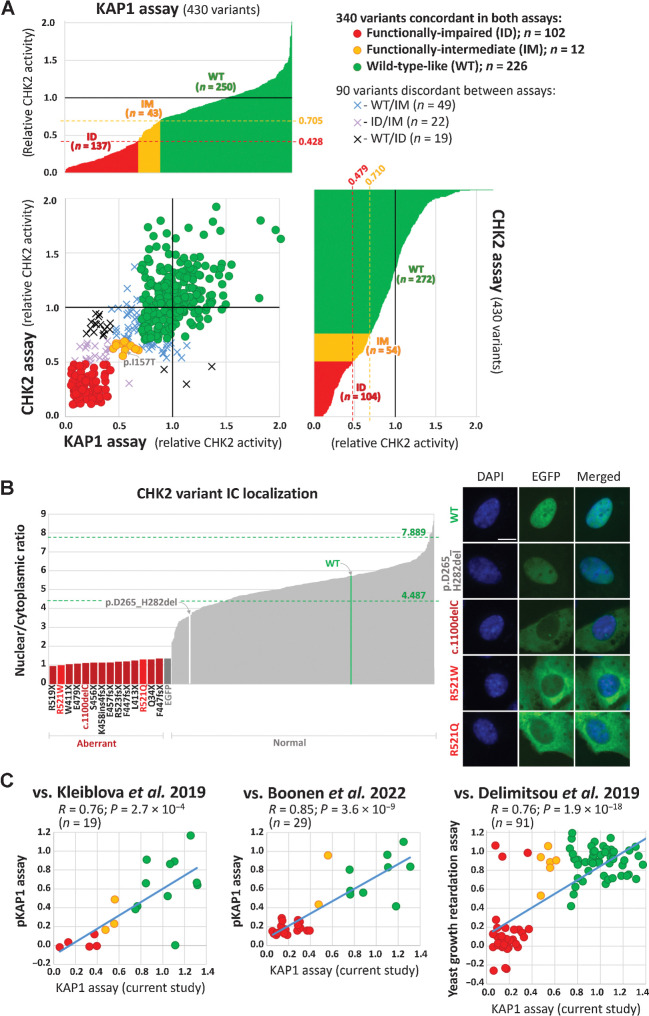
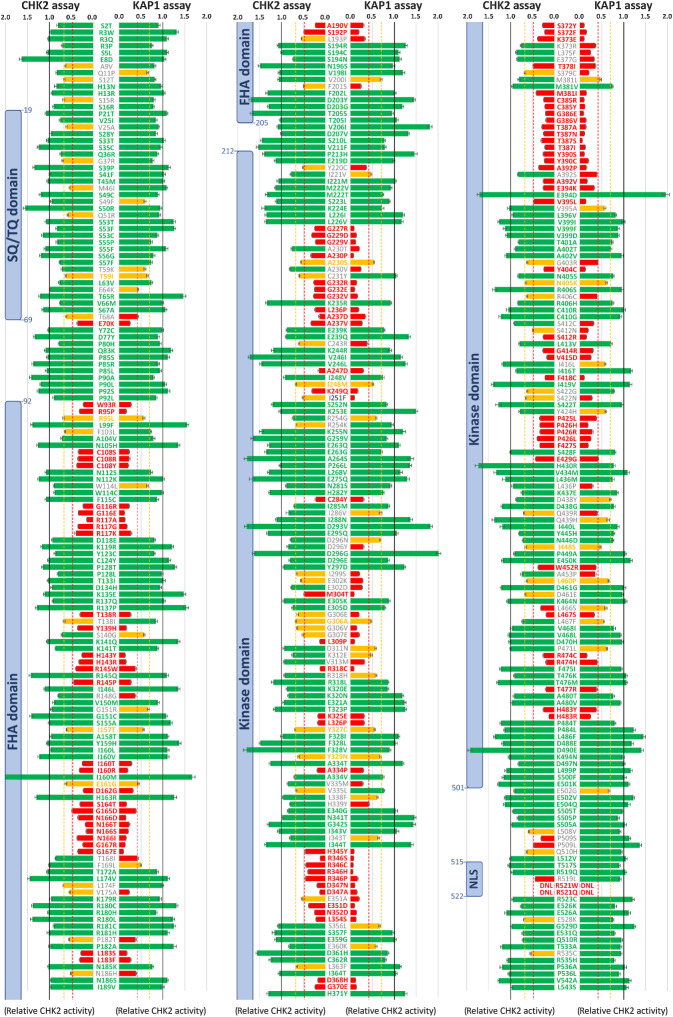
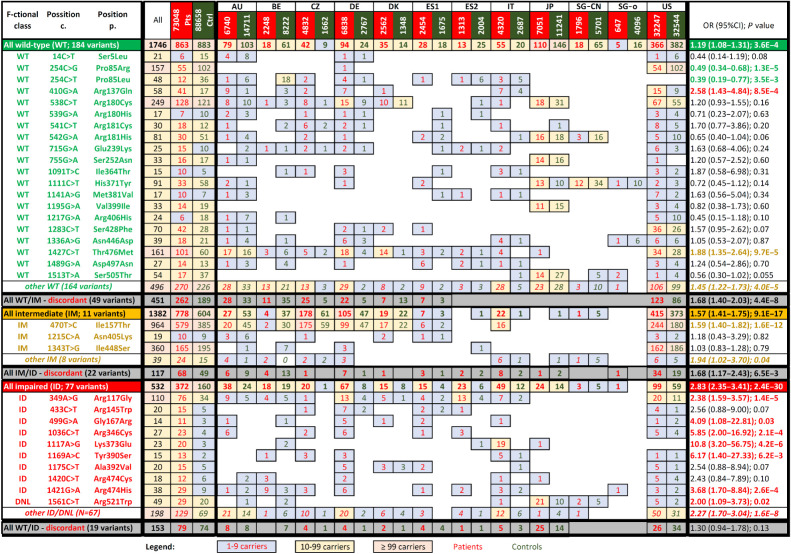
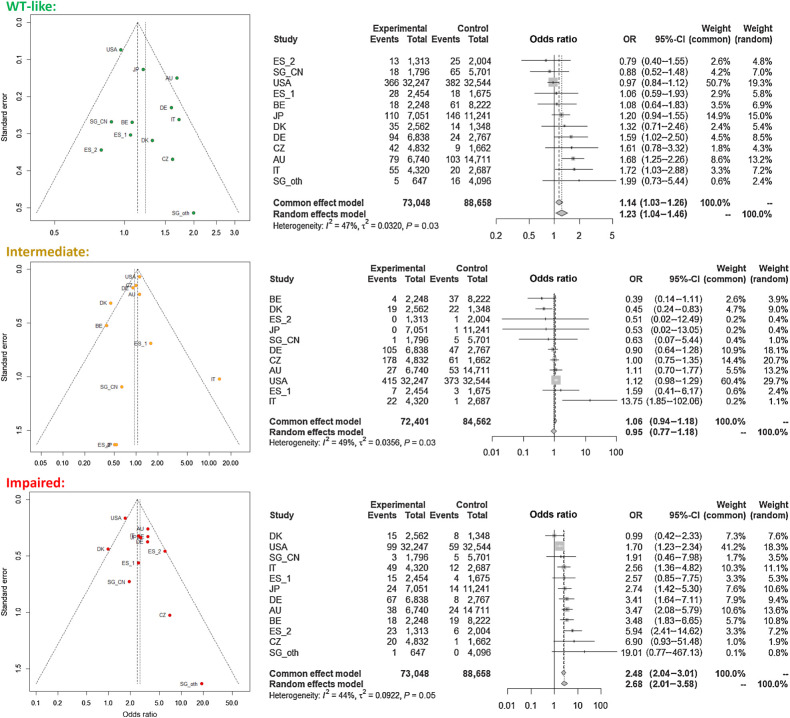
Experimental design: We collected 460 CHEK2 missense VUS identified by the ENIGMA consortium in 15 countries. Their functional characterization was performed using CHEK2-complementation assays quantifying KAP1 phosphorylation and CHK2 autophosphorylation in human RPE1-CHEK2-knockout cells. Concordant results in both functional assays were used to categorize CHEK2 VUS from 12 ENIGMA case-control datasets, including 73,048 female patients with breast cancer and 88,658 ethnicity-matched controls.

Results: A total of 430/460 VUS were successfully analyzed, of which 340 (79.1%) were concordant in both functional assays and categorized as functionally impaired (N = 102), functionally intermediate (N = 12), or functionally wild-type (WT)-like (N = 226). We then examined their association with breast cancer risk in the case-control analysis. The OR and 95% CI (confidence intervals) for carriers of functionally impaired, intermediate, and WT-like variants were 2.83 (95% CI, 2.35-3.41), 1.57 (95% CI, 1.41-1.75), and 1.19 (95% CI, 1.08-1.31), respectively. The meta-analysis of population-specific datasets showed similar results.

Conclusions: We determined the functional consequences for the majority of CHEK2 missense VUS found in patients with breast cancer (3,660/4,436; 82.5%). Carriers of functionally impaired missense variants accounted for 0.5% of patients with breast cancer and were associated with a moderate risk similar to that of truncating CHEK2 variants. In contrast, 2.2% of all patients with breast cancer carried functionally wild-type/intermediate missense variants with no clinically relevant breast cancer risk in heterozygous carriers.


Figures

Figure 1. Geographical origin of analyzed CHEK2 missense variants.
Figure 1.
Geographical origin of analyzed CHEK2 missense variants.
Figure 2. Validation of KAP1-pS473 and CHK2-pS516 antibodies. A, Parental RPE, RPE1–CHEK2-KO cells or RPE1–CHEK2-KO cells transfected with the wild-type or mutant pEGFP–CHEK2 were left untreated or were exposed to ionizing radiation (5 Gy, 3 hours). After fixation, cells were probed with KAP1-pS473 antibody. Representative images are shown. B, Quantification of A. The mean nuclear intensity of the KAP1-pS473 signal is plotted. Each dot represents one cell; more than 300 cells were analyzed. Red line, error bars and numbers indicate mean ± SDs. Statistical significance was evaluated by the Mann–Whitney test (****, P < 0.0001). A representative experiment is shown from two independent replicates. C, Cells were grown and treated as in A and were probed with CHK2-pS516 antibody. Representative images are shown. D, Quantification of C. The mean nuclear intensity of the CHK2-pS516 signal is plotted. Each dot represents one cell; more than 300 cells were analyzed. Red line, error bars and numbers indicate mean ± SDs. Statistical significance was evaluated by the Mann–Whitney test (****, P < 0.0001). A representative experiment is shown from two independent replicates. E, Cells were grown and treated as in A. Whole-cell lysates were analyzed by immunoblotting with indicated antibodies.
Figure 2.
Validation of KAP1-pS473 and CHK2-pS516 antibodies. A, Parental RPE, RPE1–CHEK2-KO cells or RPE1–CHEK2-KO cells transfected with the wild-type or mutant pEGFP–CHEK2 were left untreated or were exposed to ionizing radiation (5 Gy, 3 hours). After fixation, cells were probed with KAP1-pS473 antibody. Representative images are shown. B, Quantification of A. The mean nuclear intensity of the KAP1-pS473 signal is plotted. Each dot represents one cell; more than 300 cells were analyzed. Red line, error bars and numbers indicate mean ± SDs. Statistical significance was evaluated by the Mann–Whitney test (****, P < 0.0001). A representative experiment is shown from two independent replicates. C, Cells were grown and treated as in A and were probed with CHK2-pS516 antibody. Representative images are shown. D, Quantification of C. The mean nuclear intensity of the CHK2-pS516 signal is plotted. Each dot represents one cell; more than 300 cells were analyzed. Red line, error bars and numbers indicate mean ± SDs. Statistical significance was evaluated by the Mann–Whitney test (****, P < 0.0001). A representative experiment is shown from two independent replicates. E, Cells were grown and treated as in A. Whole-cell lysates were analyzed by immunoblotting with indicated antibodies.
Figure 3. Kinase KAP1 and CHK2 assays (A). The bar graphs show results of kinase assays for 430 CHEK2 missense variants. In both assays, variants with normalized relative CHK2 activity (mean WT-activity = 1) exceeding that of the weakest signal of WT replicas (not shown) were categorized functionally WT-like, variants with normalized signal intensity lower than the strongest signal for any of kinase-dead/empty EGFP vector controls (in-frame exon 7 deletion–p.D265_H282del; not shown) were categorized as functionally impaired. Variants with normalized CHK2 activities between these ranges were categorized functionally intermediate (0.428–0.705 and 0.479–0.710 for KAP1 and CHK2 assay, respectively; indicated by red and yellow dashed lines). Scatterplot combines results from both assays showing 340 concordant (circles) and 90 discordant (crosses) variants. The nuclear-to-cytoplasmic ratio (B) bar graph (left) displays all missense variants and a set of protein-truncating CHEK2 variants (dark red bars at left, zoomed part of the graph). The missense variants, p.R521W and p.R521Q, with an aberrant localization are highlighted as bright-red bars; the arrows denote WT (green bar) and catalytically-dead in-frame p.D265_H282del variant (white bar). The highest and lowest mean nuclear/cytoplasmic ratio values from all WT replicates are indicated by green dashed lines. Of all missense variants analyzed by ScanR microscopy, only codon 521 alterations revealed aberrant intracellular localization with intense cytoplasmic positivity (right), reminiscent of mislocalization of the c.1100delC (p.T367fsX; size bar, 10 μm) variant. In comparison, the in-frame deletion p.D265_H282del revealed normal intranuclear accumulation, similar to WT. C, Scatter plots depicting correlations between assays performed in this study and previous analyses of CHEK2 VUS. Studies of Kleiblova et al. (17) and Boonen et al. (18) used phosphorylation of KAP1 as a functional readout whereas the study of Delimitsou et al. (25) used a yeast growth retardation assay. The dots are colored according to the results of the KAP1 assay in this study (red, impaired; yellow, intermediate; green, wild-type–like). Blue line represents linear regression, R, correlation coefficient; P, P value. The scatter plot does not show the p.Arg512Trp variant classified by Boonen et al. as intermediate with impaired nuclear localization in our localization assay.
Figure 3.
Kinase KAP1 and CHK2 assays (A). The bar graphs show results of kinase assays for 430 CHEK2 missense variants. In both assays, variants with normalized relative CHK2 activity (mean WT-activity = 1) exceeding that of the weakest signal of WT replicas (not shown) were categorized functionally WT-like, variants with normalized signal intensity lower than the strongest signal for any of kinase-dead/empty EGFP vector controls (in-frame exon 7 deletion–p.D265_H282del; not shown) were categorized as functionally impaired. Variants with normalized CHK2 activities between these ranges were categorized functionally intermediate (0.428–0.705 and 0.479–0.710 for KAP1 and CHK2 assay, respectively; indicated by red and yellow dashed lines). Scatterplot combines results from both assays showing 340 concordant (circles) and 90 discordant (crosses) variants. The nuclear-to-cytoplasmic ratio (B) bar graph (left) displays all missense variants and a set of protein-truncating CHEK2 variants (dark red bars at left, zoomed part of the graph). The missense variants, p.R521W and p.R521Q, with an aberrant localization are highlighted as bright-red bars; the arrows denote WT (green bar) and catalytically-dead in-frame p.D265_H282del variant (white bar). The highest and lowest mean nuclear/cytoplasmic ratio values from all WT replicates are indicated by green dashed lines. Of all missense variants analyzed by ScanR microscopy, only codon 521 alterations revealed aberrant intracellular localization with intense cytoplasmic positivity (right), reminiscent of mislocalization of the c.1100delC (p.T367fsX; size bar, 10 μm) variant. In comparison, the in-frame deletion p.D265_H282del revealed normal intranuclear accumulation, similar to WT. C, Scatter plots depicting correlations between assays performed in this study and previous analyses of CHEK2 VUS. Studies of Kleiblova et al. (17) and Boonen et al. (18) used phosphorylation of KAP1 as a functional readout whereas the study of Delimitsou et al. (25) used a yeast growth retardation assay. The dots are colored according to the results of the KAP1 assay in this study (red, impaired; yellow, intermediate; green, wild-type–like). Blue line represents linear regression, R, correlation coefficient; P, P value. The scatter plot does not show the p.Arg512Trp variant classified by Boonen et al. as intermediate with impaired nuclear localization in our localization assay.
Figure 4. Results of KAP1 and CHK2 kinase assays for 430 successfully analyzed missense CHEK2 variants (shown as an average relative CHK2 kinase activity). Bars are colored as functionally WT-like (green), intermediate (IM; yellow), and impaired (ID; red), respectively, with thresholds for IM variants (0.428 and 0.479) and ID variants (0.705 and 0.710) for KAP1 and CHK2 assays, respectively (dashed lines). Error bars represent standard errors of mean. Color/gray letters for protein variants indicate concordant/discordant functional assays result, respectively. Blue boxes denote conserved CHK2 domains. DNL, variants that do not localize into the nucleus.
Figure 4.
Results of KAP1 and CHK2 kinase assays for 430 successfully analyzed missense CHEK2 variants (shown as an average relative CHK2 kinase activity). Bars are colored as functionally WT-like (green), intermediate (IM; yellow), and impaired (ID; red), respectively, with thresholds for IM variants (0.428 and 0.479) and ID variants (0.705 and 0.710) for KAP1 and CHK2 assays, respectively (dashed lines). Error bars represent standard errors of mean. Color/gray letters for protein variants indicate concordant/discordant functional assays result, respectively. Blue boxes denote conserved CHK2 domains. DNL, variants that do not localize into the nucleus.
Figure 5. Presence of analyzed CHEK2 missense variants categorized according to the functional assays in patients with breast cancer (BC pts; red numbers) and matched controls (dark green numbers). The association with breast cancer risk (odds ratio; OR) were calculated for prevalent variants having ≥10 carriers among patients or controls, respectively. Colors of the numbers in the last column highlight significant association with moderate-or-higher risk (red; OR > 2), low risk (OR < 2), protective variants (green) or variants without significant impact on breast cancer risk (black). Gray rows display variants that were discordant in the kinase assays. DNL, variants that do not localize into the nucleus.
Figure 5.
Presence of analyzed CHEK2 missense variants categorized according to the functional assays in patients with breast cancer (BC pts; red numbers) and matched controls (dark green numbers). The association with breast cancer risk (odds ratio; OR) were calculated for prevalent variants having ≥10 carriers among patients or controls, respectively. Colors of the numbers in the last column highlight significant association with moderate-or-higher risk (red; OR > 2), low risk (OR < 2), protective variants (green) or variants without significant impact on breast cancer risk (black). Gray rows display variants that were discordant in the kinase assays. DNL, variants that do not localize into the nucleus.
Figure 6. Funnel plot (left) and forest plots (right) for individual datasets of breast cancer cases and controls from 12 datasets (10 countries) stratified according to the functional categorization.
Figure 6.
Funnel plot (left) and forest plots (right) for individual datasets of breast cancer cases and controls from 12 datasets (10 countries) stratified according to the functional categorization.

References

    1. Zannini L, Delia D, Buscemi G. CHK2 kinase in the DNA damage response and beyond. J Mol Cell Biol 2014;6:442–57. - PMC - PubMed
    1. Bell DW, Varley JM, Szydlo TE, Kang DH, Wahrer DC, Shannon KE, et al. Heterozygous germ line hCHK2 mutations in Li-Fraumeni syndrome. Science 1999;286:2528–31. - PubMed
    1. Weischer M, Bojesen SE, Ellervik C, Tybjaerg-Hansen A, Nordestgaard BG. CHEK2*1100delC genotyping for clinical assessment of breast cancer risk: meta-analyses of 26,000 patient cases and 27,000 controls. J Clin Oncol 2008;26:542–8. - PubMed
    1. Schmidt MK, Hogervorst F, van Hien R, Cornelissen S, Broeks A, Adank MA, et al. Age- and tumor subtype-specific breast cancer risk estimates for CHEK2*1100delC carriers. J Clin Oncol 2016;34:2750–60. - PMC - PubMed
    1. Cybulski C, Gorski B, Huzarski T, Masojc B, Mierzejewski M, Debniak T, et al. CHEK2 is a multiorgan cancer susceptibility gene. Am J Hum Genet 2004;75:1131–5. - PMC - PubMed

Publication types