. 2023 Jul 14:12:e86327.
doi: 10.7554/eLife.86327.

Gaze patterns and brain activations in humans and marmosets in the Frith-Happé theory-of-mind animation task

Affiliations

Gaze patterns and brain activations in humans and marmosets in the Frith-Happé theory-of-mind animation task

Audrey Dureux et al. Elife. .

Abstract

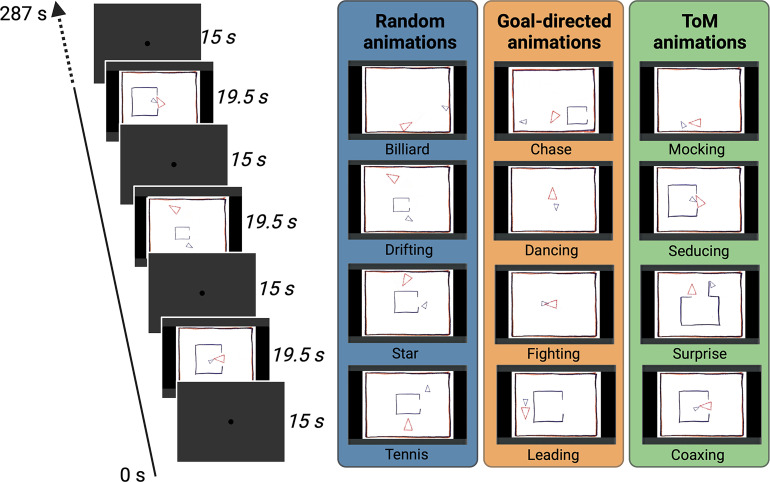
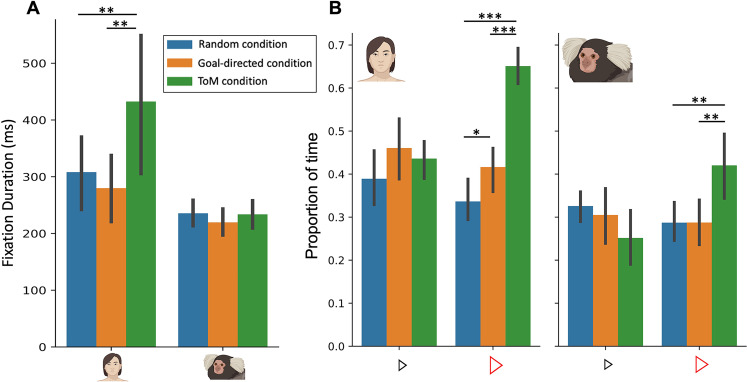
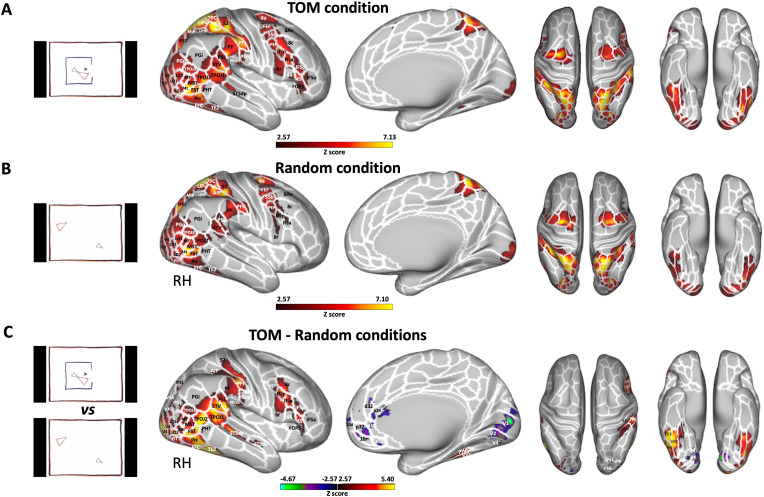
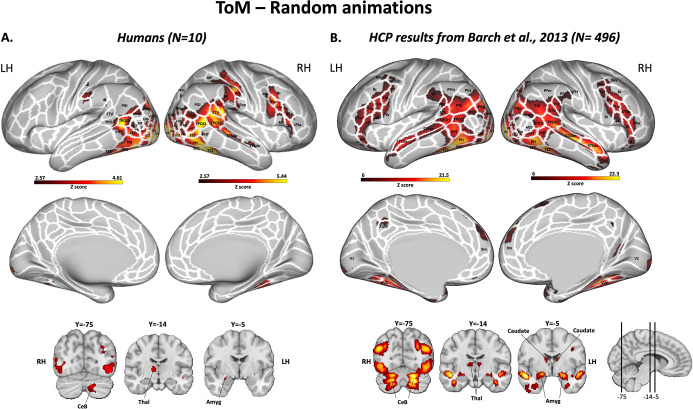
Theory of Mind (ToM) refers to the cognitive ability to attribute mental states to other individuals. This ability extends even to the attribution of mental states to animations featuring simple geometric shapes, such as the Frith-Happé animations in which two triangles move either purposelessly (Random condition), exhibit purely physical movement (Goal-directed condition), or move as if one triangle is reacting to the other triangle's mental states (ToM condition). While this capacity in humans has been thoroughly established, research on nonhuman primates has yielded inconsistent results. This study explored how marmosets (Callithrix jacchus), a highly social primate species, process Frith-Happé animations by examining gaze patterns and brain activations of marmosets and humans as they observed these animations. We revealed that both marmosets and humans exhibited longer fixations on one of the triangles in ToM animations, compared to other conditions. However, we did not observe the same pattern of longer overall fixation duration on the ToM animations in marmosets as identified in humans. Furthermore, our findings reveal that both species activated extensive and comparable brain networks when viewing ToM versus Random animations, suggesting that marmosets differentiate between these scenarios similarly to humans. While marmosets did not mimic human overall fixation patterns, their gaze behavior and neural activations indicate a distinction between ToM and non-ToM scenarios. This study expands our understanding of nonhuman primate cognitive abilities, shedding light on potential similarities and differences in ToM processing between marmosets and humans.

Keywords: Callithrix jacchus; Frith-Happé animations; Theory of Mind; eye tracking; fMRI; human; marmoset monkeys; neuroscience.

Plain language summary

In our daily life, we often guess what other people are thinking or intending to do, based on their actions. This ability to ascribe thoughts, intentions or feelings to others is known as Theory of Mind. While we often use our Theory of Mind to understand other humans and interpret social interactions, we can also apply our Theory of Mind to assign feelings and thoughts to animals and even inanimate objects. For example, people watching a movie where the characters are represented by simple shapes, such as triangles, can still see a story unfold, because they infer the triangles’ intentions based on what they see on the screen. While it is clear that humans have a Theory of Mind, how the brain manages this capacity and whether other species have similar abilities remain open questions. Dureux et al. used animations showing abstract shapes engaging in social interactions and advanced brain imaging techniques to compare how humans and marmosets – a type of monkey that is very social and engages in shared childcare – interpret social cues. By comparing the eye movements and brain activity of marmosets to human responses, Dureux et al. wanted to uncover common strategies used by both species to understand social signals, and gain insight into how these strategies have evolved. Dureux et al. found that, like humans, marmosets seem to perceive a difference between shapes interacting socially and moving randomly. Not only did their gaze linger longer on certain shapes in the social scenario, but their brain activity also mirrored that of humans viewing the same scenes. This suggests that, like humans, marmosets possess an inherent ability to interpret social scenarios, even when they are presented in an abstract form, providing a fresh perspective on primates’ abilities to interpret social cues. The findings of Dureux et al. have broad implications for our understanding of human social behavior and could lead to the development of better communication strategies, especially for individuals social cognitive conditions, such as Autism Spectrum Disorder. However, further research will be needed to understand the neural processes underpinning the interpretation of social interactions. Dureux et al.’s research indicates that the marmoset monkey may be the ideal organism to perform this research on.


Conflict of interest statement

AD, AZ, JS, RM, SE No competing interests declared

Figures

Figure 1.
Figure 1.. Task Design.
Two different conditions of video clips resulting in eight animations were used during the scanning (ToM and Random animations), and an additional condition with four animations was used for the eye-tracking (ToM, GD and Random animations). In the ToM animations, one triangle reacted to the other triangle’s mental state, whereas in the Random animations the same two triangles did not interact with each other. In the GD animations, the two triangles interact with simple intentions. Each animation video lasted 19.5 s and was separated by baseline blocks of 15 s where a central dot was displayed in the center of the screen. In the fMRI task, several runs were used with a Randomized order of the two conditions whereas in the eye-tracking task one run containing all the twelve animations once was used.
Figure 2.
Figure 2.. Fixation duration (A) and proportion of time looking triangles (B) in Frith-Happé’s ToM, GD and Random animations in humans (left) and marmosets (right).
(A). Bar plot depicting the fixation duration in the screen as a function of each condition. (B). Bar plot representing the proportion of time the radial distance between the current gaze position and each triangle was within 4 visual degrees, as a function of each condition. Green represents results obtained for ToM animation videos, orange represents results for GD animation videos and blue represents results for Random animation videos. In each graph, the left panel shows the results for 11 humans and the right panel for 11 marmosets. Each colored bar represents the group mean and the vertical bars represent the standard error from the mean. The differences between conditions were tested using ANOVA: p<0.05*, p<0.01** and p<0.001***.
Figure 3.
Figure 3.. Brain networks involved in processing of Frith-Happé’s ToM and Random animations in humans.
Group functional maps displayed on right fiducial (lateral and medial views) and left and right fiducial (dorsal and ventral views) of human cortical surfaces showing significant greater activations for ToM condition (A), Random condition (B) and the comparison between ToM and Random conditions (C). The white line delineates the regions based on the recent multi-modal cortical parcellation atlas (Glasser et al., 2016). The maps depicted are obtained from 10 human subjects with an activation threshold corresponding to z-scores >2.57 for regions with yellow/red scale or z-scores <–2.57 for regions with purple/green scale (AFNI’s 3dttest++, cluster-forming threshold of p<0.01 uncorrected and then FWE-corrected α=0.05 at cluster-level from 10000 Monte-Carlo simulations).
Figure 3—figure supplement 1.
Figure 3—figure supplement 1.. Brain networks involved in ToM animations processing in humans.
Group functional maps showing significant greater activations for the comparison between ToM animations and Random animations displayed on the left and right fiducial human cortical surfaces (lateral and medial views) as well as on coronal slices, to illustrate the activations in subcortical areas. The white line delineates the regions based on the recent multi-modal cortical parcellation atlas (Glasser et al., 2016). (A) The map depicted is obtained from 10 human subjects with an activation threshold corresponding to z-scores>2.57 (AFNI’s 3dttest++, cluster-forming threshold of p<0.01 uncorrected and then FWE-corrected α=0.05 at cluster-level from 10000 Monte-Carlo simulations). The subcortical maps correspond to an activation threshold of z-scores>3.29 (AFNI’s 3dttest++, threshold of p<0.001 uncorrected). (B) The map depicted has been downloaded from https://identifiers.org/neurovault.image:3179 and is described in the study of Barch et al., 2013. The brain areas reported have activation threshold corresponding to z-scores>6, uncorrected.
Figure 3—figure supplement 2.
Figure 3—figure supplement 2.. Image and temporal signal-to-noise-ration (SNR) calculated on fMRI data acquired at 7T with an AC-84 Mark II gradient coil, an in-house 8-channel transmit, and a 32-channel receive coil (see methods, main text).
(A). Image SNR maps from gradient-echo-images obtained from Gilbert et al., 2021. (B) Temporal SNR (i.e. ratio of the mean signal to the standard deviation through the time course) for EPI BOLD images obtained from one run of one participant. The mean tSNR calculated within peripheral brain regions nearest the coil elements is 10% higher for right hemisphere than tSNR produced by left hemisphere.
Figure 4.
Figure 4.. Brain networks involved in processing of Frith-Happé’s ToM and Random animations in marmosets.
Group functional maps showing significant greater activations for ToM condition (A), Random condition (B) and the comparison between ToM and Random conditions (C). Group map obtained from six marmosets displayed on lateral and medial views of the right fiducial marmoset cortical surfaces as well as dorsal and ventral views of left and right fiducial marmoset cortical surfaces. The white line delineates the regions based on the Paxinos parcellation of the NIH marmoset brain atlas (Liu et al., 2018). The brain areas reported have activation threshold corresponding to z-scores >2.57 (yellow/red scale) or z-scores <–2.57 (purple/green scale) (AFNI’s 3dttest++, cluster-forming threshold of p<0.01 uncorrected and then FWE-corrected α=0.05 at cluster-level from 10,000 Monte-Carlo simulations).
Figure 5.
Figure 5.. Brain network involved during processing of ToM compared to Random Frith-Happé’s animations in both humans (A) and marmosets (B).
Group functional maps showing significant greater activations for ToM animations compared to Random animations. (A) Group map obtained from 10 human subjects displayed on the left and right human cortical flat maps. The white line delineates the regions based on the recent multi-modal cortical parcellation atlas (Glasser et al., 2016). (B) Group map obtained from 6 marmosets displayed on the left and right marmoset cortical flat maps. The white line delineates the regions based on the Paxinos parcellation of the NIH marmoset brain atlas (Liu et al., 2018). The brain areas reported in A and B have activation threshold corresponding to z-scores >2.57 (yellow/red scale) or z-scores <–2.57 (purple/green scale) (AFNI’s 3dttest++, cluster-forming threshold of p<0.01 uncorrected and then FWE-corrected α=0.05 at cluster-level from 10,000 Monte-Carlo simulations).
Figure 5—figure supplement 1.
Figure 5—figure supplement 1.. Subcortical activations during processing of Frith-Happé’s ToM and Random animations in humans (left) and marmosets (right).
Group subcortical functional maps showing significant greater activations for ToM condition (A), Random condition (B) and the comparison between ToM and Random conditions (C). Group maps displayed on coronal slices obtained from ten humans (left side) and 6 marmosets (right side). The brain areas reported have activation threshold corresponding to z-scores>3.29 (AFNI’s 3dttest++, threshold of p<0.001 uncorrected). CeB, cerebellum; THA-VP, ventroposterior thalamus; THA-DA, dorsoanterior thalamus; THA-VA, ventroanterior thalamus; Amyg, amygdala; Hipp, hippocampus; Pul, pulvinar; SC, superior colliculus; LGN, lateral geniculate nucleus.

Update of

  • doi: 10.1101/2023.01.16.524238

Similar articles

Cited by

References

    1. Abell F, Happé F, Frith U. Do triangles play tricks? Attribution of mental states to animated shapes in normal and abnormal development. Cognitive Development. 2000;15:1–16. doi: 10.1016/S0885-2014(00)00014-9. - DOI
    1. Atsumi T, Nagasaka Y. Perception of chasing in squirrel monkeys (Saimiri sciureus) Animal Cognition. 2015;18:1243–1253. doi: 10.1007/s10071-015-0893-x. - DOI - PubMed
    1. Atsumi T, Koda H, Masataka N. Goal attribution to inanimate moving objects by Japanese macaques (Macaca fuscata) Scientific Reports. 2017;7:40033. doi: 10.1038/srep40033. - DOI - PMC - PubMed
    1. Barch DM, Burgess GC, Harms MP, Petersen SE, Schlaggar BL, Corbetta M, Glasser MF, Curtiss S, Dixit S, Feldt C, Nolan D, Bryant E, Hartley T, Footer O, Bjork JM, Poldrack R, Smith S, Johansen-Berg H, Snyder AZ, Van Essen DC, WU-Minn HCP Consortium Function in the human connectome: task-fMRI and individual differences in behavior. NeuroImage. 2013;80:169–189. doi: 10.1016/j.neuroimage.2013.05.033. - DOI - PMC - PubMed
    1. Bliksted V, Frith C, Videbech P, Fagerlund B, Emborg C, Simonsen A, Roepstorff A, Campbell-Meiklejohn D. Hyper- and hypomentalizing in patients with first-episode schizophrenia: fMRI and behavioral studies. Schizophrenia Bulletin. 2019;45:377–385. doi: 10.1093/schbul/sby027. - DOI - PMC - PubMed

Publication types

Grants and funding