. 2023 Nov;60(11):6346-6361.
doi: 10.1007/s12035-023-03455-z. Epub 2023 Jul 14.

Different Chronic Stress Paradigms Converge on Endogenous TDP43 Cleavage and Aggregation

Affiliations

Different Chronic Stress Paradigms Converge on Endogenous TDP43 Cleavage and Aggregation

Niccolò Candelise et al. Mol Neurobiol. 2023 Nov.

Abstract

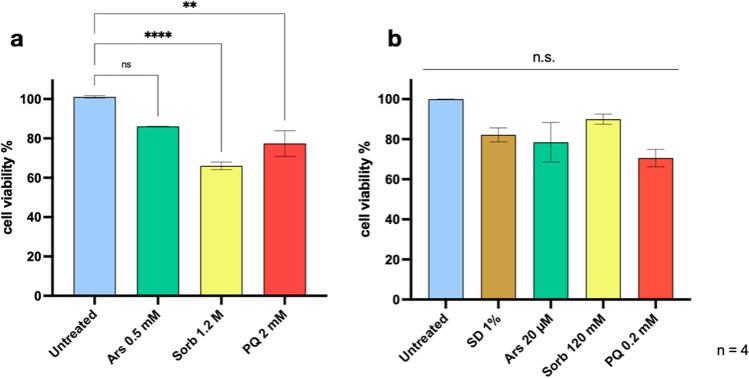
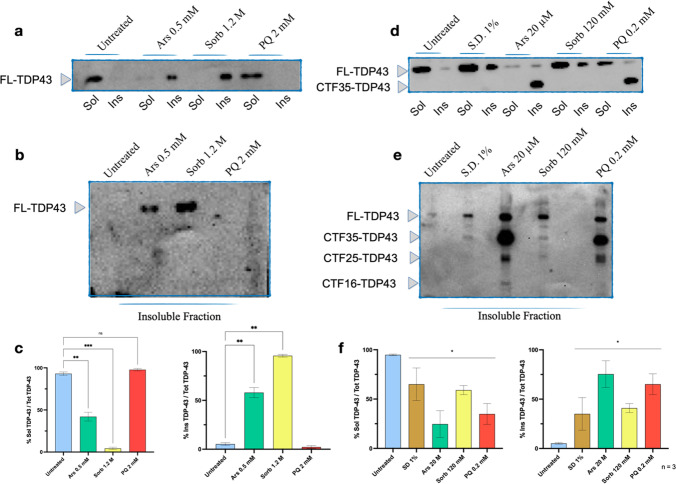
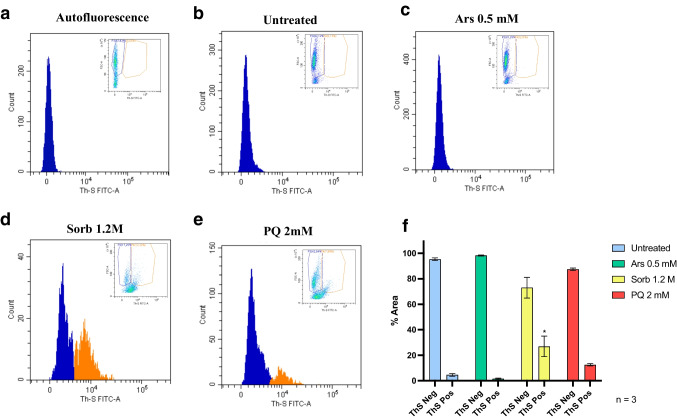
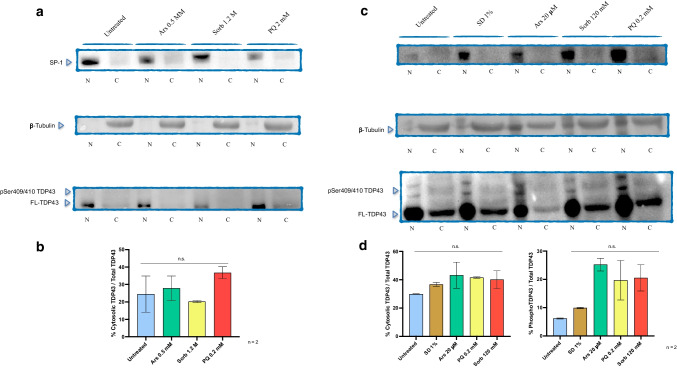
The TAR-DNA binding protein (TDP43) is a nuclear protein whose cytoplasmic inclusions are hallmarks of Amyotrophic Lateral Sclerosis (ALS). Acute stress in cells causes TDP43 mobilization to the cytoplasm and its aggregation through different routes. Although acute stress elicits a strong phenotype, is far from recapitulating the years-long aggregation process. We applied different chronic stress protocols and described TDP43 aggregation in a human neuroblastoma cell line by combining solubility assays, thioflavin-based microscopy and flow cytometry. This approach allowed us to detect, for the first time to our knowledge in vitro, the formation of 25 kDa C-terminal fragment of TDP43, a pathogenic hallmark of ALS. Our results indicate that chronic stress, compared to the more common acute stress paradigm, better recapitulates the cell biology of TDP43 proteinopathies. Moreover, we optimized a protocol for the detection of bona fide prions in living cells, suggesting that TDP43 may form amyloids as a stress response.

Keywords: Amyotrophic Lateral Sclerosis; Chronic stress; Prion; TDP43; Thioflavin.


Conflict of interest statement

The authors have no relevant financial or non-financial interests to disclose.

Figures

Fig. 1
Fig. 1
Assessment of cell viability after acute and chronic treatments. (a) Acute treatments causes a significant reduction in MTT absorbance, reflecting a reduced metabolic activity, upon treatment with 1.2 M Sorb (****, p < 0.0001) or 2 mM PQ (**, p < 0.01). Ars treatment failed to reach significance, although a trend towards reduced metabolic activity is observed compared to untreated cells. (b) Chronic treatment failed to reach significance in each condition tested, showing only a general trend in the reduction of cell viability as compared to untreated controls. Statistical analysis was performed on quadruplicates by One-way ANOVA with multiple comparisons against untreated control. (acute: F = 13.05; chronic: F = 1.851)
Fig. 2
Fig. 2
TDP43 solubility upon acute and chronic treatment. (a) Representative Western Blot showing the presence of RIPA-insoluble forms (Ins) of TDP43 after acute treatment with Ars and Sorb, while only RIPA-soluble (Sol) TDP43 could be found in untreated and acute PQ-treated samples. (b) Representative Western Blot showing a longer exposure performed on Ins fractions after acute stress. (c) Densitometric analysis was performed on biological triplicates as ratio between soluble or insoluble TDP43 and total TDP43. A significant reduction in the amount of Sol TDP43 was found between untreated samples and Ars-treated (*, p < 0.05) and between untreated and Sorb-treated samples (***, p < 0.001). Accordingly, a significant increase in the amount of Ins TDP43 was found between untreated samples and Ars-treated (**, p < 0.01). and between untreated and Sorb-treated samples (**, p < 0.01). (d) Representative Western Blot showing the presence of Ins TDP43 after chronic treatment in all stressful conditions tested. (e) Representative Western Blot showing a longer exposure of Ins fractions, revealing the presence of multiple TDP43 cleavage products. (f) Densitometric analysis was performed on triplicates as ratio between Sol or Ins TDP43 and total TDP43. A significant reduction in soluble TDP43 was found upon treatments compared to untreated control (*, p < 0.05). Each stressors elicited the formation of TDP43 insoluble species, with significant difference compared to untreated cells (*, p < 0.05). Data are shown as mean ± S.E.M. and were analyzed by One-way ANOVA with multiple comparisons using untreated control as reference (acute soluble: F = 152.1; acute insoluble: F = 154.8; chronic soluble: F = 6.101; chronic insoluble: F = 5.244)
Fig. 3
Fig. 3
Overall amyloid burden after acute treatment detected by ThS staining through flow cytometry, plotting cell count versus ThS fluorescence emission. Blue curves represent ThS negative events, orange curves represent ThS positive events. (a) Autofluorescence and (b) untreated control showed no background staining; acute Ars (c) samples showed no increase of ThS signal. A mild but significant increase (* p < 0.05, n = 3) could be observed after acute Sorb treatment (d), whereas minimal but not significant increase in ThS signal could be observed upon PQ treatment (e). Statistical analysis was performed by One-way ANOVA with multiple comparisons against untreated control (f) (F = 5.960)
Fig. 4
Fig. 4
Overall amyloid burden after chronic treatment detected by ThS staining through flow cytometry, plotting cell count versus ThS fluorescence emission. Blue curves represent ThS negative events, orange curves represent ThS positive events. (a) No ThS fluorescence signal was observed in untreated cells. A mild but significant increase (* p < 0.05) in ThS signal could be detected upon chronic starvation (b), while Ars (c), Sorb (d) and PQ (e) chronic treatment caused an overt ThS positive peak (**** p < 0.0001, n = 4). Statistical analysis was performed by One-way ANOVA with multiple comparisons against untreated control (f) (F = 56.48)
Fig. 5
Fig. 5
TDP43 mobilization upon acute treatments. Representative images of immunofluorescence staining of acute treated SH-SY5Y cells are shown for DAPI (blue), TDP43 (red) and ThS (green) and merged colors for each condition. Details are shown at greater magnification (labelled as “high”), in which arrows indicate ThS positive cytoplasmic puncta (green), TDP43 positive cytoplasmic puncta (red) and nuclear puncta (n, red) and ThS positive, TDP43 positive cytoplasmic puncta (yellow). Scale bar = 20 µm
Fig. 6
Fig. 6
TDP43 mobilization upon chronic treatments. Representative images of IF staining of chronic treated SH-SY5Y cells are shown for DAPI (blue), TDP43 (red) and ThS (green) and merged colors for each condition. Details are shown at greater magnification (labelled as “high”), in which arrows indicate ThS positive cytoplasmic puncta (green), TDP43 positive cytoplasmic puncta (red) and nuclear puncta (n, red) and ThS positive, TDP43 positive cytoplasmic puncta (yellow). Scale bar = 20 µm
Fig. 7
Fig. 7
TDP43 subcellular localization after acute and chronic treatments. (a) Representative Western blots showing nuclear and cytosolic TDP43 upon acute stress. Nuclear and cytosolic markers (SP-1 and β-Tubulin, respectively) are shown as well. No phospho-TDP43 (pSer409/410) could be detected. (b) Densitometric analysis was performed on biological duplicates and expressed as ratio percentage between cytosolic TDP43 and total TDP43 calculated as sum of all TDP43 bands. No significant differences were found in this setting (One-way ANOVA, F = 2.225). (c) Representative Western blots showing nuclear and cytosolic TDP43 upon chronic stress along with nuclear and cytosolic markers. Cytosolic TDP43 was found in each condition tested, including untrated controls. Bands coherent with the presence of phosphoTDP43 could be found in every condition tested, with the highest signal deriving from PQ, Sorb and Ars. Although not significant, a trend in increased cytosolic and phosphorylated TDP43 could be detected compared to untreated controls (d) (One way ANOVA, F = 0.912 and F = 6.779, respectively. Data are shown as mean ± S.E.M

Similar articles

Cited by

  • Dysregulated FOXO1 activity drives skeletal muscle intrinsic dysfunction in amyotrophic lateral sclerosis.
    Zufiría M, Pikatza-Menoio O, Garciandia-Arcelus M, Bengoetxea X, Jiménez A, Elicegui A, Levchuk M, Arnold-García O, Ondaro J, Iruzubieta P, Rodríguez-Gómez L, Fernández-Pelayo U, Muñoz-Oreja M, Aiastui A, García-Verdugo JM, Herranz-Pérez V, Zulaica M, Poza JJ, Ruiz-Onandi R, Fernández-Torrón R, Espinal JB, Bonilla M, Lersundi A, Fernández-Eulate G, Riancho J, Vallejo-Illarramendi A, Holt IJ, Sáenz A, Malfatti E, Duguez S, Blázquez L, López de Munain A, Gerenu G, Gil-Bea F, Alonso-Martín S. Zufiría M, et al. Acta Neuropathol. 2024 Sep 16;148(1):43. doi: 10.1007/s00401-024-02794-y. Acta Neuropathol. 2024. PMID: 39283487 Free PMC article.

References

    1. Kawakami I, Arai T, Hasegawa M. The basis of clinicopathological heterogeneity in TDP-43 proteinopathy. Acta Neuropathol. 2019;138(5):751–770. doi: 10.1007/s00401-019-02077-x. - DOI - PMC - PubMed
    1. Mackenzie IR, Bigio EH, Ince PG, Geser F, Neumann M, Cairns NJ, Kwong LK, Forman MS, et al. Pathological TDP-43 distinguishes sporadic amyotrophic lateral sclerosis from amyotrophic lateral sclerosis with SOD1 mutations. Ann Neurol. 2007;61(5):427–434. doi: 10.1002/ana.21147. - DOI - PubMed
    1. de Boer EMJ, Orie VK, Williams T, Baker MR, De Oliveira HM, Polvikoski T, Silsby M, Menon P, et al. TDP-43 proteinopathies: a new wave of neurodegenerative diseases. J Neurol Neurosurg Psychiatry. 2020;92(1):86–95. doi: 10.1136/jnnp-2020-322983. - DOI - PMC - PubMed
    1. Robinson JL, Geser F, Stieber A, Umoh M, Kwong LK, Van Deerlin VM, Lee VM, Trojanowski JQ. TDP-43 skeins show properties of amyloid in a subset of ALS cases. Acta Neuropathol. 2013;125(1):121–131. doi: 10.1007/s00401-012-1055-8. - DOI - PMC - PubMed
    1. Suk TR, Rousseaux MWC. The role of TDP-43 mislocalization in amyotrophic lateral sclerosis. Mol Neurodegener. 2020;15(1):45. doi: 10.1186/s13024-020-00397-1. - DOI - PMC - PubMed